
Choquet Integral based Feature Selection for Early Breast Cancer
Diagnosis from MRIs
Soumaya Trabelsi Ben Ameur
1,2
, Florence Cloppet
1
, Dorra Sellami Masmoudi
2
and Laurent Wendling
1
1
Intelligent System of Perception Group, LIPADE Lab, Paris Descartes University, 45 Saint Pères Street, Paris, France
2
Computor Imaging and Electronic Systems Group (CIEL), National Engineering School of Sfax (ENIS), Sfax, Tunisia
Keywords: Breast Cancer, Computer Aided Diagnosis, Mammography, Ultrasound, MRI, Dual-energy Contrast-
Enhanced Digital Mammography, Choquet Integral.
Abstract: This paper focuses on breast cancer of the mammary gland. Both basic segmentation steps and usual features
are recalled. Then textural and morphological information are combined to improve the overall performance
of breast MRI in a computer-aided system. A model of selection based on Choquet integral is provided. Such
model is suitable when handling with a weak amount of data even ambiguous in some extent. Achieved results
compared to well-known classification methods show the interest of our approach.
1 INTRODUCTION
Breast cancer is a malignant tumor of the mammary
gland due to the presence of abnormal cells in the
breast tissue. In order to reduce the risk of mortality
and have an adequate treatment, the doctor can make
several different screenings: mammography,
ultrasound, breast MRI, Dual-Energy Contrast-
Enhanced Digital Mammography DECEDM and
other additional detection exams. Therefore they are
faced with a problem of melting and data decision.
Radiologists tend to describe a mass according to its
shape, outline, optical density, etc. The diagnosis of
breast mass is a difficult task, even for an expert
radiologist, because its morphological aspects can be
very subtle and hard to diagnose visually. Therefore,
Computer-Aided Diagnosis (CAD) has been
proposed to support radiologists in the discrimination
of malignant and benign lesion. These approaches are
usually based on three steps: segmentation of the
mass, extraction of characteristics and classification
into malignant and benign. Features extracted from
breast images are classified into texture features,
shape descriptors and kinetic features. There are
attributes that are not necessarily relevant for taking
the decision, and they can induce an error in the
classification thus a multi-criteria selection is
necessary. Choquet integral aims at providing a
robust decision model even with a small training
database (which is the case of our study). This method
allows to select and classify the most significant and
pertinent attributes.
2 DETECTION AND ANALYSIS
SYSTEM
Breast pathologies are classified into two types:
microcalcifications and breast masses. In our study
we are interested to the detection of breast masses.
Breast masses are found in several shots. they are
generally characterized by their shape and contour.
Round or oval masses with well-defined limits are
rather benign lesions. While lobulated and undefined
limits masses are malignant. Breast density
characterizes the heterogeneity of the breast tissue, it
has a link with breast cancer because it has an impact
on the reliability of the interpretation of medical
images. Medical imaging has a crucial role in
reducing breast cancer mortality, by making possible
early detection through screening. Several breast
imaging exists such as mammography, ultrasound,
breast MRI and DECEDM, etc.
Ameur, S., Cloppet, F., Masmoudi, D. and Wendling, L.
Choquet Integral based Feature Selection for Early Breast Cancer Diagnosis from MRIs.
DOI: 10.5220/0005754703510358
In Proceedings of the 5th International Conference on Pattern Recognition Applications and Methods (ICPRAM 2016), pages 351-358
ISBN: 978-989-758-173-1
Copyright
c
2016 by SCITEPRESS – Science and Technology Publications, Lda. All rights reserved
351

2.1 Mammography
As the primary imaging modality for early detection
and diagnosis of breast cancer, mammography has
achieved significant success. A mammography is a
breast radiography which allows to obtain images of
breast tissue using X-rays to detect anomalies. Radio-
opaque areas are clear and correspond to the fibro-
glandular tissue and calcium. A mammogram is
performed either for breast cancer screening or to
diagnose the presence of symptoms. Mammography
is accessible and non-traumatic, it allows a well
visualizing of microcalcifications. However, the
superposition of different breast tissues limits breast
exploration, a high breast density can be the cause of
an analytical problem and small tumors could be
undetected.
2.2 Ultrasound
The ultrasound breast examination is conventionally
used in addition to mammography, for a differential
diagnosis for cystic lesion/solid lesion and to explore
palpable breast lesions without mammography
translation. It can be a first-line examination of young
women (significant breast density), pregnant women
and patients with breast inflammation. Ultrasound is
a quick and easy exam even in case of dense breast
but exploration of greasy breast is hard. The principal
limits of this modality are its non-reproducibility and
its sensitivity to motion.
2.3 Breast MRI
Breast Magnetic Resonance Imaging is a second line
examination, which comes after mammography and
often after ultrasound, first for high-risk women
because they had many antecedents of cancers in the
family, or that they inherited an abnormal gene
family. It has also been used to elucidate problems of
diagnosis that have not been resolved after the
mammogram and ultrasound. The injection of
contrast agent might be necessary to visualize areas
difficult to explore. The interpretation of breast MRI
is based on the perception of the contrast
enhancement that varies according to the type of
lesion. A quantitative analysis is used to divide the
curve, according to the initial peak, into two parts: the
initial enhancement and the delayed phase. The initial
enhancement can be slow (for benign lesion),
medium (intermediate) or fast (suggestive of
malignancy). In delayed phase, three types of contrast
enhancement are possible: persistent (Benin), tray
(intermediate) and washout (malignant). Breast MRI
is non-invasive and non-irradiating technique, it
allows to study the tumor vasculature independently
of breast density. But it is expensive, it has a limited
availability, a low specificity and doesn’t visualize
microcalcifications very well.
2.4 Dual-energy Contrast-Enhanced
Digital Mammography DECEDM
Dual energy contrast enhanced digital mammography
DECEDM is a promising new modality that combines
mammography and contrast agent injection (iodine).
It aims to acquire, in addition to the usual
morphological information, data about breast
vascularization. DECEDM has a quick and easy
image access and analysis and gives a better
appreciation of tumor spread in the case of an
architectural disorganization the mammography. On
the other side, it doesn’t detect weak vascularized
tumors, an enhancement matrix increases the number
of false positives and the fuzzy kinetics increases
false negatives.
The complementarity between these different
modalities gave us the idea to extract features from
more than one modality to have a better recognition
and description of the tumor. Because of the non-
reproducibility of ultrasound and the fact that
information given by mammography could be found
on DECEDM (in addition to tumor vascularization),
we choose to apply our detection and diagnosis
system to two modalities: breast MRI and DECEDM.
In this paper we will focus on results obtained from
MRIs.
3 SEGMENTATION AND
FEATURE EXTRACTION
Segmentation is a very important stage in breast
cancer diagnostic process. It consists of extracting the
pathological area in the image. A good segmentation
generates an accurate description of the
characteristics of breast pathology. Currently, there
are several image processing methods for the
segmentation of breast lesions, someone’s allow both
detection and segmentation. Liney et al. (Liney,
2006) used region growing algorithm for the
segmentation of breast MRI. Wang et al. (Wang,
2014) applied region growing algorithm to segment
masses in breast MRI detected from a color map.
Although region growing was recommended and
frequently used for image segmentation, it has a
serious limitation. In fact, the growth phase requires
ICPRAM 2016 - International Conference on Pattern Recognition Applications and Methods
352
a criterion of homogeneity. If the seeds are located in
a non-homogeneous area, which is the case with
malignant lesions, the similarity measure will
generate variations which cause the interruption of
the growth process. At first, Chen et al. (Chen, 2004)
also recommended the use of region growing for
segmentation of mammary masses, but then they
offered another method of segmentation based on
fuzzy C-means clustering (FCM) algorithm and
confirmed that the FCM algorithm outperforms the
region growing algorithm (Chen, 2006). However,
conventional FCM clustering does not integrate
information about spatial context which makes it
sensitive to noise and imaging artifacts. Conventional
smoothing filters can be used to compensate this
drawback but they can cause a loss of important
image details, especially image boundaries. Some
approaches (Zhang, 2003), (Li, 2003) proposed to
increase the robustness of FCM to noise but they
show considerable computational complexity. Li et
al. (Li, 2008) propose an active contour based region
model, called the level set method, to segment images
with inhomogeneous intensities or objects with
hidden or undefined contour. Since its first
application for segmentation based contour in early
90s, level set method becomes increasingly popular
for image segmentation. Specially, the level set based
region allows to partition the image into coherent
color, texture and dynamic texture areas. A
comparative study between the snake method and the
level set method led by Winzenrieth et al.
(Winzenrieth, 2003) on hip MRI, proves that the level
sets is most appropriate since it is the more
reproducible, more accurate and require less manual
intervention. To deal with image intensity
inhomogeneity, Li et al. (Li, 2011) proposed a novel
level set region-based method for image
segmentation by deriving a local intensity clustering
property from a model of images with intensity
inhomogeneities and defining a local clustering
criterion function for the intensities in a neighborhood
of each point. Li et al. used their model for
segmentation and bias correction of magnetic
resonance images (MRIs) with promising results.
According to this study, previous results and our
case of study, we choose the level set method to
segment breast mass.
3.1 Level Set Method
The level set method is a generic numerical method
for evolving fronts in an implicit form. The image
segmentation problem can be formulated and solved
with the level set method principally based on well-
established mathematical theories, including calculus
of variations and partial differential equations (PDE).
Consider a curve/interface Γ in movement in a
region Ω. Γ is the zero level of a function φ of higher
dimension usually called a level set function. The
interface in movement at point x at the instant t is
defined as:
Γ
(
t
)
=
(,)
|
φ
(
x,t
)
=0
(1)
With φ is positive inside Ω, negative outside, and
null on Γ. Items of this interface will move towards
normal (gradient φ) with a speed according to the
following equation:
+.∇φ=0
(2)
In fact, only the normal component of v
account
=.
∇
|
∇
|
, With |∇φ| is the euclidean
norm, thus equation (1) becomes:
+
.
|
∇φ
|
=0
(3)
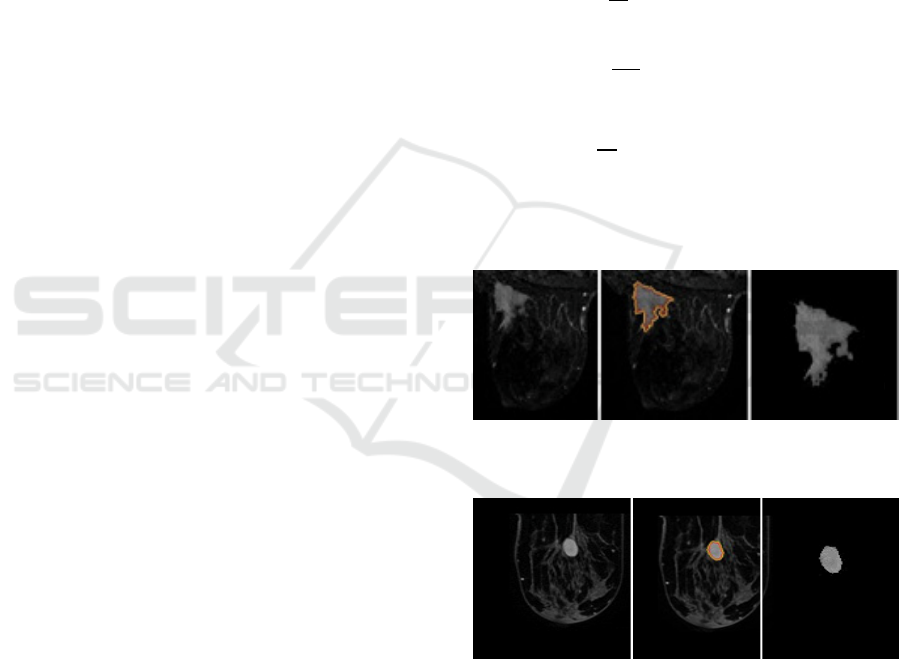
The results of segmentation were validated by two
radiologists. Two examples of both malignant and
benign lesions are shown in the following figures.
Figure 1: Original MRI, segmented malignant lesion and
lesion extracted respectively from left to right.
Figure 2: Original MRI, segmented benign lesion and lesion
extracted respectively from left to right.
3.2 Feature Extraction
Three kinds of characteristics could be extracted from
the segmented tumors (from MRI and DECEDM):
textures features, shape characteristics and kinetic
features. In this paper, 20 GLCM features and 4 shape
features are extracted and defined as follows.
Choquet Integral based Feature Selection for Early Breast Cancer Diagnosis from MRIs
353

3.2.1 Texture Features
Texture is the result of local variations in brightness
within one small area of an image. A set of Gray
Level Co-occurrence Matrix (GLCM) features, such
as Haralick’s features (Haralick, 1973) (energy,
entropy, correlation, inverse difference moment,
inertia, cluster shade, cluster prominence, etc.) and
other texture characteristics (dissimilarity, maximum
probability, autocorrelation, inverse difference
normalized INN, inverse difference moment
normalized IDN) (Clausi, 2002), (Soh, 1999) are
extracted from the co-occurrence matrix. GLCM
represents how different combinations of pixel
brightness values occur in an image, it depicts the
joint frequencies of all pairwise combinations of gray
levels i and j separated by a distance along a direction
θ (Karthikeyan, 2014). The GLCM is normalized by
the sum of all its elements to calculate the co-
occurrence relative frequency between gray level i
and j. Each entry in GLCM matrix is considered to be
the probability that a pixel with value i will be found
adjacent to a pixel of value j as defined below
(Albregtsen, 2008):
(
1,1
)
(
1,2
)
…
(
1,
)
(
2,1
)
(
2,2
)
…
(
2,
)
…
(
,1
)
(
,2
)
…(,)
3.2.2 Shape Features
A round mass with smooth and well-defined contour
tends to be benign, whereas an irregular or speculated
mass with undefined border tends to be malignant.
Various shape descriptors exist in the literature, and
they are categorized into two groups: contour-based
shape descriptors (Fourier descriptor, wavelet
descriptors, shape signatures, etc.) and region-based
shape descriptors (geometric moments, Zernike
moments, etc.). Four categories of shape descriptors
including compactness, signature, Zernike moments
and GFD were used to diagnose the lesions.
Compactness
Compactness is defined as the ratio of the square of
surface area to the total volume of the lesion. It is used
to quantify the connectedness of the portions in a
lesion. A highly none convex lesion (malignant
lesion) will have a high compactness index, however
benign lesions have a low compactness values (Nie,
2008). Mathematical expression of compactness is as
follows:
compactness=
4π.area
perimeter
(4)
Shape Signature
The shape signature is expressed by the distance of
boundary points from the centroid (xc,yc) of the
shape.
r
(
k
)
=
(
x
(
k
)
−x
)
+
(
y
(
k
)
−
y
)
(5)
Where x(n) and y(n) are the coordinates of the
pixels that make the shape boundary, andx
=
∑
x(k)
, y
=
∑
y(k)
.
The signature is normalized by the maximum
distance between the centroid and the k boundary
points to be invariant to rotation and scale,
(
)
=
()
()
.
Zernike moments
Zernike moments have been utilized as object
descriptors in several pattern recognition problems
(Hwang, 2006), in edge detection (Li, 2010) and
image retrieval applications (Li, 2009) with
significant results. The Zernike moments are a set of
descriptors obtained using complex kernel functions
based on Zernike polynomials orthogonal to each
other which helps to represent the properties of an
image with no redundancy or overlap of information
between the moments (Tahmasbi, 2011). Zernike
moments of order n with repetition m are defined as:
Z
=
f
(ρ,
θ
)
V
∗
(
ρ,
θ
)
ρdρd
θ
(6)
Where f(x,y) represents the mass shape and V
∗
is
the complex conjugate of function V. defined as:
V
,
(
ρ,θ
)
=R
(
ρ
)
e
,
|
ρ
|
≤1,j=
√
−1,
where R
(
ρ
)
=
∑
c(n,m,s)ρ
(||)/
and
c(n,m,s)=
(
)
!
!
(
|
|)
!
(
|
|)
!
, nand m are
respectively the order and the repetition.
To compute Zernike moments from a digital
image, the integral should be replaced by summations
and the coordinates of the image must be normalized
into [0, 1] by a mapping transform. The discrete form
of the Zernike moments of an image size N × N is
expressed as follows:
Z
=
n+1
λ
f
(
x,
y
)
R
ρ
e
(7)
Where0≤
≤1, and
is a normalization
factor.The transformed distance
and the phase
ICPRAM 2016 - International Conference on Pattern Recognition Applications and Methods
354

at the pixel of (x, y) are given by:ρ
=
()
()
, θ
=tan
.
Generic Fourier Descriptors
The GFD is extracted from spectral domain by
applying 2-D Fourier transform on polar raster
sampled shape image. It has no redundant features
and allows multi-resolution feature analysis in both
radial and angular directions (Zhang, 2002).
The GFD are based on the Polar Fourier defined
as:
F
(
ρ,
θ
)
=
∑∑
I
(
x,
y
)
e
(,)
(,)
(8)
Where r(x,y) and v(x,y) are respectively the radius
and angle of the polar coordinates of the point (x,y), I
is the intensity function and the parameters ρ and θ
are bounded: 0≤ρ<R and 0≤θ<T, with R and T
respectively the radial and the angular resolutions.
Finally, the GFD is written:
GFD
(
m,n
)
=
|
(,)
|
,
|
(,)
|
|
(,)
|
…
|
(,)
|
|
(,)
|
(9)
Where m and n are the radial and angular
frequencies and
is the 1
st
order moment.
3.2.3 Kinetic Features
Kinetic features are extracted from the Time Intensity
Curve (TIC) of the segmented lesion. As we have
mentioned previously, time intensity curve allows to
divide lesions into malignant and benign according to
their time to peak, an initial rise of signal intensity
within 90 seconds >90% is defined as rapid
enhancement, which is highly suggestive of
malignancy. Four kinetic features could be extracted
from the Characteristic Kinetic Curve CKC
(Maximum enhancement, Time to peak, Uptake rate
and Washout rate) (Chen, 2006).
4 FEATURE SELECTION AND
CLASSIFICATION
4.1 Context of the Study
Pattern recognition methods are generally built
independently. Their combination may lead to
positive correlations, because they aim at achieving
the same goal and are based on the same learning
data. Many classifier combination systems have been
proposed and compared in the literature, and a full
presentation of most of these can be found in a
reference book by Duda et al. (Duda, 2012).
Over the years many aggregation operators have
been introduced. For most of these operators, the
relative importance of a criterion, associated here to a
feature, is represented in the final decision by a
weight assigned to it. By assigning a weight not only
to each participant of the aggregation, but also to each
subset of participants, the operators based on the
Choquet integral are able to capture this synergy in
the associated Fuzzy measure (or capacity). Choquet
integral allows to consider effectively the interactions
between decision rules while providing a model of
robust decision in the presence of little training data
that can be even very inconsistent (Grabisch, 1996).
4.2 Choquet Integral
Let us consider m classes C
1
… C
m
and n decision
rules (DRs) X = {D
1
… Dn}. As in Wendling and al.,
(Wendling, 2008) a decision rule (i.e criterion) is
assumed to be a feature with associated metric. To
classify a new pattern x, we need firstly for each
decision rule j and each class i, to compute a
confidence degree Φ
. Then we combine all these
partial confidence degrees into a global confidence
degree given by Φ
(
|
)
=Η(Φ
,…,Φ
). Finally, x
is assigned to the class for which the confidence
degree is the highest.
Calculating Choquet integral requires the
definition of a capacity or a fuzzy measure. Let us
denote P as the power set of X, i.e the set of all subsets
of X. Capacity or a fuzzy measure on X, is a function
μ: P(X) → [0, 1] which verifies : μ(∅) = 0, μ(X) = 1
and μ(A)≤ μ(B) if A ⊆ B (monotony).
The Choquet Integral of ϕ
= [ϕ
... ϕ
]
t
noted
C
μ
(ϕ
), is defined as :
C
ϕ
=ϕ
()
μA
(
)
−μA
(
)
(10)
Where
(
)
=
(
)
,…()
represents [j…n]
associated criteria in increasing order and A(n+1)=∅.
For a thorough description of the Choquet
integral, the reader may refer to (Grabisch, 1996).
4.3 Learning Step
The calculation of the Choquet integral requires the
assessment of any set of P(X). The main problem is
giving a value to the sets that have more than three
elements while keeping the monotonic property of the
integral. Generally the problem is translated to
another minimization problem, which is usually
Choquet Integral based Feature Selection for Early Breast Cancer Diagnosis from MRIs
355

solved using the Lemke method. M. Grabisch
(Grabisch, 1996) has shown that such an approach
may be inconsistent when using a small number of
samples and has proposed an optimal approach based
on a gradient algorithm. In the approach it is assumed
that in the absence of any information, the most
reasonable way of aggregation is the arithmetic mean.
This algorithm tries to minimize the mean square
error between the values of the Choquet integral and
the expected values.
4.4 Extraction Step
Once the fuzzy measure is learned, it is possible to
interpret the contribution of each decision criterion in
the final decision. We adapt here the strategy
proposed in (Mazaud, 2007) to our breast cancer
diagnosis problem. Several indices can be extracted
from the fuzzy measure, helping to analyze the
behavior of decision criteria. The importance of each
criterion is based on the definition proposed by
Shapley in the game theory (Shapley, 1953). Let us
consider a fuzzy measure μ and a decision criterion
D
i
:
(
,
)
=
1
1
(
∪
)
⊆\
−
(
)
(11)
A decision criterion with an importance index
value less that 1/n can be interpreted as having a low
impact in the final decision. Otherwise an importance
index greater than 1/n describes an attribute more
important than the average. The interaction index,
also called the Murofushi and Soneda index
(Murofushi, 1991), (Murofushi, 1993) represents the
positive or negative degree of interaction between
two decision criteria. If the fuzzy measure is non-
additive, then some criteria interact. The marginal
interaction between D
i
and D
j
, conditioned to the
presence of elements of combination T ⊆ X\D
i
D
j
is
given by:
(∆
)
(
)
=∪
+
(
)
−
(
−
)
−−
(12)
After averaging it over all the subsets of T ⊆
X\D
i
D
j
the assessment of the interaction index of D
i
and D
j
, is defined by:
,
=
(
−−2
)
!!
(
−1
)
!
(∆
)()
⊆\
(13)
We propose to sort the decision criteria with
increasing order, by considering the values they
reach, using a linear combination of importance and
interaction indexes
.
Let us first consider the global impact of
interactions of order 2, or the normalization factor K,
as follows:
=2× |,
|
,,
(14)
If K is close to 0 (K≈0), then no (or few)
interactions exist between the decision criteria, as
they are independent. The Choquet integral relies on
a weighted sum and the impact of each decision
criterion can be directly assessed by taking its
Shapley values:
(
,
)
.
Otherwise, the assessment is performed using the
importance and interaction indices. It is calculated by
integrating the interaction impact of D
i
relatively to
the minimum of global interaction reached by one
decision criterion, noted M, as follows:
=×(
)×
∑
(
,
)−
/
(15)
=
∑
(
)
,
,
(16)
The decision criterion having the least influence
on the final decision, and interacting the least with the
other criteria is assumed to blur the final decision.
5 EXPERIMENTAL RESULTS
AND DISCUSSION
5.1 Database
A breast MRI database, whose examinations date
from 2014 and 2015, is used in this study. The images
are provided by the hospital Georges Pompidou
radiology department. An expert radiologist
identified the corresponding physical lesions based
on visual criterion and biopsy-proven reports. The
MRI database consists of 58 mass lesion in 40
patients of which 14 lesions are benign and 44 lesions
are malignant. Know that, by virtue of having MRI
performed as part of the clinical exam, these lesions
could be assumed to be difficult to interpret. The
segmentation of breast images was validated by two
experts.
ICPRAM 2016 - International Conference on Pattern Recognition Applications and Methods
356

5.2 Results
It is important to note that only subset of features
among the set of features presented before are
relevant despite they were usually used in the
literature. Most of them are based on same
mathematical process and are redundant and blurred
the results. The aim of the approach is to
automatically extract a subset of pertinent features
adapted to the studied application. Each feature is
assumed to be a decision rule. That is descriptor and
associated metric to be consistent with the proposed
methodology. Leave-one-out is performed as few
data are processed and to provided non-biased results.
For a lack of clarity we will study the subset of nine
remaining features providing a score of 100% after
selecting step (that is Energy, Entropy, Homogeneity,
Correlation, Contrast, Cluster Prominence, Cluster
Shade, Compactness, and Zernike moments). The
analyze of Choquet lattice allows to attribute to each
feature a score based on its importance index
(Shapley index) and its global interaction impact. At
each epoch the weakest feature is removed and the
new rate of correct classification is calculated.
The following table shows the variation of correct
classification rates (CCR) by running several
methods.
Table 1: Correct classification rates (CCR) obtained on
subsets of features using well-known classifiers.
Methods
/Removed
feature
F
Kmeans Knn ANN SVM Choquet
-
Energy
Entropy
ClusterP
ClusterS
Homog
Contrast
Zernike
9
8
7
6
5
4
3
2
74
81
74
29
26
74
79
21
90
90
90
90
86
84
92
92
76
76
81
59
74
72
71
76
87
84
84
79
79
81
79
79
100
95
96
94
92
92
93
89
F= number of used features. Kmeans = K-means clustering.
Knn = k-nearest neighbor. ANN = artificial neural network.
SVM= support vector machine. Choquet = Choquet
integral. ClusterP = cluster prominence. ClusterS = cluster
shade. Homog = homogeinity.
Kmeans and SVM classifiers have a better correct
classification rate CCR (81% and 84% respectively)
with 8 features by removing energy, Knn gives a
better recognition rate (92%) with only 3 features
kept (Zernike, compactness and correlation). Knn,
SVM and Choquet integral provide a better CCR
(81%, 84 and 96% respectively) with two removed
features, energy and entropy, but Choquet integral out
performs all the classification methods with 96% of
CCR. These results attest the good behavior of our
method based on Choquet integral. Furthermore the
importance of the feature can be assessed at each level
(Table 2) as well as their interaction (Table 3).
Table 2: An example of the assessment of the importance
of decision rules (Shapley) associated to a set of 7 features
(table 1).
Shapley F1 F2 F3 F4 F5 F6 F7
values
0.76
1.01 1.09
0.78 0.74
1.46 1.15
Table 3: An example of the assessment of the positive and
negative interactions between decision rules (second order)
associated to a set of 7 features (table 1). Obviously table is
symmetric.
Int. 2 F1 F2 F3 F4 F5 F6 F7
F1
--- -0.18 -0.11 0.08 0.31 0.26 0.64
F2
-0.18 --- -0.16 0.41 0.01 1.09 -0.34
F3
-0.11 -0.16 --- 0.00 0.42 -0.33 0.18
F4
0.08 0.41 0.00 --- 0.54 -0.12 0.74
F5
0.31 0.01 0.42 0.54 --- 0,02 0.70
F6
0.26 1.09 -0.33 -0.12 0.02 --- -0.93
F7
0.64 -0.34 0.18 0.74 0.70 -0.93 ---
6 CONCLUSIONS
In this study, we combined selected textural and
morphological features to improve the overall
performance of breast MRI in a computer-aided
system. We opted for Choquet integral, which
provides a robust model of decision in the presence of
little training data, to select the most pertinent
features. The results are very encouraging (CCR =
96%), despite using a small data set. Further works
are devoted to the extension of this model to process
with other subsets of features extracted from breast
MRI (kinetic features, risk factor, etc.) and from
DECEDM and to merge a set of features in order to
reach a better tumor recognition and classification
which lead to a better decision. Such a generic system
can be useful for other type of dataset for cancer
recognition.
Choquet Integral based Feature Selection for Early Breast Cancer Diagnosis from MRIs
357

REFERENCES
Albregtsen, F., 2008. Statistical Texture Measures
Computed from Gray Level Co-occurrence Matrices.
Image Processing Laboratory Department of
Informatics University of Oslo.
Chen, W., Giger, ML., Bick, U., 2006. A Fuzzy C-Means
(FCM)-Based Approach for Computerized
Segmentation of Breast Lesions in Dynamic Contrast-
Enhanced MR Images. Academic Radiology. Volume
13, issue 1, pages 63–72.
Chen, W., Giger, ML., Bick, U., 2006. Automatic
identification and classification of characteristic kinetic
curves of breast lesions on DCE-MRI. Med Phys. 33(8),
pages 2878-87.
Chen, W., Giger, ML., Lan, L., et al., 2004. Computerized
interpretation of breast MRI: investigation of
enhancement-variance dynamics. Med Phys. Volume
31, pages 1076–1082.
Clausi, DA., 2002. An analysis of co-occurrence texture
statistics as a function of grey level quantization. Can.
J. Remote Sensing. Volume 28, issue 1, pages 45–62.
Duda, RO., Hart, PE., Stork, DG., 2012. Pattern
classification. John Wiley & Sons.
Grabisch, M., 1996. The application of fuzzy integrals in
multicriteria decision making. Eur. J. Oper. Res.
Volume 89, issue 3, pages 445–456.
Haralick, RM., Shanmuga, K., Dinstein, I., 1973. Textural
features for image classification. IEEE Trans Syst Man
Cybern; Smc3 (6):610–21.
Hwang, S.K., Kim, W.Y., 2006. A novel approach to the
fast computation of Zernike moments. Pattern
Recognition. Volume 39 pages 2065–2076.
Karthikeyan, S., Rengarajan, N., 2014. Performance
analysis of gray level co-occurrence matrix texture
features for glaucoma diagnosis. American Journal of
Applied Sciences. Volume 11, pages 248-257.
Li, C., Kao, CY., Gore, JC., Ding, Z., 2008. Minimization
of region-scalable fitting energy for image
segmentation. IEEE Transactions on Image
Processing. Volume 17, issue 10, pages 1940-1949.
Li, C., Huang, R., Ding, Z., Gatenby, JC., Metaxas, DN.,
Gore, JC., 2011. A level set method for image
segmentation in the presence of intensity
inhomogeneities with application to MRI. IEEE
Transactions on image processing. Volume 20, issue 7.
Li, Sh., Lee, MCh, Pun, Ch.M., 2009. Complex Zernike
moments features for shape based image retrieval.
IEEE Transactions on Systems, Man and Cybernetics,
Part A: Systems and Humans 1. Volume 39, pages 227–
237.
Li, X., Li, L., Lu, H., Chen, D., Liang, Z., 2003.
Inhomogeneity Correction for Magnetic Resonance
Images with Fuzzy C-Mean Algorithm. Proc. SPIE Int.
Soc. Opt. Eng., Volume 5032, pages 995–1005.
Li, X., Song, A., 2010. A new edge detection method using
Gaussian–Zernike moment operator. Proceedings of
the IEEE, 2nd International Asia Conference on
Informatics in Control, Automation and Robotics,
pages 276–279.
Liney, GP., Sreenvias, M., Garcia-Alvarez, R., et al., 2006.
Breast lesion analysis of shape technique: semi-
automated vs. manual morphological description. J
Magnetic Resonance Imaging. Volume 23, pages 493–
498.
Mazaud C., Rendek J., Bombardier V., Wendling L., "A
feature selection method based on Choquet Integral and
Typicality Analysis", IEEE International Conference
on Fuzzy Systems, London (UK), 6p, 2007.
Murofushi, T., Sugeno, M., 1991. A theory of fuzzy
measures: Representations, the Choquet integral, and
null sets. J. Math. Anal. Appl. Volume 159, issue 2,
pages 532–549.
Murofushi, T., Soneda, S., 1993. Techniques for reading
fuzzy measures (iii): Interaction index. Proc. 9th Fuzzy
Syst. Symp., Sapporo, Japan. Pages 693–696.
Nie, K., 2008. Quantitative Analysis of Lesion Morphology
and Texture Features for Diagnostic Prediction in
Breast MRI. Academic Radiology, volume 15, issue 12,
pages 1513–1525.
Shapley, L., 1953. A value for n-person games. In
Contributions to the Theory of Games, Annals of
Mathematics Studies, H. Khun and A. Tucker, Eds.
Princeton, NJ: Princeton Univ. Press, pages 307–317.
Soh, LK., Tsatsoulis, C., 1999. Texture analysis of SAR sea
ice imagery using gray level co-occurrence matrices.
IEEE Transactions on Geoscience and Remote Sensing.
Volume 37, issue 2, pages 780–795.
Tahmasbi, A., 2011. Classification of benign and malignant
masses based on Zernike moments. Computers in
Biology and Medicine. Volume 41, pages 726–735.
Wang, TC., Huang, YH., Huang, CS., Chen, JH., Huang,
GY., Chang, YC., Chang, RF., 2014. Computer-aided
diagnosis of breast DCE-MRI using pharmacokinetic
model and 3-D morphology analysis. Magnetic
Resonance Imaging. Volume 32, pages 197-205.
Wendling L., Rendek J., Matsakis P., 2008. Selection of
suitable set of decision rules using Choquet integral,
Statistic Pattern Recognition, S+SSPR'08, pp10.
Winzenrieth, R., Claude, I., Hobatho, MC., Pouletaut, P.,
Sebag, G., 2003. Comparaison de deux méthodes de
segmentation par contours actifs : les snakes et les level
sets pour la segmentation d’IRM de hanche.
Zhang, D., Lu, G., 2002. Generic Fourier descriptor for
shape-based image retrieval. Multimedia and Expo,
ICME '02. Proceedings. IEEE International
Conference. Volume1, pages 425-428.
Zhang, DQ., Chen, S., Pan, ZS., Tan, KR., 2003. Kernel
based fuzzy clustering incorporating spatial constraints
for image segmentation. IEEE International conference
on Machine Learning and Cybernetics. Volume 4,
pages 2189-2192.
ICPRAM 2016 - International Conference on Pattern Recognition Applications and Methods
358
