
Matching CAD Model and Image Features for Robot Navigation and
Inspection of an Aircraft
Igor Jovan
ˇ
cevi
´
c
1
, Ilisio Viana
1
, Jean-Jos
´
e Orteu
1
, Thierry Sentenac
1,2,3
and Stanislas Larnier
2,3
1
Universit
´
e de Toulouse, CNRS, INSA, UPS, Mines Albi, ISAE, ICA, Campus Jarlard, F-81013 Albi, France
2
CNRS, LAAS, 7 Avenue du Colonel Roche, F-31400 Toulouse, France
3
Universit
´
e de Toulouse, UPS, LAAS, F-31400 Toulouse, France
Keywords:
Computer-aided-inspection, Image Analysis, Feature Matching, PTZ Camera, Hough Transform, EDCircle.
Abstract:
This paper focuses on the navigation of a moving robot equipped with cameras, moving around an aircraft to
perform inspection of different types of items (probes, doors, etc.). Matching CAD model and image features
is useful to provide meaningful features for localization and inspection tasks. In our approach two primitive
sets are matched using a similarity function. The similarity scores are injected in the edges of a bipartite
graph. A best-match search procedure in bipartite graph guarantees the uniqueness of the match solution. The
method provides good matching results even when the location of the robot with respect to the aircraft is badly
estimated. Inspection approaches on static ports and air inlet vent are presented.
1 INTRODUCTION
Airplanes are periodically inspected, either on the air-
port tarmac between flights or in a hangar during
maintenance operations. Today, these inspections are
done by human operators, mainly visually and some-
times with some inspection tools. In order to make
the inspection quicker, more exhaustive and more ac-
curate, as well as for traceability reasons, a multi-
partners research project is being carried on to de-
velop a mobile robot equipped with several sensors
(cameras and 3D scanners) to perform an automatic
inspection of an airplane. The chosen approach is
based on an autonomous mobile robot on the ground,
capable to communicate with human operators and in-
frastructures around the aircraft. In addition to the
long range navigation task, at each checkpoint, the
robot performs an inspection task of several items
(probes, doors, etc.).
Robotic airplane inspection from the ground,
based on computer vision, is a specific application not
enough studied. Previous efforts (Siegel et al., 1998;
Mumtaz et al., 2012) were mainly focused on detailed
airplane skin inspection with robot crawling on the
airplane surface. In most cases, industrial automation
systems (Malamas et al., 2003) are used to inspect
known objects at fixed positions with appropriate illu-
mination necessary to extract meaningful features. In
our application, sensors are mounted on the moving
robot and no additional illumination is used. More-
over, our intention is to enable robot to cover as many
items as possible from one position, i.e. to move as
less as possible.
Firstly, navigation algorithms lead the robot to a
checking position which is localized in the aircraft
model. Secondly, automated image acquisition is
provided by controlling Pan-Tilt-Zoom (PTZ) camera
and pointing it towards the item to be inspected. In-
spection is performed by processing the images. For
each item, integrity or right configuration should be
verified. To perform more accurately, it is required to
obtain a zoomed view of the element to be inspected.
Therefore, the essential step is detection of the region
of interest (ROI) in an image. Detection of items on
the aircraft surface is an important step for navigation
tasks as well. Advantage in the present context is that
the airplane 3D model with the items to be detected is
known (Fig. 1). Therefore, it is possible to project it
onto the image plane to obtain the expected shape and
position of desired items.
Since the shapes on the airplane surface are reg-
ular geometrical shapes such as circles, ellipses or
rounded corners rectangles, our detection approaches
are relying on geometric feature extraction tech-
niques. Extracted primitives are ellipses and straight
line segments. After extraction, each primitive is as-
sociated with an item or part of an item. Our approach
proposes a score for similarity between the projec-
Jovan
ˇ
cevi
´
c, I., Viana, I., Orteu, J-J., Sentenac, T. and Larnier, S.
Matching CAD Model and Image Features for Robot Navigation and Inspection of an Aircraft.
DOI: 10.5220/0005756303590366
In Proceedings of the 5th International Conference on Pattern Recognition Applications and Methods (ICPRAM 2016), pages 359-366
ISBN: 978-989-758-173-1
Copyright
c
2016 by SCITEPRESS – Science and Technology Publications, Lda. All rights reserved
359
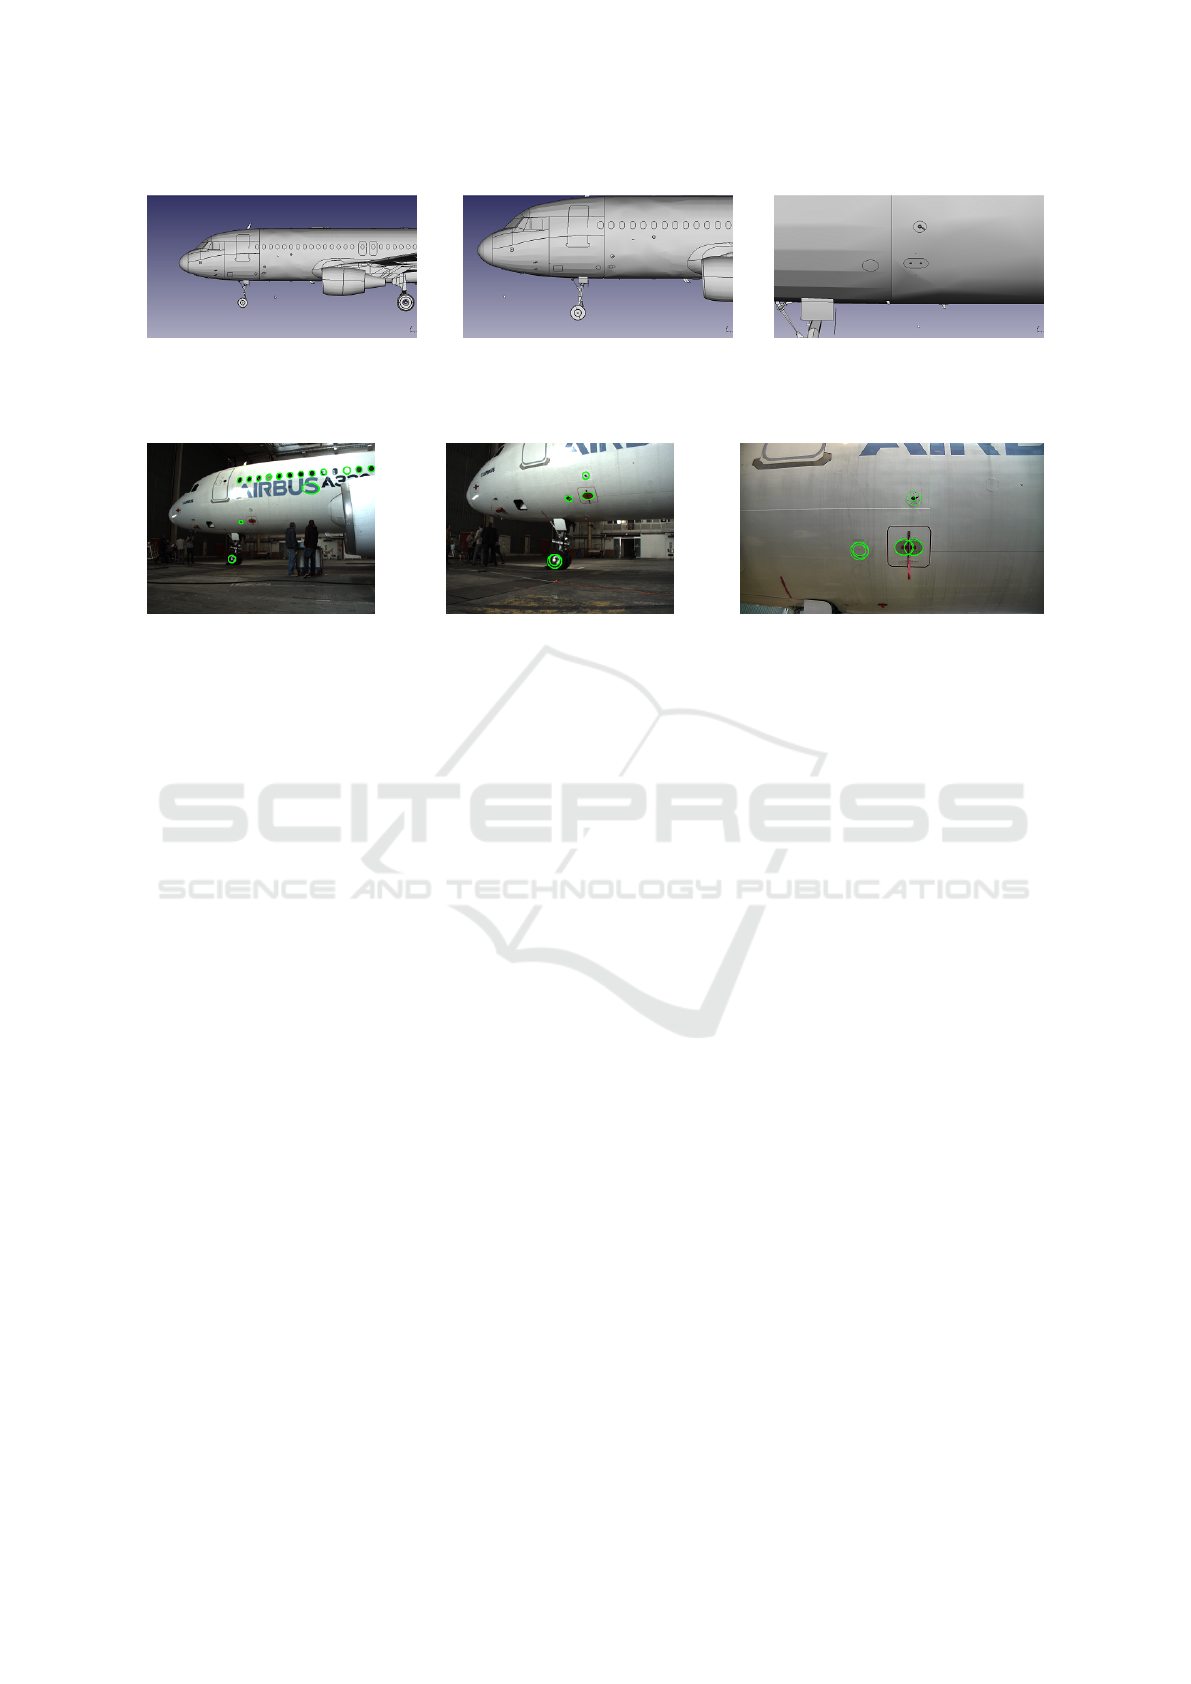
(a) Aircraft model with a far away
view.
(b) Aircraft model near the checking
position.
(c) Aircraft model view from the
checking position.
Figure 1: Screenshots of the 3D aircraft model.
(a) Navigation far from the air-
craft.
(b) Navigation near the aircraft. (c) Inpection of the static port element.
Figure 2: Aircraft views taken by the mobile robot for navigation and inspection. Ellipse feature extraction with EDCircle.
tions and the primitives detected in the real image.
Navigation algorithms around the aircraft rely
firstly on visual servoing (Chaumette and Hutchin-
son, 2006). To perform visual servoing between
checkpoints around an aircraft, the navigation algo-
rithm needs features associated with aircraft visual
elements (windows, tires, trapdoors, company logo,
etc.). Since the aircraft inspection has to be performed
inside or outside, at any time of the day and with dif-
ferent weather conditions, the detection part has to
work even with low contrast images.
Different tracking methods are currently used
such as low contrast, blob, motion edges, template.
The low contrast tracker is a succession of low con-
trast detections. The search zone takes into account
the previous location of the target and the robot move-
ments. The other methods come from the ViSP library
(Marchand and Chaumette, 2005). Our strategy is to
let the robot choose the best tracking method in func-
tion of the aircraft visual element and its status in the
scene. The selection of the best tracking method is
done by taking into account knowledge acquired from
experiments and detection results.
During navigation, robot can switch from vi-
sual servoing to obstacle avoidance (Futterlieb et al.,
2014). In this mode, the plane could dissapear from
the field of view and the robot location is updated only
with odometry. Then a new detection and matching
of the features is needed to restart the visual servoing
and correct the robot location. The visual servoing
algorithm leads the robot to a checking position.
Final step in the process is visual inspection and
making decision on the state of a particular item on
the aircraft. Usual weakness of an inspection system
is being specialized in inspecting one particular type
of object. In that sense, each of the items on the air-
plane could be an isolated, specific, inspection prob-
lem. Our intention is to design more general strate-
gies, applicable to a class of similar items by chang-
ing just parameters and geometry. For instance, there
are many doors and vents on the airplane which can
be closed or open. For more details about inspection,
reader is referred to (Jovan
ˇ
cevi
´
c et al., 2015).
Navigation cameras acquire color images at a res-
olution of 480 × 640 pixels. PTZ camera provides
color images at a resolution of 1080 × 1920 pix-
els. Acquisition images of the aircraft and associated
views of the 3D model are presented in Fig. 2 and 1
respectively. The three images present the distance
ranging from far away to a checking position of the
static port element. Fig. 2a is an image coming from
the navigation camera, taken when the mobile robot
is far away from the airplane. Fig. 2b is also an image
coming from the navigation camera, taken when the
mobile robot is near the airplane. Fig. 2c is an image
coming from the PTZ camera, taken when the mobile
robot stopped at the end of the visual servoing and it
should perform inspection.
Paper is organized as follows. Two used fea-
ture extraction algorithms are introduced in Sec. 2.
In Sec. 3 we explain the matching method between
features extracted from the computer-aided design
(CAD) model and the ones detected in the image. The
matching results for the image views from Fig. 2 are
ICPRAM 2016 - International Conference on Pattern Recognition Applications and Methods
360

given in Sec. 4. Two inspection methods relying on
clues such as uniformity of isolated image regions
and convexity of segmented shapes are presented in
Sec. 5.
2 FEATURE EXTRACTION
2.1 Ellipses Extraction
Akinlar and Topal have proposed a robust circle de-
tection method (Akinlar and Topal, 2013), named
EDCircles. The ellipses features in camera images
are obtained after postprocessing of EDCircles results
(Fig. 2). Since it is impossible to have an intersec-
tion of two circles on the airplane, intersected circles
are merged and an ellipse is fitted on them (Prasad
et al., 2013). Sometimes, there is multiple results on
the same location and they are also merged. See the
result of postprocessing in Fig. 4c, 5c and 7c.
Ellipse detector is employed in order to detect nu-
merous elliptical shapes on the airplane skin such as
Air inlet vent (Sec. 5.1).
2.2 Line Segments Extraction
For segments extraction, we are running the progres-
sive probabilistic Hough Transform (PPHT) (Matas
et al., 2000) implementation from OpenCV library.
This method provides set of continuous straight line
segments. It is possible to use other segment detec-
tors such as more recent LSD (von Gioi et al., 2010)
or EDLines (Akinlar and Topal, 2011).
Outputs of all these detectors demand sensitive
postprocessing step of filtering due to the large set of
detected segments (Fig. 3a). First, segments which
are aligned (approximately belong to one ray) are
identified and average ray is calculated. Then, this
set of aligned segments is projected onto the average
ray and the projections are divided into clusters of
overlapping (or nearby) segments. The segments of
each such cluster are finally merged into one segment
(Fig. 3b).
The resulting set of segments is traversed in or-
der to detect some items on the airplane skin. For
example, there is an interest to identify four segments
which make rectangular shape such as static port (Sec.
5.2).
(a) Set of segments ex-
tracted by the PPHT
method.
(b) Set of segments after
postprocessing step.
Figure 3: Line segments extraction.
3 MATCHING OF PRIMITIVES
3.1 Feature Matching using a Similarity
Function
Line segments matching has been a widely studied
topic since segments are used in numerous applica-
tions such as 3D reconstruction (Bay et al., 2005).
This is also the case for primitives like ellipses (Hutter
and Brewer, 2009).
3.1.1 Preliminaries
Given two sets of primitives X and Y , with X rep-
resenting primitives projected from the model and
Y representing primitives in the real image, we will
show how a match score s(X
k
,Y
m
) denoting the simi-
larity between X
k
∈ X and Y
m
∈ Y can be computed.
3.1.2 Basic Graph Theory Concepts
Given a graph G = (V, E), an edge e ∈ E which links
two nodes u ∈ V and v ∈ V is said to be incident to
the nodes u and v. A graph G = (V, E) is said to be
bipartite if V (G) can be partitioned into two disjoint
sets X and Y such that every edge e ∈ E joins a vertex
in X to a vertex in Y .
3.1.3 Similarity Function
Two types of primitives are considered: ellipses and
line segments. A line segment is associated with an
attribute vector composed of the segment mid-point,
the length and the orientation. An ellipse is described
by its center, orientation and area. We divide the at-
tribute vector in two classes (c = [c
1
, c
2
]). Attributes
such as area or length belong to the first group as we
can compute their ratio (Eq. 1). Computing the ra-
tio for attributes such as center coordinates or orien-
tation is, however, not meaningful. Therefore, these
attributes will be in class c
2
. For such attributes, the
similarity score is computed as a distance of the ab-
solute difference from the maximal accepted disparity
Matching CAD Model and Image Features for Robot Navigation and Inspection of an Aircraft
361

between the theoretical and the test primitive (Eq. 2).
Maximal accepted disparity is preset by taking into
account the distance between primitives in the model.
The match function was proposed by (McIntosh and
Mutch, 1988) for line matching. In case of line match-
ing, the metrics used are the ratio of segment lengths,
the absolute difference of the orientation and the eu-
clidean distance, conditioned in such a manner that
the score between two primitives is always ≤ 1. We
extended the concept in order to use it with ellipses
as well. In this case we use the area of the ellipses
instead of the length of the segment.
s
i
=
min(X
k
i
,Y
m
i
)
max(X
k
i
,Y
m
i
)
, i f i ∈ c
1
(1)
δ
i
− abs(X
k
i
−Y
m
i
)
δ
i
, i f i ∈ c
2
(2)
s(X
k
,Y
m
) =
∑
w
i
s
i
(3)
where X
k
stands for a primitive projected from the
CAD model, Y
m
is a primitive in the real image and
i denotes the i
th
attribute for a given primitive. δ
i
is
the maximal accepted disparity for the i
th
attribute in
the class c
2
. The scalar s
i
is the match score between
one theoretical primitive and one test primitive for
the i
th
attribute. Finally, s(X
k
,Y
m
) denotes the match
score between X
k
with Y
m
. As some attributes may be
more relevant than others (Jr. et al., 2005), a priority
weighting function may be suitable (w
i
).
The matching is accomplished by exploring the
entire sets of theoretical and real primitives. A match-
ing matrix containing all the scores (Eq. 3) between
primitives in the set X with primitives in Y is com-
puted (Table 1) then used to construct the bipartite
graph.
Table 1: Matching matrix for the case in Fig. 4.
Test
1 2 3 4
Model
1 -0.407 0.204 -0.424 -0.18
2 -1.147 0.446 0.461 0.193
3 -0.565 0.120 -0.113 0.548
The similarity function is conditioned to be in the
range [0, 1] when i ∈ c
1
. When i ∈ c
2
the score may
be < 0. In our application only candidates having a
match score in the range [0, 1] are considered.
3.2 Search of Mutual Best Match in a
Bipartite Graph
Bipartite graph matching has been widely studied and
has applications in various fields of science (Panda
and Pradhan, 2013), (Fishkel et al., 2006). It is partic-
ularly suitable for a two-class matching problem. For
more details on how this concept is used in our work,
reader is referred to (Viana et al., 2015).
First we keep M occurrences of a score in the
matching matrix meeting a predefined threshold. A
bipartite graph containing M edges is then created.
This graph holds two types of nodes (X, Y ), repre-
senting theoretical and real primitives respectively. A
X-type node in the bipartite graph is linked with a
Y -type node when their similarity score satisfies the
threshold condition. The edge linking these two nodes
is weighted with their similarity score (Eq. 3). De-
pending on the threshold value, one X-type node may
be connected to more than one Y -type node and re-
versely.
Further, best matches are found for all the X-
nodes. Let X
k
be a X-node. We search the edge in-
cident to X
k
, holding the maximal weight. At the end
of this stage, if in the best match list there is more than
one X-node matched to the same Y -node, we proceed
to the second stage. Otherwise, we reached one-to-
one correspondences for all CAD primitives, so the
matching is done. In the second stage, we are search-
ing for best match for each Y -node which was previ-
ously matched with more than one X-node. In these
cases, we are keeping only the mutual best match.
Other edges incident to Y -node are eliminated. There-
fore, some of the X-nodes might stay unmatched. Fig.
6 shows all the possible edges between nodes of two
classes (grey) and the best match for each of the X-
nodes (blue). We have a conflict because Y -node 2 is
chosen as a best match for two X-nodes 12 and 13.
After computing the best match for the Y-node 2, we
are keeping the edge 2 − 13 and eliminating the edge
2 − 12. Final matching result is presented in 5b.
The mutual best match search guarantees the
uniqueness constraint of the matching, i.e. each CAD
primitive is matched to a different real primitive, or it
is not matched at all.
4 MATCHING RESULTS
In this section the matching results are presented.
Fig. 5, 4 and 7 concern ellipse matching. Fig. 8 con-
cerns segments matching. For all, the model features
are in cyan and the image ones are in red. In the graph,
model features are presented as green circles and im-
age ones as yellow circles. From a starting position,
the robot has to detect the airplane then go to a check-
ing area where it can inspect the air inlet vent and the
static port (ellipse features 1 and 2 in Fig. 7c).
In Fig. 5, the robot is at its starting position. The
ICPRAM 2016 - International Conference on Pattern Recognition Applications and Methods
362
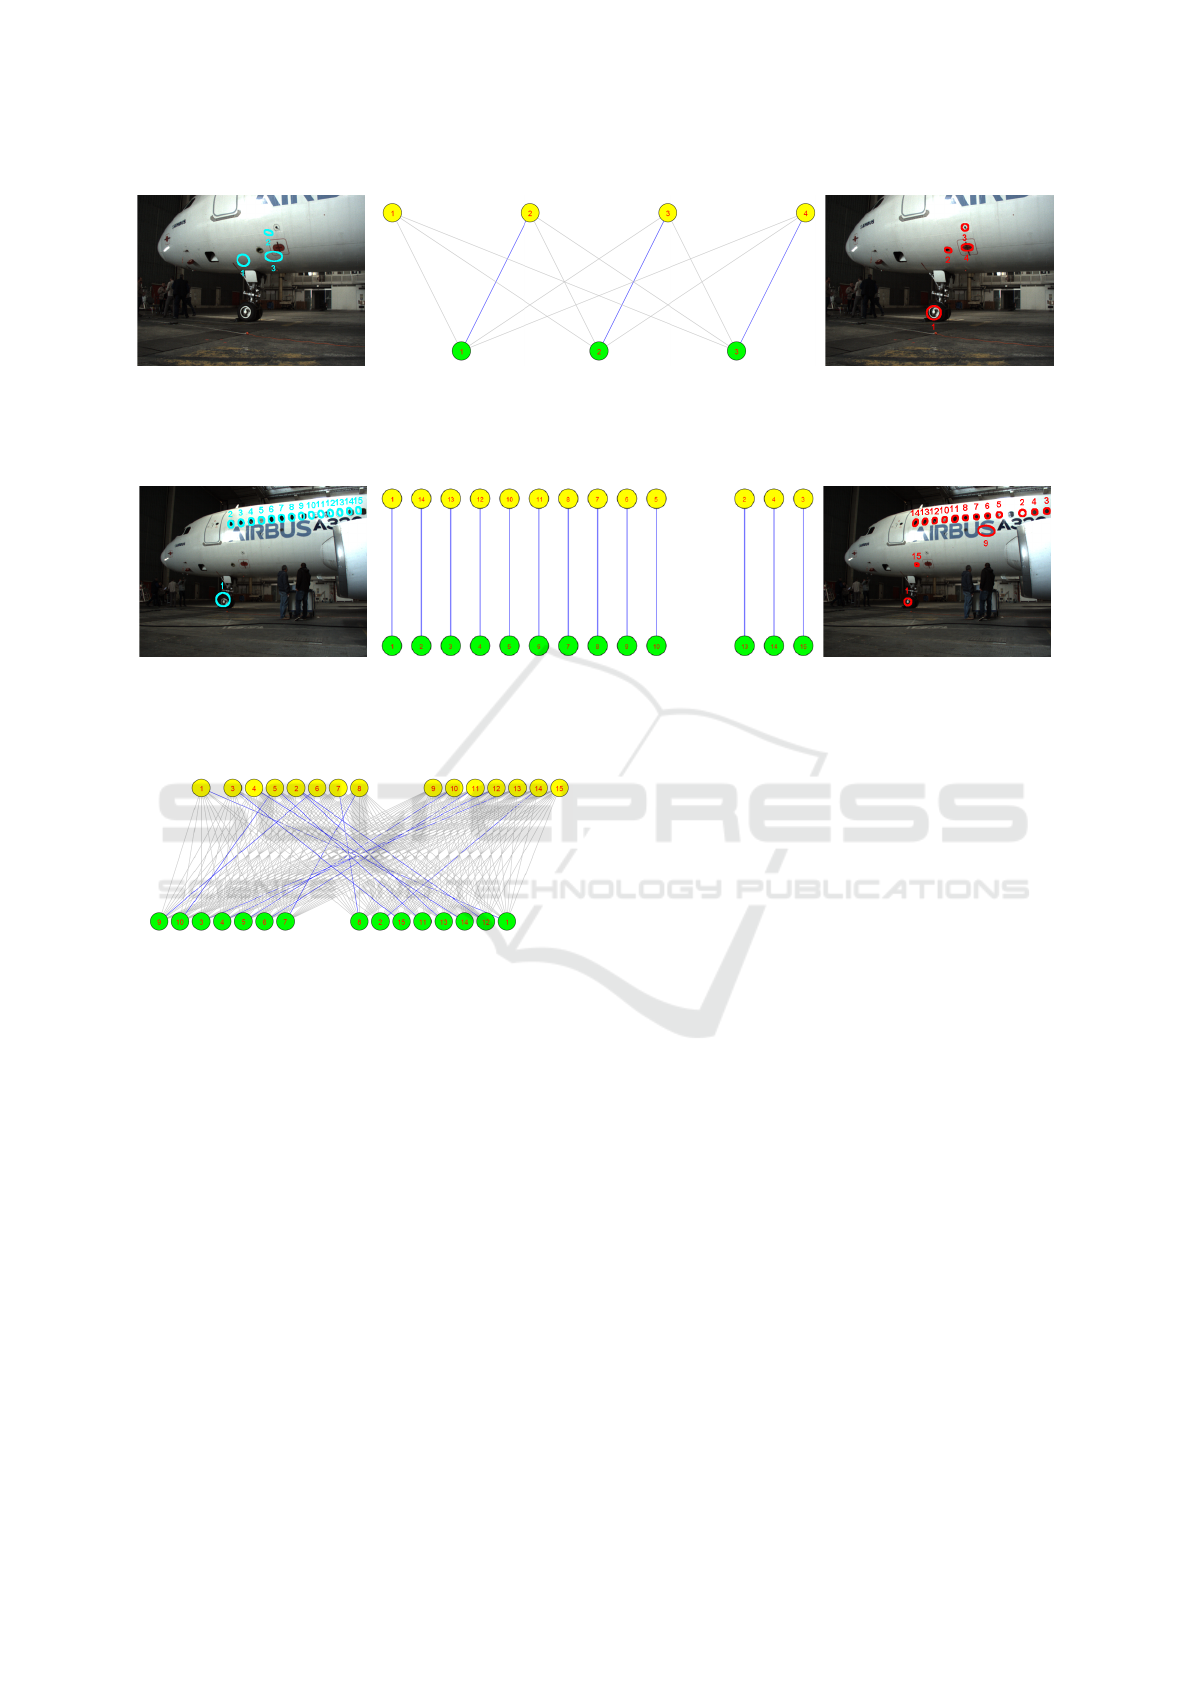
(a) Model features projected to
the sensed image.
(b) Bipartite graph with eliminated edges (grey) and matches
(blue).
(c) Ellipse detection in the
sensed image (EDCircles and
our postprocessing step).
Figure 4: Navigation near the aircraft.
(a) Model features projected to
the sensed image.
(b) Bipartite graph with matches (blue) (eliminated edges not
shown).
(c) Ellipse detection in the
sensed image (EDCircles and
our postprocessing step).
Figure 5: Navigation far from the aircraft.
Figure 6: Conflict matches.
aircraft location is roughly known from this position.
The CAD model projection is presented in Fig. 5a.
Only windows and front tire are projected. At this
distance, the other ellipse features of the airplane are
usually not detected. The projection is inaccurate for
the most right windows. The ellipse image features
are given in Fig. 5c. Some windows are not detected
due to light conditions. Undesired ellipses are the air
inlet vent (feature 15) and a part of the logo (feature
9). The bipartite graph in Fig. 5b resumes the match-
ing. The left part is made of 10 good matches and
the right part of 3 bad matches. Last three are inaccu-
rate matches because windows are actually projected
on their precedent neighbors. These three can be ig-
nored by taking into account the distance between the
windows. The robot starts the visual servoing.
In Fig. 4, the robot performed a spiral obstacle
avoidance, to avoid moving humans. The tracking al-
gorithms lost targets. Relying on odometry, the robot
has to detect some features again, taking into account
its estimated location. The CAD model projection is
presented in Fig. 4a. The air inlet vent, the probe area
and the static port are projected (respectively features
1, 2 and 3). The projection is slightly inaccurate. The
ellipse image features are given in Fig. 4c. An un-
desired ellipse is extracted from the tire (feature 1).
Fig. 4b, the bipartite graph resumes the perfect ellipse
matching. The robot restarts the visual servoing.
In Fig. 7 and 8, the robot arrives in a checking
area. The CAD model projection is presented in
Fig. 7a and 8a. For the ellipse features, the air in-
let vent, the probe area and the static port are pro-
jected (respectively features 1, 2 and 3). For the seg-
ments, the red warning zone around the static port is
projected. Unfortunately due to bad robot pose esti-
mation, the projection is inaccurate. The ellipse im-
age features are given in Fig. 7c. The segment image
features are given in Fig. 8c. The bipartite graph in
Fig. 7b resumes the perfect ellipse matching.
Due to the amount of line segments in a scene, the
line segment features are only used with the PTZ cam-
era at the checking position, Fig. 8. The PTZ cam-
era is directed towards the aircraft surface so the seg-
ments set is decreased. The line segments are used
for the static port because sometimes the detection of
the corresponding ellipse fails. The bipartite graph
resumes the perfect segment matching, see Fig. 8b.
Matching CAD Model and Image Features for Robot Navigation and Inspection of an Aircraft
363
(a) Model features projected
to the sensed image.
(b) Bipartite graph with eliminated edges
(grey) and matches (blue).
(c) Ellipse detection in the
sensed image (EDCircles
with the proposed postpro-
cessing step).
Figure 7: Inspection mode.
(a) Model features projected to the
sensed image.
(b) Bipartite graph with eliminated edges (grey)
and matches (blue).
(c) Segment detection in the sensed
image.
Figure 8: Inspection mode.
5 INSPECTION APPROACHES
In this section, the inspection approaches and numer-
ical results will be provided for the air inlet vent and
the static port.
Detection phase is evaluated by counting images
on which the approach was able to isolate ROI suc-
cessfully enough that the zooming is possible. In-
spection approaches are evaluated by calculating false
positive rate (FPR) and false negative rate (FNR). In-
put image in terms of the tested approach is classified
as false positive (FP) in the case when the defect is not
present and the approach reported a defect. It is clas-
sified as false negative (FN) in the case when there is
a defect and the method reports no defect.
False positive rate: ratio between number of false
positive images and total number of images with no
defect.
FPR =
FP
FP + T N
where TN is the number of images with no defect on
which the method reported no defect. FPR is the mea-
sure of false alarms.
False negative rate: ratio between number of false
negative images and total number of images with de-
fect.
FNR =
FN
FN + T P
where TP is the number of images with defect on
which the method reported a defect. FNR is the mea-
sure of missed defects. This measure is considered
critical in our application.
5.1 Air Inlet Vent
The objective is to verify that the vent is closed
(Fig. 9a). Challenging case is when the inlet is par-
tially open (Fig. 9c). For a detailed inspection, a small
sliding window is moved along the border of ROI
(Fig. 9) and uniformity of the sliding window is es-
timated by the binarization.
(a) Closed vent
(negative).
(b) Open vent
(positive).
(c) Partially open
vent (positive).
Figure 9: Air inlet vent - sliding window inspection.
In the case of open vent, there are two different
regions within sliding window, while in the case of
closed vent, the sliding window is uniform.
Matching algorithm was evaluated on a dataset of
23 low zoom images. It detected the vent in 100%
of the cases. Inspection was evaluated on 32 high
zoom (ex. Fig. 9) images (13 negative and 19 positive
cases) of two different kinds of vent. On this dataset,
the sliding window method performed with both FNR
and FPR equal to 0%.
ICPRAM 2016 - International Conference on Pattern Recognition Applications and Methods
364
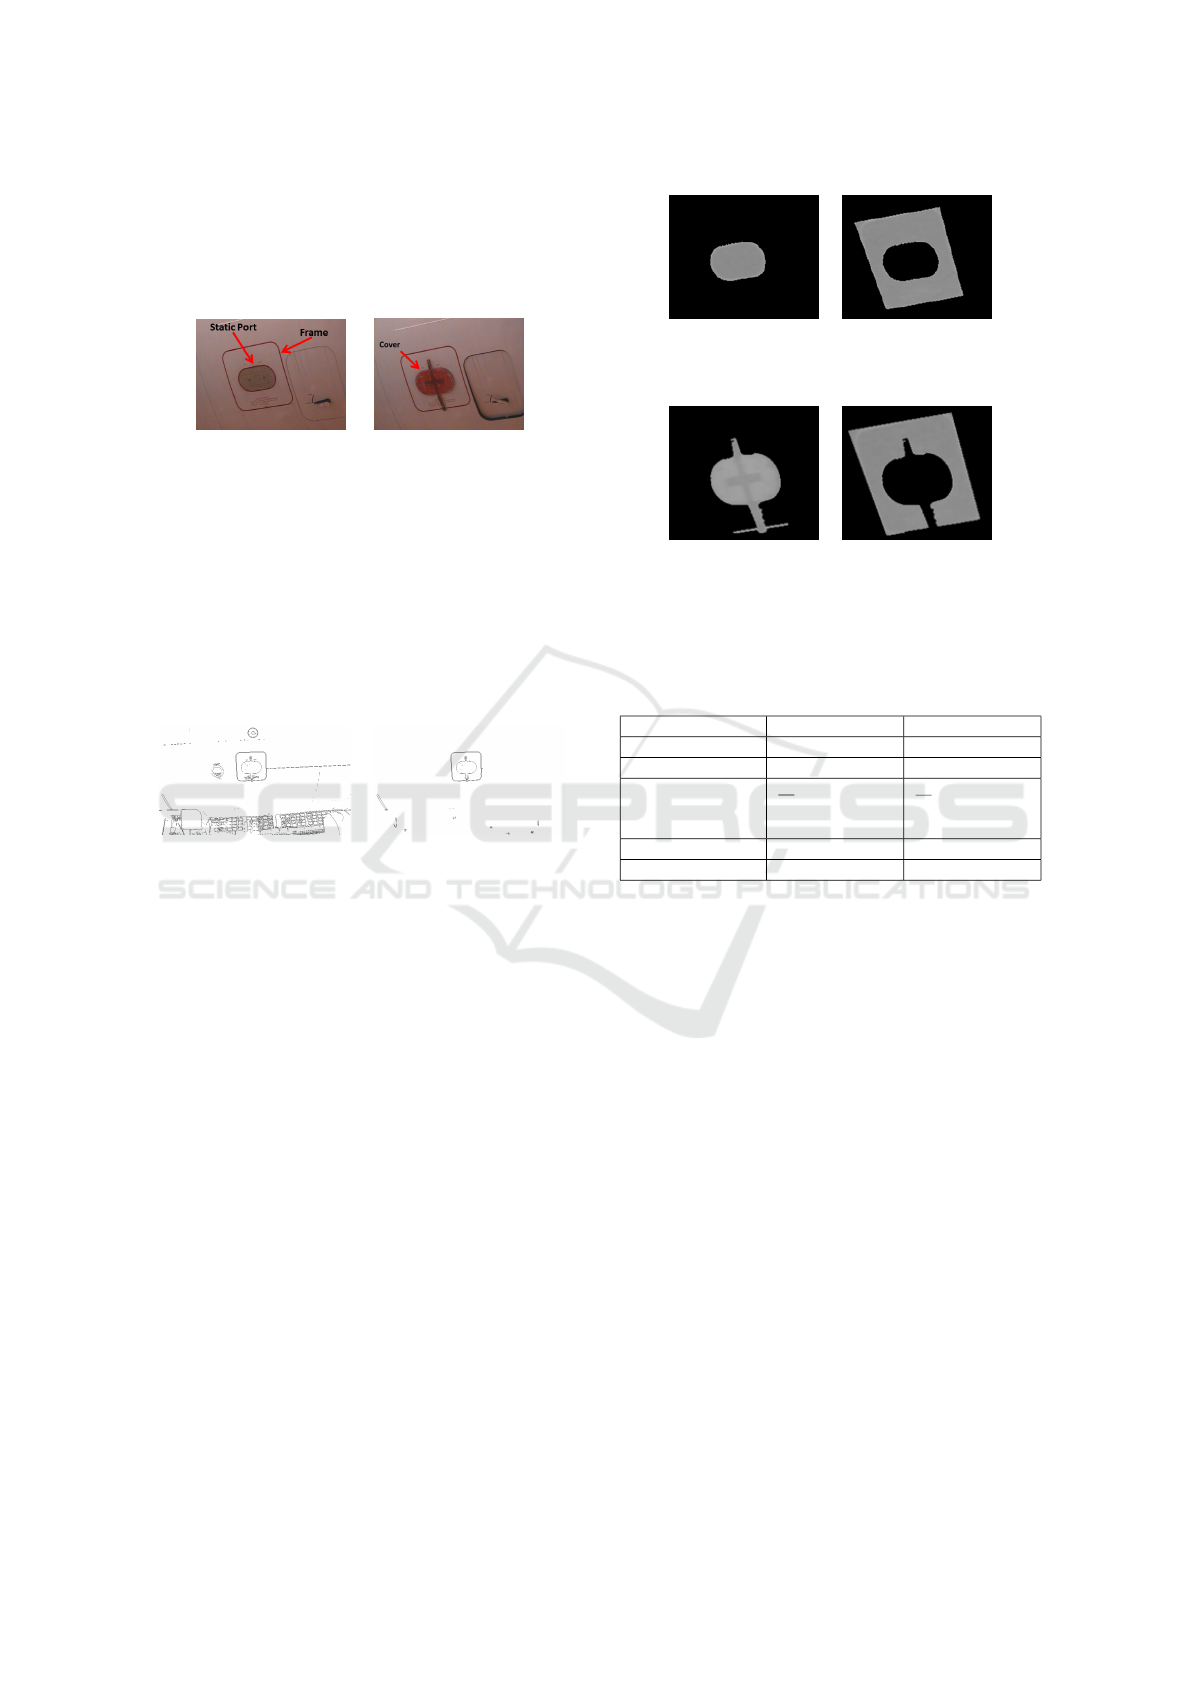
5.2 Static Ports
The aim is to verify that the protecting cover is re-
moved from the static ports (Fig. 10).
(a) Uncovered (nega-
tive).
(b) Covered (posi-
tive).
Figure 10: F/O and CAPT static ports. Wrong situation is
when protecting cover is still present (Fig. 10b).
Since there are red regions on the image, original
RGB image is converted to CIELAB color space. A*
channel of this color space is suitable for segmenting
red regions. Further, from the input edge set, only
edges corresponding to red regions are kept. The im-
provement can be seen in Fig. 11.
(a) All the edges of the in-
put image.
(b) Edges corresponding
to red regions.
Figure 11: Significant reduction of edge set by rejecting
edges of non-red regions.
On the zoomed image, segmentation based on re-
gion growing technique is employed on the static
ports region, by setting the seed pixel in the mean po-
sition of the previously segmented rectangular ROI.
Convexity of the detected static port region is used
for making a decision. The region is convex in un-
covered case (Fig. 12a) and concave in covered case
(Fig. 12c). The convexity is estimated by the ratio of
the segmented region area and the area of its convex
hull.
The detection approach followed by the matching
step was tested on a dataset of 75 images of two dif-
ferent kinds of static ports and it was successful in the
97% of the cases. The inspection method was eval-
uated on a dataset of 96 images (37 negative and 59
positive cases) with different cover shapes. The ap-
proach has shown accuracy with both FNR and FPR
equal to 0%. Detection and inspection results for both
items are summarized in the Table 2.
(a) Uncovered case:
static ports region.
(b) Uncovered case:
frame without static
ports region.
(c) Covered case:
static ports region.
(d) Covered case:
frame without static
ports region.
Figure 12: Static ports - uncovered: both regions are not
red; covered: region 12c is red, region 12d is not red.
Table 2: Evaluation results.
Item: Air inlet vent Static port
Detection dataset 23 75
Detection accuracy 100% 97%
Inspection dataset 32
13 negative
19 positive
96
37 negative
59 positive
Inspection FPR 0% 0%
Inspection FNR 0% 0%
6 CONCLUSION
Similarity measure is used to match projected ge-
ometric primitives from CAD model with detected
ones in real camera images. Existing similarity mea-
sure for segments is adapted to ellipses. This match-
ing step facilitates the detection and data association
processes for navigation and inspection tasks. In navi-
gation mode, features are provided to the visual servo-
ing and tracking algorithms. When robot is in check-
ing area, location of the desired item is forwarded to
the inspection algorithm. Results prove that even with
an inaccurate robot location estimation, good match-
ing results are still obtained so robot location can be
corrected. It is important because the robot can switch
from visual servoing to obstacle avoidance where the
robot pose could be updated only with odometry.
Minor problem has been noticed in some windows
matching. The inclusion of distance information be-
tween features is in development. When the robot
is really near the aircraft, ellipse extraction algorithm
are not precise on the detection of the static port due
Matching CAD Model and Image Features for Robot Navigation and Inspection of an Aircraft
365

to the fact that the shape is a superellipse. Superel-
lipse feature extraction is under consideration.
Inspection approaches were presented for air inlet
vent and static ports. Image processing approaches
were evaluated on real airplane exterior images. On
our dataset, inspection approaches could reach 0%
FPR and FNR. For the moment, the approaches
are adapted to the items and are based on heuris-
tics. Comparison with binary classification methods
is planned once the training data is sufficient.
Testing dataset is obtained in hangar with constant
illumination. Some artificial illumination is added to
make the dataset more representative. Next acquisi-
tion on tarmac with more various conditions (other
airplanes present, weather, etc.) is planned.
ACKNOWLEDGEMENT
This work is part of the AIR-COBOT project
(http://aircobot.akka.eu) approved by the Aerospace
Valley world competitiveness cluster. The authors
would like to thank the French Government for
the financial support via the Single Inter-Ministry
Fund (FUI). The partners of the AIR-COBOT
project (AKKA TECHNOLOGIES, Airbus Group,
ARMINES, 2MoRO Solutions, M3 SYSTEMS and
STERELA) are also acknowledged for their support.
REFERENCES
Akinlar, C. and Topal, C. (2011). EDLines: A real-time
line segment detector with a false detection control.
Pattern Recognition Letters, 32(13):1633 – 1642.
Akinlar, C. and Topal, C. (2013). EDCircles: A real-time
circle detector with a false detection control. Pattern
Recognition, 46(3):725 – 740.
Bay, H., Ferrari, V., and Gool, L. V. (2005). Wide-baseline
stereo matching with line segments. Proceedings of
Computer Vision and Pattern Recognition, 1:329–336.
Chaumette, F. and Hutchinson, S. (2006). Visual servo con-
trol, part i: Basic approaches. IEEE Robotics and Au-
tomation Magazine, 13(4):82–90.
Fishkel, F., Fischer, A., and Ar, S. (2006). Verification of
engineering models based on bipartite graph matching
for inspection applications. Springer-Verlag Berlin
Heidelberg. LNCS 4077, pages 485–499.
Futterlieb, M., Cadenat, V., and Sentenac, T. (2014). A nav-
igational framework combining visual servoing and
spiral obstacle avoidance techniques. In Proc. of the
11th International Conference on Informatics in Con-
trol, Automation and Robotics, Volume 2, Vienna, Aus-
tria, 1 - 3 September, 2014, pages 57–64.
Hutter, M. and Brewer, N. (2009). Matching 2-d ellipses
to 3-d circles with application to vehicle pose identifi-
cation. Proc. of International Conference Image and
Vision Computing, pages 153 – 158.
Jovan
ˇ
cevi
´
c, I., Larnier, S., Orteu, J.-J., and Sentenac, T.
(2015). Automated exterior inspection of an aircraft
with a pan-tilt-zoom camera mounted on a mobile
robot. Journal of Electronic Imaging, 24(6):061110.
Jr., R. M. C., Bengoetxea, E., Bloch, I., and Larra
˜
naga,
P. (2005). Inexact graph matching for model-based
recognition: Evaluation and comparison of opti-
mization algorithms. Elsevier, Pattern Recognition,
38:2099–2113.
Malamas, E. N., Petrakis, E. G., Zervakis, M., Petit, L., and
Legat, J.-D. (2003). A survey on industrial vision sys-
tems, applications and tools. Image and Vision Com-
puting, 21(2):171 – 188.
Marchand, E. and Chaumette, F. (2005). Feature track-
ing for visual servoing purposes. Robotics and Au-
tonomous Systems, 52(1):53–70.
Matas, J., Galambos, C., and Kittler, J. (2000). Robust
detection of lines using the progressive probabilistic
hough transform. Computer Vision and Image Under-
standing, 78(1):119 – 137.
McIntosh, J. H. and Mutch, K. M. (1988). Matching straight
lines. Computer Vision, Graphics and Image Process-
ing, 43:386–408.
Mumtaz, R., Mumtaz, M., Mansoor, A. B., and Masood, H.
(2012). Computer aided visual inspection of aircraft
surfaces. International Journal of Image Processing
(IJIP), 6(1):38–53.
Panda, B. and Pradhan, D. (2013). Minimum paired-
dominating set in chordal bipartite graphs and perfect
elimination bipartite graphs. Journal of Combinato-
rial Optimization, 26:770 – 785.
Prasad, D. K., Leung, M. K., and Quek, C. (2013). Ellifit:
An unconstrained, non-iterative, least squares based
geometric ellipse fitting method. Pattern Recognition,
46(5):1449 – 1465.
Siegel, M., Gunatilake, P., and Podnar, G. (1998). Robotic
assistants for aircraft inspectors. Instrumentation
Measurement Magazine, IEEE, 1(1):16–30.
Viana, I., Bugarin, F., Cornille, N., and Orteu, J.-J. (2015).
Cad-guided inspection of aeronautical mechanical
parts using monocular vision.
von Gioi, R. G., Jakubowicz, J., Morel, J.-M., and Randall,
G. (2010). LSD: A fast line segment detector with a
false detection control. IEEE Transactions on Pattern
Analysis and Machine Intelligence, 32(4):722–732.
ICPRAM 2016 - International Conference on Pattern Recognition Applications and Methods
366
