
Particle-based Simulation on Aortic Valve Behavior with CG Model
Generated from CT
Nobuhiko Mukai, Tomofumi Takahashi and Youngha Chang
Computer Science, Tokyo City University, 1-28-1 Tamazutsumi, Setagaya, Tokyo, Japan
Keywords:
Computer Graphics, Physics based Simulation, Particle Method, Medical Application, Aorta.
Abstract:
We have tried to simulate the aortic valve behavior with a particle method. The simulation model has been
generated from CT data; however, the model was a little bit distorted due to some diseases. The distorted
model is not appropriate for the simulation because we have to simulate the aortic valve behavior for various
kinds of conditions. Then, we have created the normal model by modifying the generated model. In order to
simulate the aortic valve behavior, blood should be flown in the aortic model and particle methods are suitable
for fluid simulation. On the other hand, FEM (Finite Element Method) is usually used for the simulation
of elastic body such as the aortic wall and the aortic valve. However, it is difficult to calculate the mutual
interaction between fluid and elastic body if two different kinds of methods such as particle method and FEM
are adopted for one simulation. Therefore, we have applied a particle method for both of fluid and elastic
body. As the result of the simulation, we have been able to visualize the blood flow and the pressure inside the
aorta, and the stress distribution on the aortic valve.
1 INTRODUCTION
Computer graphics and virtual reality technologies
have been progressed rapidly and their related sys-
tems are being developed especially in medical fields
such as preoperative planning, surgical simulation,
intraoperative navigation, and so on. Among them,
some systems use robotic manipulators (Yeniaras
et al., 2011). For the purpose of surgical training us-
ing virtual reality, the target organs are necessary and
they are generated based on CT (Computed Tomog-
raphy), MRI (Magnetic Resonance Imaging), MRA
(Magnetic Resonance Angiography), PET (Positron
Emission Tomography), and so forth. In order to
generate the computer model used for the simula-
tion or training, segmentation is needed in advance.
There are mainly three types of segmentations: re-
gion model based level set segmentation, hierarchi-
cal segmentation, and hybrid segmentation of the two
methods (Song et al., 2011).
In addition, there are many medical systems us-
ing computer graphics and virtual reality technolo-
gies, and they treat some organs such as brain, lung,
stomach, liver, and so on. On the other hand, there
are many blood vessels in our body and blood cir-
culation is very important to keep our good condi-
tions. Then, there are so many research works re-
lated to blood vessels (Kirbas and Quek, 2004). Blood
vessels are also divided into some categories such as
aorta, artery, vein, capillary, and so forth. Among
them, the largest and the most important blood ves-
sel is the aorta, which sends necessary nutrition from
the heart to everywhere in our body through artery
and capillary. Then, there are also some studies re-
lated to the aorta and the heart such as aortic di-
ameter estimation using mono-static radar (Solberg
et al., 2010), heart reconstruction based on volumetric
imaging (Bajaj and Goswami, 2008), 3D volumetric
shape reconstruction (Mukai et al., 2011), and blood
stream simulation (Nakagawa et al., 2011b; Seo et al.,
2011; Wendell et al., 2013).
Inside the aorta, there is a valve called the aor-
tic valve, and the blood does not flow correctly if the
aortic valvular dysfunction occurs due to some dis-
eases. One disease is aortic valvular stenosis that nar-
rows the aortic valvular port and makes blood flow
unsmooth, which causes the high pressure difference
between the left ventricle and the aorta. Another dis-
ease is aortic valvular insufficiencythat closes the aor-
tic valve incorrectly, which causes blood flow back
from the aorta to the left ventricle. As a result, the aor-
tic pressure remains lower even after the aortic valve
closes. (Izawa, 2009; Levick, 2011; Klabunde, 2012;
Silbernagl and Despopoulos, 2009).
248
Mukai, N., Takahashi, T. and Chang, Y.
Particle-based Simulation on Aortic Valve Behavior with CG Model Generated from CT.
DOI: 10.5220/0005766402460251
In Proceedings of the 11th Joint Conference on Computer Vision, Imaging and Computer Graphics Theory and Applications (VISIGRAPP 2016) - Volume 1: GRAPP, pages 248-253
ISBN: 978-989-758-175-5
Copyright
c
2016 by SCITEPRESS – Science and Technology Publications, Lda. All rights reserved
There are mainly two types of surgeries to cure
the preceding diseases. One is aortic valvular re-
placement (AVR), which replaces the dysfunctional
live valve with an artificial one. The other surgery
is aortic valvuloplasty (AVP), which retrieves the
valvular function by repairing the dysfunctional live
valve. The surgeries are very difficult so that preoper-
ative planning and simulation are necessary, and aor-
tic valve simulations have been performed based on
FEM (Hart et al., 2003; van Loon et al., 2005; Le
and Sotiropoulos, 2013; Hsu et al., 2014; Hsu et al.,
2015). In this method, FSI (Fluid-Structure Interac-
tion) should be analized with two different models:
Navier-Stokes equation for fluid and Neo-Hookean
model for solid. Then, we have simulated the aor-
tic valve behavior based on particle model for both
fluid and elastic body (Nakagawa et al., 2012; Mukai
et al., 2013; Mukai et al., 2014a; Mukai et al., 2014b;
Mukai et al., 2015).
The model used in the previous research, however,
was generated by referring to some medical books just
for the purpose of general blood flow simulation with
a normal aorta. Therefore, we report the generation
of the simulation model based on CT data, and the
visualization of the blood flow, the pressure inside the
aorta and the stress distribution on the aortic valve.
2 MODEL GENERATION
2.1 Aorta Model
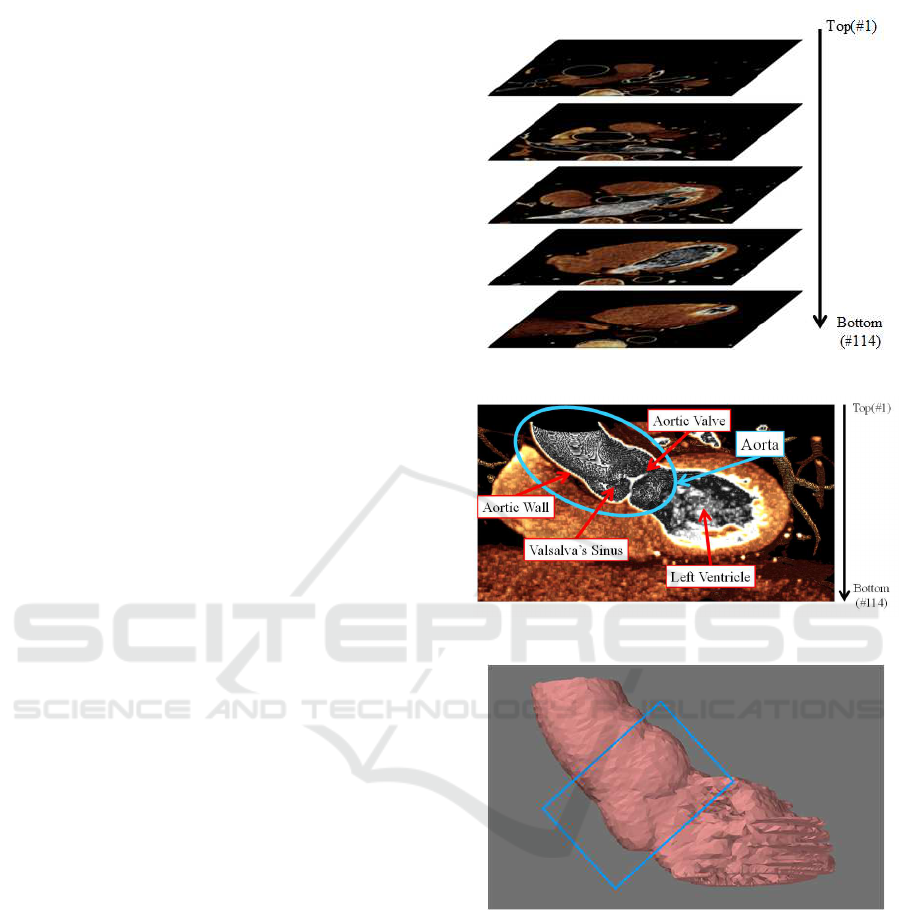
The simulation model of the aorta is generated from
CT data. The CT image data of the heart is shown
in Figure 1, which is composed of 114 images, and
is numbered from the top to the bottom. The image
format is “bitmap” and the size is 512×512.
On the other hand, Figure 2 shows the vertical sec-
tion image of the heart, which explains the locations
of the aorta, the aortic wall, the aortic valve, the Val-
salva’s sinus, and the left ventricle.
Figure 3 is the polygon model generated from the
CT data. In order to simulate the aortic valve behav-
ior, the model surroundedby the blue rectangle is nec-
essary. In addition, blood should be flown in the aorta
for the simulation, and some extended simulation ar-
eas are necessary above and below the target model
because blood comes from the left ventricle and goes
to the aorta with some velocity.
Figure 4 (a) and (b) show the extracted model
from Figure 3 and the aorta model generated by
adding cylinders above and below the extracted model
for the simulation of blood flow, respectively. How-
ever, the added cylinders are not on the same line
Figure 1: CT image of the heart.
Figure 2: Vertical image of the heart.
Figure 3: Polygon model of the aorta and the left ventricle.
since the extracted model is a little bit distorted. If
this generated aorta model is used for the simulation,
blood does not flow smoothly in the aorta so that we
cannot investigate correctly the aortic valve behavior
caused by the blood flow.
On the other hand, the Valsalva’s sinus is com-
posed of three cusps. Then, we have decided to select
one cusp from the Valsalva’s sinus, and generate the
simulation model by combining three cusps copied
from one cusp. Figure 5 shows the generated simula-
tion model. Red parts are selected and copied cusps,
and gray parts are connection part and cylinders lo-
cated above and below the target area. Two cylinders
Particle-based Simulation on Aortic Valve Behavior with CG Model Generated from CT
249
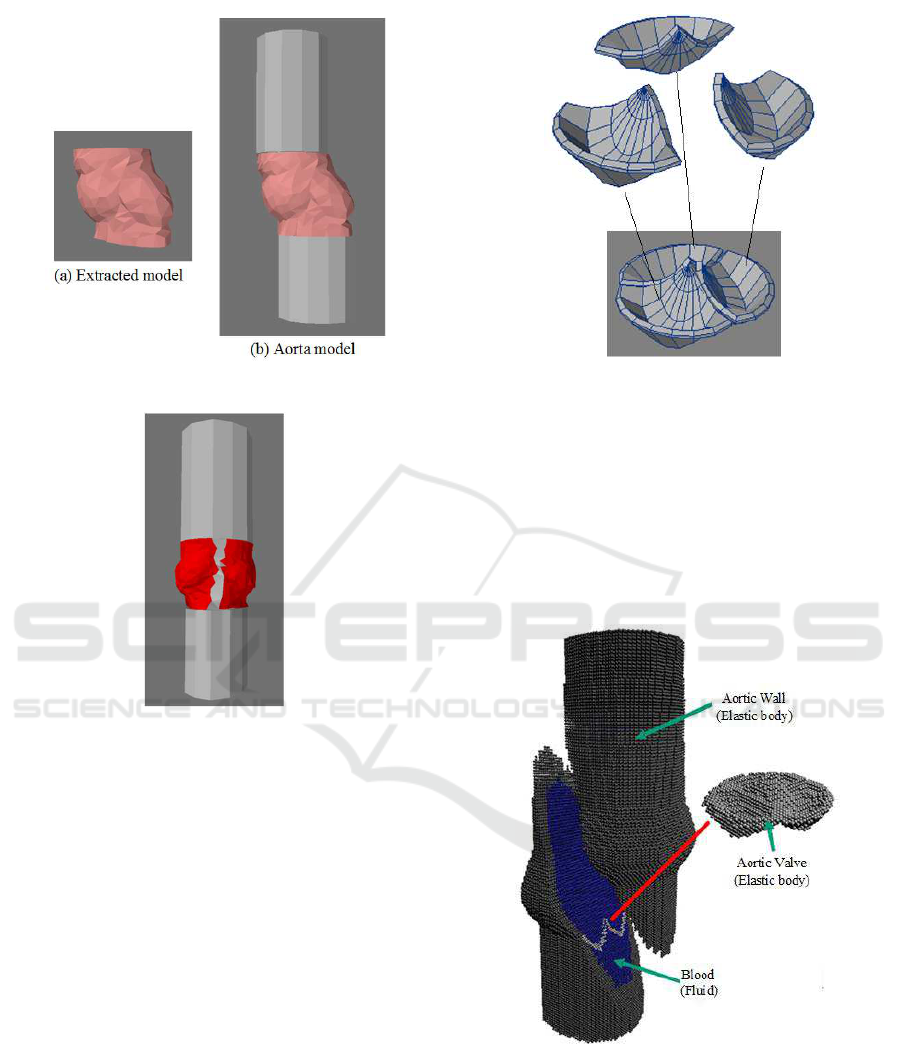
Figure 4: Extracted model and generated aorta model.
Figure 5: Simulation model.
above and below the target area are on the same line.
2.2 Aortic Valve Model
It was difficult to generate the aortic valvemodel from
CT data because the valve image is not so clear com-
pared with the aortic wall that we have decided to gen-
erate the aortic valve model by referring to a medical
book (Arai, 2003). Figure 6 shows the polygon model
of the aortic valve, which is composed of three cusps.
Now, we have the both models of the aortic wall
and the aortic valve; however, those models are com-
posed of polygons. The aortic wall and the aortic
valve are elastic body so that FEM is usually used for
the simulation. However, our purpose is the aortic
valve behavior caused by blood flow. Blood flow is
fluid and the topology is changed by the opening and
closing of the aortic valve. In general, particle method
is used for the simulation of fluid. Here, there is one
problem, that is the collision detection and the mutual
interaction between the fluid and the elastic body. If
two different methods are adopted for the simulation,
Figure 6: Aortic valve model.
it is difficult to detect the collision between the fluid
and the elastic body and to convey the force from the
fluid to the elastic body. Therefore, we have decided
to use a particle method for both materials: fluid and
elastic body. Then, we have to transform the polygon
model to a particle model with depth peeling method
(Nakagawa et al., 2011a). The particle models trans-
formed from the polygon models are shown in Figure
7.
Figure 7: Particle model of the aortic wall and valve.
3 SIMULATION
In this simulation, a particle method is used. There
are two types of particle methods: SPH (Smoothed
Particle Hydrodynamics) and MPS (Moving Particle
Semi-implicit). In general, blood is treated as incom-
GRAPP 2016 - International Conference on Computer Graphics Theory and Applications
250

pressible fluid so that we use MPS (Koshizuka, 2005)
for the simulation.
3.1 Governing Equations
Two kinds of governing equations are used for fluid
simulation: Cauchy’s equation of motion and equa-
tion of continuity, which are written as the following.
ρ
Dv
Dt
= ∇ · σ + b (1)
Dρ
Dt
+ ρ∇· v = 0 (2)
where, ρ is density, v is velocity, t is time, σ is stress
tensor, and b is body force acceleration such as grav-
ity.
In addition, the constitutive equation of elastic
body is described as follows.
σ
e
= λtr(ε)I+ 2µε (3)
ε =
1
2
n
∇u+ (∇u)
T
o
(4)
where, σ
e
is stress of elastic body, ε is strain tensor,
I is unit tensor, u is displacement, λ and µ are lame
constants, which are expressed as follows.
λ =
νE
(1+ ν)(1− 2ν)
(5)
µ =
E
2(1+ ν)
(6)
where, ν is Poisson’s ratio and E is Young’s module.
By substituting Eqs.(3) and (4) for Cauchy’s equa-
tion (Eq.(1)), the next Cauchy-Navier equation is ob-
tained, which equation is applied to analyze the be-
havior of the aortic wall and valve.
ρ
D
2
u
Dt
2
= (λ + µ)∇(∇· u)µ∇
2
u+ b (7)
On the other hand, the constitutive equation of fluid is
written as the following.
σ
f
= −pI+ 2ηD (8)
D =
1
2
n
∇v+ (∇v)
T
o
(9)
where, σ
f
is stress of fluid, p is pressure, I is unit
tensor, η is viscosity, D is tensor of strain velocity,
and v is velocity. By substituting Eqs.(8) and (9) for
Eq.(1), Navier-Stokes equation is obtained as follows,
which is applied to analyze the behavior of blood.
ρ
Dv
Dt
= −∇p+ η∇
2
v+ b (10)
3.2 Simulation Results
The simulation was performed with a normal PC,
which has i7-3770K CPU and GeForce GTX570
GPU. The simulation took about 1[s], and the sim-
ulaiton time for 1[step] corresponds to 0.1[ms] in real
time.
The number of particles for the aortic wall and
valve were about 9k and 900, respectively. On the
other hand, the number of blood changes from about
26k at the beginning to 42k at the end of the simula-
tion, because some particles are added as the particle
in the left ventricle becomes shorter. The added parti-
cles are provided from solid particles constructing the
cylinder below the target area. The numbers of solid
particles that are located above and below the target
area are 25k and 52k for the aortic wall and blood,
respectively.
In the real heart, there is heart pulsation, which
causes the blood flow from the left ventricle to the
aorta; however, the particles are flown with sinusoidal
velocity in the simulation.
Figures 8 shows the visualization of the pressure
inside the aorta. At the initial state, the pressures in
the aorta (top side) and the left ventricle (bottom side)
are the same. As blood flows from the left ventricle to
the aorta, the pressure in the left ventricle is a little bit
higher than the aorta. By the pressure difference, the
aortic valve starts to open. During the opening of the
aortic valve, the pressure in the left ventricle is higher
than the aorta. However, the pressure difference be-
comes gradually small and the aortic valve starts to
close.
On the other hand, Figure 9 shows the visualiza-
tion of the stress distribution on the aortic valve. The
scale is different from that of the pressure to use the
dynamic range efficiently. The opening and closing
mechanisms are the same as that of the pressure; how-
ever, the stress value is higher than the pressure. High
stresses occur at the root of the cusps especially when
the aortic valve is opening and closing.
4 CONCLUSIONS
In this paper,we have reported the particle-based sim-
ulation on the aortic valve behavior. The simulation
model was generated from CT data; however, the gen-
erated model was a little bit distorted due to some dis-
eases, and the model was not suitable for the general
purpose of the simulation so that we have modified
Particle-based Simulation on Aortic Valve Behavior with CG Model Generated from CT
251
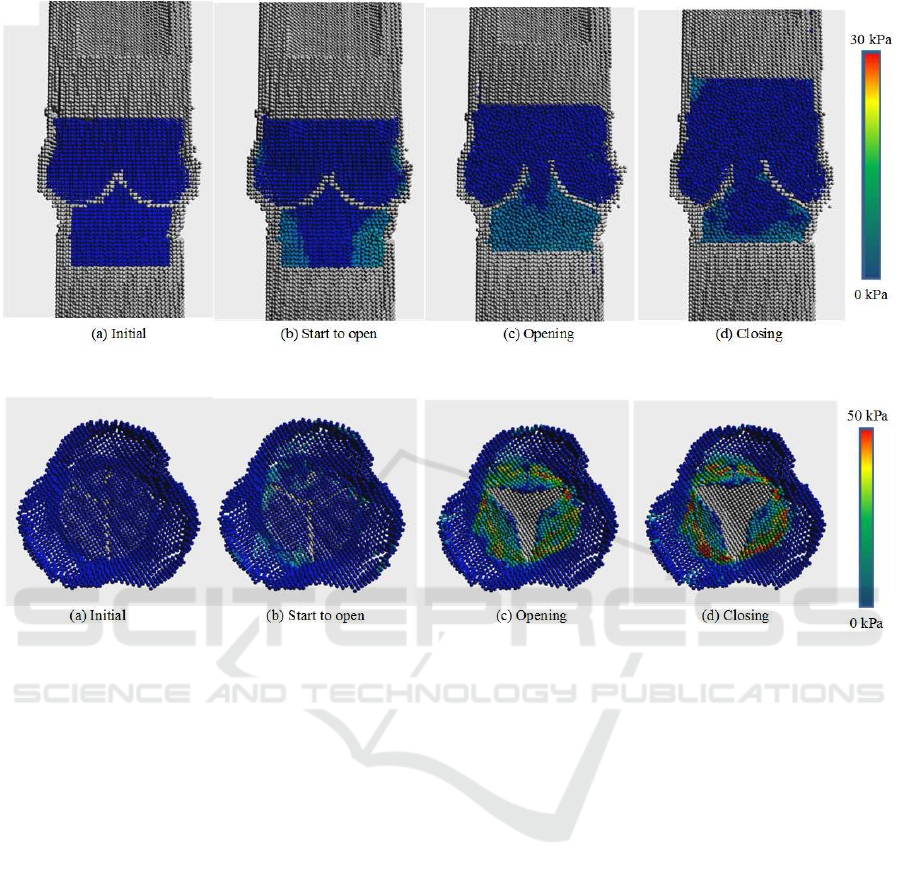
Figure 8: Pressure inside the aorta.
Figure 9: Stress distribution on the aortic valve.
the model by combining three copied cusps.
In addition, the simulation has to treat two differ-
ent materials: fluid and elastic body. Particle method
is suitable for fluid simulation, while FEM is suit-
able for elastic body simulation. However, it is dif-
ficult to treat mutual interaction between two materi-
als if we use two different methods. Then, we have
adopted a particle method in this simulation so that
the simulation models were transformed from poly-
gons to particles for the particle based simulation. We
have also used two different but unified equations for
the simulation: Cauchy-Navier equation and Navier-
Stokes equation for elastic body and fluid, respec-
tively, which are introduced from Cauchy’s equation
of motion by changing the constitutive equation ac-
cording to the materials: elastic body and fluid, re-
spectively.
Finally, we have been able to perform the simu-
lation, and visualize the pressure inside the aorta and
the stress distribution on the aortic valve. We have
also found that high stresses occur at the root of the
cusps when the aortic valve is opening and closing.
In the real heart, the heart pulsation causes the
blood flow; however, we did not consider the heart
pulsation in this simulation. Therefore, we have to
calculate the blood velocity based on the heart pulsa-
tion. In addition, we have to validate our method by
comparing the simulation results with the real video,
and also expand the simulation method to perform
many kinds of simulations for the planning of real
surgeries.
ACKNOWLEDGEMENTS
We greatly appreciate Dr. Shuichiro Takanashi, who
is a chief director of Sakakibara Heart Institute, for
providing us the CT data and some useful advices.
This work also has been supported by Grant-in-Aid
for Scientic Research on Innovative Areas from the
Ministery of Education, Culture, Sports, Science and
Technology of Japan.
REFERENCES
Arai, T. (2003). Surgery of the Cardiac Valvulopathy.
Igaku-shoin, Tokyo, 2nd edition.
GRAPP 2016 - International Conference on Computer Graphics Theory and Applications
252

Bajaj, C. and Goswami, S. (2008). Multi-component heart
reconstruction from volumetric imaging. In The 2008
ACM symposium on Solid and Physical Modeling,
pages 193–202.
Hart, J. D., Peters, G. W. M., Schreurs, P. J. G., and Baai-
jens, F. P. T. (2003). A three-dimensional computa-
tional analysis of fluid-structure interaction in the aor-
tic valve. Journal of Biomechanics, 36:103–112.
Hsu, M. C., Kamensky, D., Bazilevs, Y., Sacks, M. S., and
Hughes, T. J. R. (2014). Fluid-structure interaction
analysis of bioprosthetic heart valves: Significance of
arterial wall deformation. Computational Mechanics,
54:1055–1071.
Hsu, M. C., Kamensky, D., Xu, F., Kiendl, J., Wang,
C., Wu, M. C. H., Mineroff, J., Reali, A., Bazilevs,
Y., and Sacks, M. S. (2015). Dynamic and fluid-
structure interaction simulations of bioprosthetic heart
valves using parametric design with t-splines and
fung-type material models. Computational Mechan-
ics, 55:1211–1225.
Izawa, Y. (2009). Medical Note: Cardiovascular Disease.
Nishimura, Tokyo.
Kirbas, C. and Quek, F. (2004). A review of vessel extrac-
tion techniques and algorithms. Computing Surveys,
36(2):81–121.
Klabunde, R. E. (2012). Color Atlas of Physiology. Lippin-
cott Williams & Wilkins, Baltimore, 2nd edition.
Koshizuka, S. (2005). Particle Method. Maruzen, Tokyo.
Le, T. B. and Sotiropoulos, F. (2013). Fluid-structure inter-
action of an aortic heart valve prosthesis driven by an
animated anatomic left ventricle. Journal of Compu-
tational Physics, 244:41–62.
Levick, J. R. (2011). An Introduction to Cardiovascular
Physiology. Medical Science International, Tokyo.
Mukai, N., Abe, Y., Chang, Y., Niki, K., and Takanashi,
S. (2014a). Aortic valve simulation by considering
heart’s pulsation and axial flow. In NICOGRAPH In-
ternational 2014, pages 18–22.
Mukai, N., Abe, Y., Chang, Y., Niki, K., and Takanashi, S.
(2014b). Particle based simulation of the aortic valve
by considering heart’s pulsation. In Medicine Meets
Virtual Reality, pages 285–289. IOS Press.
Mukai, N., Abe, Y., Chang, Y., Niki, K., and Takanashi, S.
(2015). Visualization of pressure and stress distribu-
tions in aortic valve simulation by considering heart’s
pulsation and axial flow. The Journal of the Society
for Art and Science, 14(1):1–8.
Mukai, N., Nakagawa, M., Abe, Y., Chang, Y., Niki, K., and
Takanashi, S. (2013). Simulation of the aortic valve
deformation by considering blood flow reflection. In
Medicine Meets Virtual Reality, pages 286–292. IOS
Press.
Mukai, N., Tatefuku, Y., Nakagawa, M., Niki, K., and
Takanashi, S. (2011). Construction of 3d volumetric
shape model from 2d us images. In The 19th Interna-
tional Congress on Modelling and Simulation, pages
179–185.
Nakagawa, M., Mukai, N., and Kosugi, M. (2011a). A fast
collision detection method by using modified depth
peeling. Journal of The Institute of Image Informa-
tion and Television Engineers, 65(6):825–832.
Nakagawa, M., Mukai, N., Niki, K., and Takanashi, S.
(2011b). A bloodstream simulation based on parti-
cle method. In Medicine Meets Virtual Reality, pages
389–393. IOS Press.
Nakagawa, M., Mukai, N., Niki, K., and Takanashi, S.
(2012). Particle based visualization of stress distri-
bution caused by the aortic valve deformation. In
The 2012 International Workshop on Advanced Image
Technology, pages 40–45.
Seo, T., Jeong, S. H., Kim, D. H., and Seo, D. (2011).
The blood flow simulation of human aortic arch model
with major branches. In International Conference on
Biomedical Engineering and Informatics, pages 923–
926.
Silbernagl, S. and Despopoulos, A. (2009). Color Atlas of
Physiology. Georg Thieme Verlag, Stuttgart, 6th edi-
tion.
Solberg, L. E., Balasingham, I., and Hamran, S. E. (2010).
Candidate estimators for aorta diameter estimation us-
ing monostatic rader. In The Fifth Internaional Con-
ference on Body Area Networks, pages 124–130.
Song, Y., Luboz, V., Din, N., King, D., Gould, D., Bello,
F., and Bulpitt, A. (2011). Segmentation of 3d vas-
culatures for interventional radiology simulation. In
Medicine Meets Virtual Reality, pages 599–605. IOS
Press.
van Loon, R., Anderson, P. D., Baaijens, F. P. T., and
van de Vosse, F. N. (2005). A three-dimensional
fluid-structure interaction method for heart valve mod-
elling. C.R.Mecanique, 333:856–866.
Wendell, D. C., Samyn, M. M., Cava, J. R., Ellwein, L. M.,
Krolikowski, M. M., Gandy, K. L., Pelech, A. M.,
Shadden, S. C., and LaDisaJr., J. F. (2013). Includ-
ing aortic valve morphology in computational fluid
dynamics simulations: Initial findings and application
to aortic coarctation. Medical Engineering & Physics,
35:723–735.
Yeniaras, E., Deng, Z., Syed, M. A., Davies, M. G., and
Tsekos, N. V. (2011). A novel virtual reality envi-
ronment for preoperative planning and simulation of
image guided intracardiac surgeries with robotic ma-
nipulators. In Medicine Meets Virtual Reality, pages
716–722. IOS Press.
Particle-based Simulation on Aortic Valve Behavior with CG Model Generated from CT
253
