
Evaluating Interactive Visualizations for Supporting Navigation
and Exploration in Enterprise Systems
Tamara Babaian, Wendy Lucas, Alina Chircu and Noreen Power
Bentley University, 175 Forest Street, Waltham, MA 02452, U.S.A.
Keywords: Dynamic Visualizations, Interactive Visualizations, Enterprise Systems, ERP.
Abstract: Enterprise Resource Planning (ERP) systems pose usability challenges to all but the most sophisticated of
users. One such challenge arises from complex menu structures that hinder, rather than aid, system navigation.
Another issue is the lack of support for discovering and exploring relationships between the data elements
that underlie all transactions and processes performed with the system. Two dynamic, interactive
visualizations, the Dynamic Task Map and the Association Map, were designed to assist users in ERP system
navigation and data exploration activities. In this paper, we describe a laboratory study comparing the use of
these visual components to standard SAP interfaces. Results from an initial empirical evaluation revealed that
all users were able to complete tasks more quickly and with the same or a lower number of errors when using
the visual components than when using SAP. Answers to questions comparing the standard SAP interface
with visualizations also revealed an overall preference for the visual interfaces. Suggestions for improvements
to the visualizations from study participants provided valuable feedback for future development.
1 INTRODUCTION
In the first issue of Interactions, Myers (1994, p. 74)
wrote that “Time is valuable, people do not want to
read manuals, and they want to spend their time
accomplishing their goals, not learning how to
operate a computer-based system.” Over 20 years
later, many Enterprise Research Planning (ERP)
systems still stand between the users and their ability
to achieve their work-related goals. Companies have
learned the hard way that spending enormous
amounts of time and money on ERP system training
is a critical prerequisite for success. A case in point is
the well-known ERP failure at Lumber Liquidators,
which was blamed in large part on insufficient
attention to user training (Krigsman, 2010).
Even with considerable investments in training,
however, there are no guarantees that implementing
an ERP system will be successful and will lead to
increased productivity. Experience has shown that
poor usability characteristics are at least partly to
blame. Massive menu structures, inadequate
navigational guidance, limited task support, and
complex interfaces are just some of the obstacles
facing users of these systems (Topi, 2005; Rettig,
2007; Scholtz et al., 2010; Parks, 2012; Lambeck et
al., 2014a, 2014b).
The motivation for this research comes from the
belief that it shouldn’t require such vast resources on
the part of the company or herculean efforts on the
part of its employees for ERP usage to meet with
success. Today’s workers have become more
demanding of their office software after having
experienced user-friendly personal devices, and ERP
software providers are paying increased attention to
usability (King, 2012). A recent Gartner report
(Ganly and Montgomery, 2015) notes that ERP
vendors are looking to improve the user experience
by applying social software approaches to building
communication tools. This tactic, however, won’t
tackle the systemic causes of poor usability.
Interactive information visualizations, on the
other hand, can directly impact the user experience by
providing tools and techniques for, among other
things, selecting, filtering, exploring, and connecting
data items (Yi et al., 2007). While such techniques are
widely used by the visual analytics community (Pike
et al., 2009), interactive visualizations are not
prevalent in ERP systems.
In this paper, we present an empirical study of two
interactive visualizations designed to aid ERP system
users in navigation and data exploration tasks
(Babaian et al., 2015). The Dynamic Task Map
(DTM) helps users locate the desired functionality by
providing dynamic, interactive visualizations of
368
Babaian, T., Lucas, W., Chircu, A. and Power, N.
Evaluating Interactive Visualizations for Supporting Navigation and Exploration in Enterprise Systems.
In Proceedings of the 18th International Conference on Enterprise Information Systems (ICEIS 2016) - Volume 2, pages 368-377
ISBN: 978-989-758-187-8
Copyright
c
2016 by SCITEPRESS – Science and Technology Publications, Lda. All rights reserved

transactions performed with the system. It reveals
common usage patterns by visualizing measures that
reflect aggregate user activity, such as the frequency
with which a task has been performed. The
Association Map (AM) highlights associative
relationships between master data entities selected by
the user. It presents an easy to understand, aggregated
view of data relationships that would otherwise need
to be extracted from detailed reports.
Ten study participants, all of whom were novice
users of SAP, performed a set of tasks with each of
these components and answered questions related to
those tasks. They performed those same tasks and
answered the same questions using the corresponding
interfaces in SAP, a market leader in enterprise
application software (Drobik, 2015). The installation
used was SAP ECC 6.0 with SAPGUI 7.40 for
Windows. The participants also answered questions
comparing their experiences with each of the visual
interfaces to those with SAPGUI. All of the
participants took less time and answered at least as
many, and typically more, questions correctly with
the visual interfaces than with SAPGUI. The vast
majority also preferred the visual components.
In the next section of this paper, we review related
work. This is followed by a description of the
visualization components under investigation. The
user study setup is detailed and results from that study
are then presented and discussed. We conclude with
a summary of findings and directions for future work.
2 RELATED WORK
ERP usability issues have been documented in
industry reports and articles as well as research
studies (see, for example, Babaian et al., 2010;
Cooprider et al., 2010; Lucas and Babaian, 2012;
Scholtz et al., 2010). It has been readily
acknowledged that these systems are typically
difficult to use, particularly for novice users, and have
very long learning curves. A study by Topi et al.
(2005) defined six categories of usability problems,
including the identification of and access to the
correct functionality, system output limitations, and
overall system complexity. More recent studies
confirm that the issues identified in this work still
persist today (Parks, 2012; Lambeck et al, 2014a;
Lambeck et al., 2014b).
Rather than tackle ERP usability issues directly,
however, research has often focused on the “human
factor.” Hurtienne et al. (2009) describes three ways
for optimizing the fit between the user, the task, and the
software. The first is adapting the business processes to
the software (i.e., organizational change management).
The second is user training, and the third is changing
and adapting the software to the users and their tasks
via customization. They note that while the first two
approaches are critical for success, the third approach
of customization is usually discouraged. Given that
customization can be costly, time-intensive, and will
typically need to be re-implemented in new releases,
this is not surprising.
Having usability designed into the ERP system in
the first place would be a far more preferable option.
Integrating information visualizations into ERP
interfaces is one way to work toward achieving this
outcome. Parush et al. (2007) found that graphical
visualizations improved performance of ERP users on
tasks of varying complexity in two different task
domains: Purchasing and Production planning and
control. Visualizations can better represent
quantitative data, integrate data from multiple
sources, and aid decision-making. More advanced
visual-spatial displays can support multi-source
integration, which is essential for ERP performance,
and can improve user fit, which contributes to ERP
success (Hong and Kim, 2002).
A survey of 184 users of different experience
levels using a variety of ERP systems revealed that
being able to find the desired enterprise functionality
is still a problem across all user experience levels
(Lambeck et al., 2014a). They also found that the
availability of useful and numerous visualizations can
reduce user ratings of system complexity.
Supplementary systems were found to provide more
useful visualizations than ERP systems (Lambeck et
al., 2014b).
Hipp et al. (2012) point out that being able to
quickly and easily find process information during
process execution is critical, yet most business
processes are presented in a static way. Hipp et al.
(2014) present a navigation space for navigating over
large process model collections and related process
information. They have applied this approach to
complex, real-world automotive process models in an
application called Compass. A controlled user
experiment validated the usefulness of their three-
dimensional approach, which consists of semantic,
geographic, and view dimensions, for navigating
complex process model collections.
While visualizations are being applied to tools and
techniques for process navigation, discovery, and
mining (van der Aalst, 2011), they have yet to be
integrated in any significant way into ERP systems.
In the following pages, we present and evaluate visual
components that take us a step closer to the goal of
improving ERP usability via dynamic, interactive
Evaluating Interactive Visualizations for Supporting Navigation and Exploration in Enterprise Systems
369
visualizations.
3 ARTIFACTS
The two dynamic, interactive visualizations used in
the study described in this paper were the Dynamic
Task Map (DTM) and the Association Map (AM).
The DTM was developed to assist users in ERP
system navigation, while the AM supports data
exploration activities. Both were implemented in D3
(see http://d3js.org). Earlier versions of these
components were presented in Babaian et al., 2015.
3.1 Dynamic Task Map (DTM)
SAP, like other commercial ERP systems, includes a
central menu structure called the SAP Easy Access
Menu (see Figure 1), which is displayed on the
system’s front page. Despite its name, this menu is so
massive and unwieldy that most users tend to avoid
it, preferring to navigate the system by memorizing
transaction codes and entering them directly. The
only way to locate a transaction directly within the
SAP Easy Access Menu is by expanding the menu
branches and browsing the expanded view. SAP has
two separate search functions for finding a
transaction’s code and location within the SAP Easy
Access Menu. These functions, however, are not
integrated with the menu.
Within each transaction screen, there is a separate
menu with related tasks, located on top of the
transaction screen. All aforementioned menus are
fixed, in that they do not change with the use of the
system. SAP also provides a Favorites menu, which
can be configured by the users.
The Dynamic Task Map (DTM) provides an
alternative means for finding a transaction via a
dynamic, interactive visualization of transactions and
the links between them. These transactions and links,
along with their associated properties, are derived
from ERP systems logs.
Each task in the DTM is depicted by a circular,
blue node labelled with the task name, as shown in
Figure 2. The size of each node reflects the frequency
with which that transaction has been performed. In
the top left corner of DTM is a search interface, which
locates transactions by name or by code. The
visualization of all transactions does not display any
links, as the resulting view would be too cluttered to
be useful. Selecting a particular transaction, however,
will cause the display to zoom in and make visible the
links between that task and all transactions that
typically co-occur or follow it, as shown in Figure 3.
These connections are computed dynamically from
SAP’s internal usage logs, thus representing the
actual way people use the system.
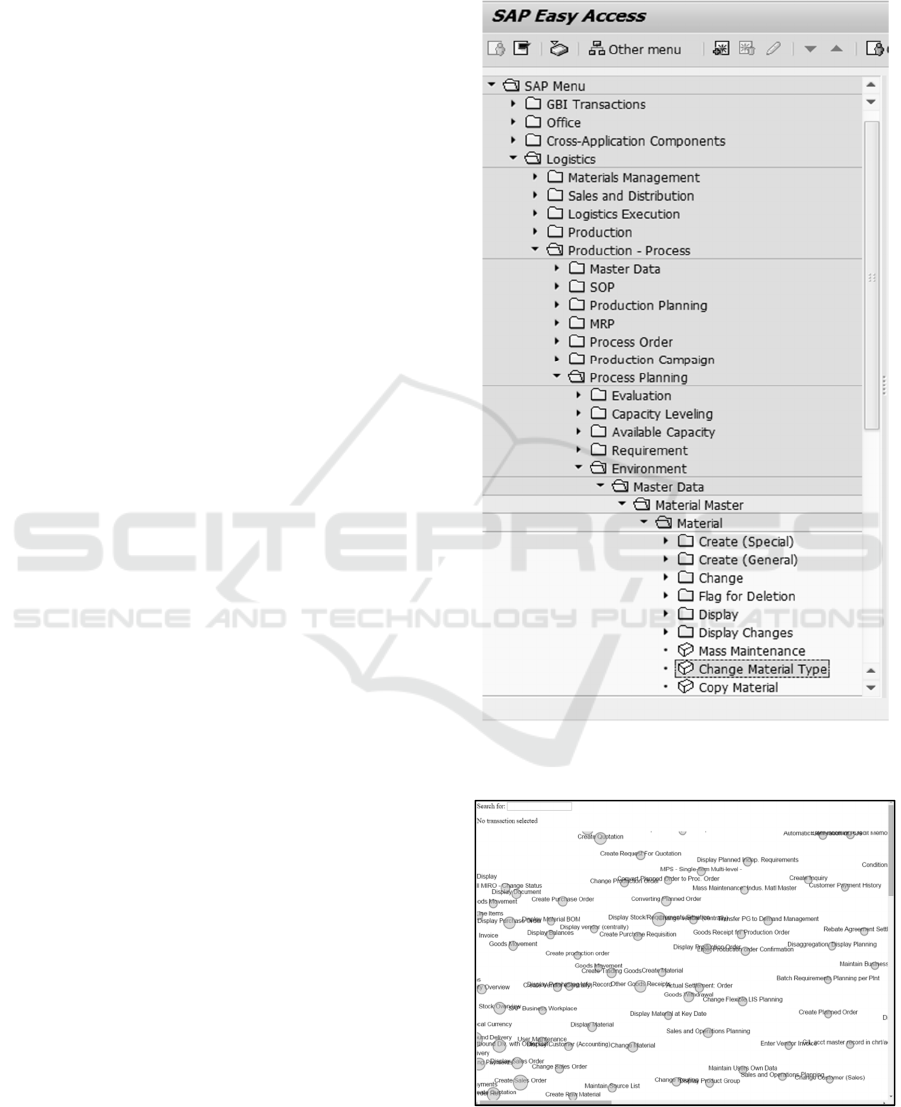
Figure 1: SAP Easy Access Menu expanded to locate the
Change Material Type transaction.
Figure 2: DTM visualization of all transactions. No nodes
are selected. The search box appears in the top left corner.
ICEIS 2016 - 18th International Conference on Enterprise Information Systems
370
To select a transaction in DTM, the user can either
click on the node representing it or type its name
(partial or complete) or transaction code into a search
box. Figure 3 shows what is displayed after the user
has selected the “Change Material” transaction. As
can be seen, the selected node bears a larger label. The
name and transaction code for that node appear at the
top of the visualization.
Transaction codes can also be displayed by
hovering the mouse over a node. Connected
transactions are highlighted in red, with the intensity
of the color reflecting the likelihood of that
transaction following the selected one.
3.2 Association Map (AM)
Discovering relationships between master data
elements in ERP systems can be a challenging
process involving multiple steps. For novice users,
even knowing where to begin can be problematic.
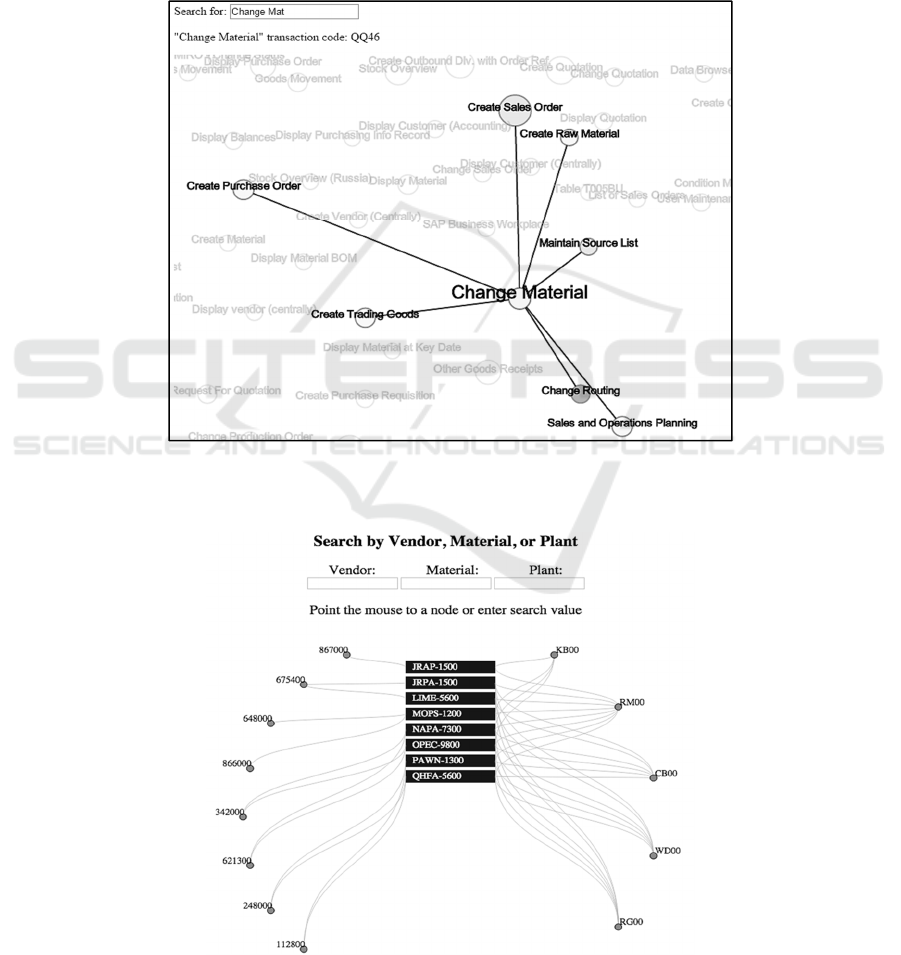
Figure 3: Selected task (in yellow and with larger label) with connected tasks in varying shades of red to reflect frequency
with which they co-occur or follow the selected task. The top left corner contains the search interface, the title, and the code
of the selected transaction.
Figure 4: AM visualization of Vendor-Plant-Material relationships. Links to related entities appear in grey. The search
interface appears at the top of the visualization.
Evaluating Interactive Visualizations for Supporting Navigation and Exploration in Enterprise Systems
371
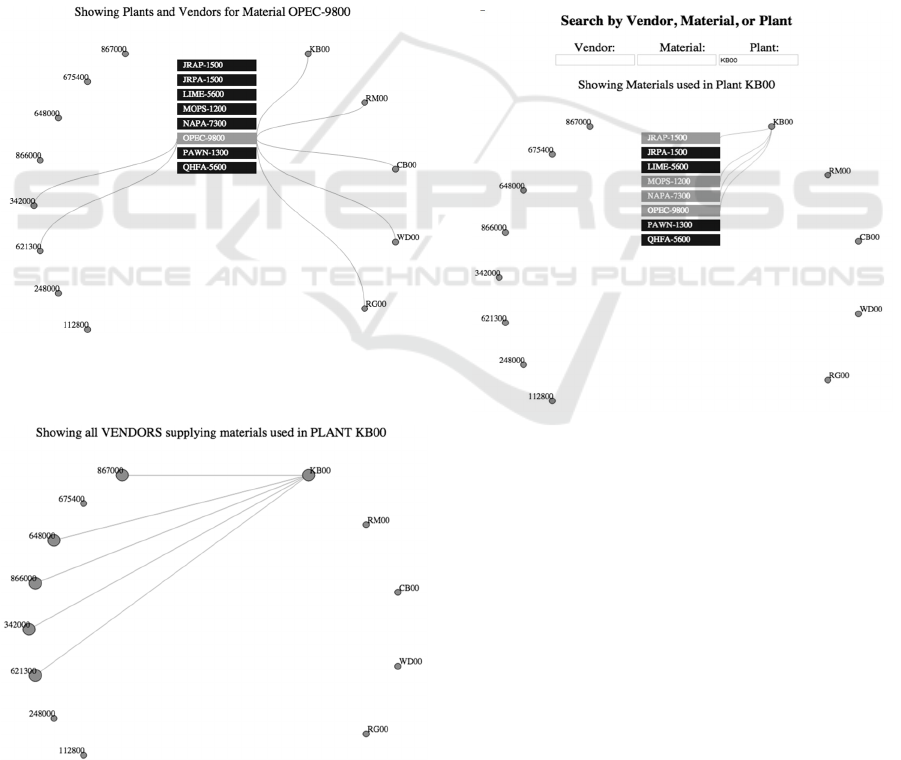
Figure 4 shows the visualization for exploring
relationships between vendors, materials, and plants.
Vendors are represented by blue circular nodes on the
left, plants by green circular nodes on the right, and
materials by brown rectangular nodes in the middle
Once the correct source document has been
identified, extracting and interpreting data from a
report designed to serve multiple purposes presents its
own challenges
The Association Map (AM) was designed to
provide users with an intuitive interface for exploring
many-to-many relationships. It extends the D3
concept map, (http://www.findtheconversation.com/
concept-map) by allowing the user to specify search
parameters of the page. Grey lines connect each
vendor to every material it supplies and each plant to
every material it stores. Each material can be supplied
by multiple vendors and stored in multiple plants.
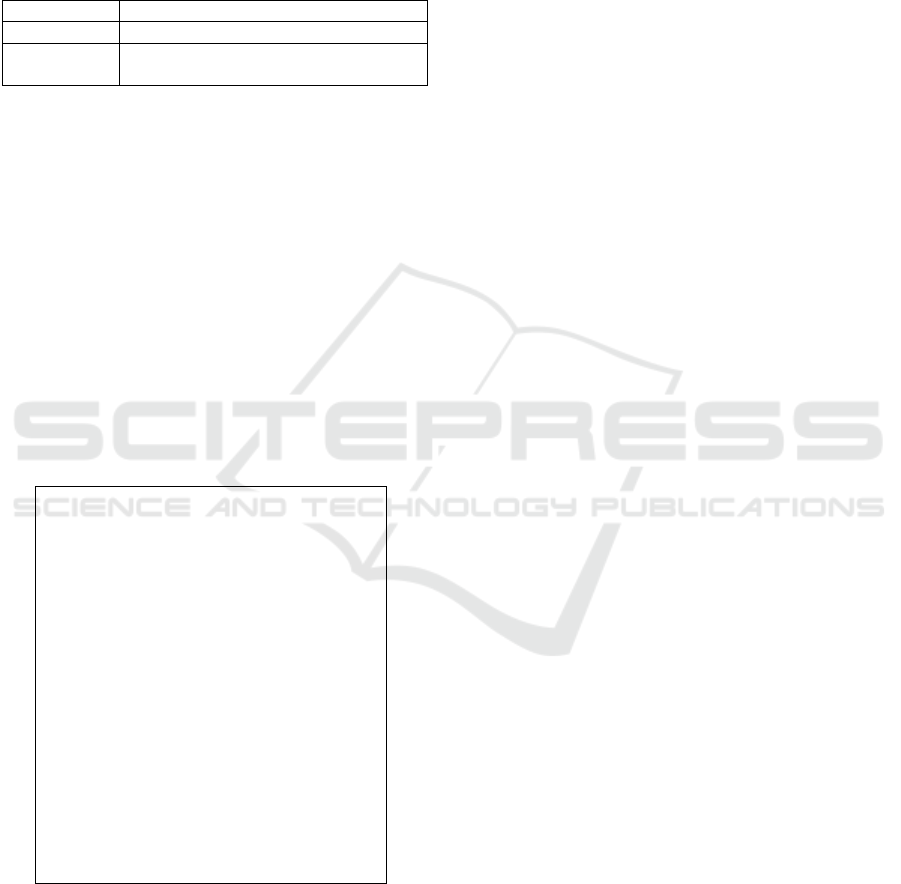
Figure 5: Selection of Material OPEC-9800 from AM
search interface or AM visualization. The selected material
and links from it appear in pink.
Figure 6: Selection of Plant KB00 by pointing at its node in
the AM visualization shows links to vendors supplying
materials used by that plant.
To zoom in on a particular entity, the user can either
point the mouse at the node of interest or enter a
search term. For example, Figure 5 shows the
resulting visualization when the user either points at
the OPEC-9800 material or enters that name in the
Material field of the search interface.
Pointing a mouse at a vendor node will display all
plants using materials from that vendor, while
entering a vendor identifier to the search interface
will show all materials supplied by that vendor.
Similarly, pointing at a plant node will show all
materials stored by that plant, while entering a plant
identifier to the search interface will show all vendors
supplying materials to that plant. Figure 6 shows the
results of pointing at PLANT KB00. Note that the
nodes of vendors supplying materials used by that
plant are enlarged.
Figure 7 shows the display after the user has
specified a search on Plant KB00.
Figure 7: Selection of Plant KB00 from the search interface
shows all materials stored by that plant.
4 USER STUDY
In this section, we describe an experiment comparing
visual interfaces presented in this paper with the
navigation and association support interfaces in SAP.
Comparisons are in terms of user performance and
satisfaction.
4.1 Study Setup
We recruited thirteen study participants from
graduate students in a small business university. All
students were taking a course that involved the use of
ICEIS 2016 - 18th International Conference on Enterprise Information Systems
372
SAP. Of the thirteen, ten completed the study
according to the instructions provided to them. The
three who significantly digressed from the
instructions are not included in the analysis presented
in this paper. A summary of the demographic data for
the ten participants is presented in Table 1.
Table 1: Demographic data.
Gender Female: 3 Male: 7
Age 20-30: 8 > 30: 2
Experience
with SAP
< 2 months: 6
between 2 and 6 months: 4
Our experiment included two independent parts:
the Navigation study and the Association study. Each
of these studies included two component parts, one
involving an interactive visualization and one
involving SAP, as well as a questionnaire (see Figure
8). For each component part, participants were first
shown a two-to-four minute video tutorial
introducing the specific tool that they would be using.
After viewing the tutorial, they were asked to answer
a set of questions, each of which required the
participant to perform a specific task and, at the end
of each task, to enter their answer. The tutorials did
not provide answers to these task questions. Each
study ended with a questionnaire regarding the user’s
perceptions of the interfaces they used in the study
components.
Figure 8: Components of the user study.
As others have done before (Scholtz et al., 2010),
we use a mix of quantitative and qualitative measures
to capture data about the users’ performance and
experience. Correctness of responses and time spent
answering each question are used as proxy measures
for user effectiveness and efficiency with each of the
interfaces (see section 4.2.1). To allow direct
comparison between SAP and the visualizations, the
task questions in both the Navigation and
Associations studies were based on data that was
identical in structure but labelled differently. This
made it impossible for participants to reuse the
answers that they had found earlier.
The Navigation and Association questionnaire
responses, discussed in section 4.2.2, provide a
qualitative assessment of the users’ relative
satisfaction with the interfaces.
4.1.1 Navigation Study
Both the SAP and DTM components of the
Navigation study presented users with five pairs of
questions that required finding and selecting a task
with a specified name, and then finding a task related
(or in the case of DTM, linked) to the previous task,
based on the task name or description. Users were
given an option to write ‘skip’ when they were unable
to find the answer to the question after spending a few
minutes trying. The SAP transaction search
operations as well as the way to look for transactions
and transaction codes in DTM were demonstrated in
the Navigation tutorials (see Figure 7). All
participants had knowledge of the SAP menu gained
in the previous course work.
The DTM for the study was based on the SAP
usage logs from the course in which all participants
were enrolled. The DTM included 180 transactions
and 345 links. The number of different transactions
presented by SAP in a production system is, of
course, much larger than 180, but limiting the size of
the transaction set to a subset of transactions actually
used in an organization is a deliberate part of the
design of the DTM. However, the different sizes of
transaction sets have no bearing on the study results,
as it would be impossible to find the answers to the
task questions we presented in a reasonable time in
either the DTM or SAP without using the search
tools, whose performance is not noticeably affected
by the size of the transaction set.
Finding a task in DTM involved either using the
search interface or clicking directly on a task circle.
To verify that the correct task had been found,
participants had to report the task code that was
revealed when the task was selected. To find a task in
SAP, users had to either locate it in the Menu or use
SAP search transactions (SEARCH_USER_MENU or
SEARCH_SAP_MENU). Similarly to DTM, users had
to report the corresponding task code.
Part 1 -- Navigation study:
1.1 DTM Navigation component
• DTM tutorial (4 min.)
• 10 task questions
1.2 SAP Navigation component
• SAP Navigation tutorial (5.5 min.)
• 10 task questions
1.3 Navigation questionnaire (3 questions)
Part 2 -- Associations study:
2.1 SAP Associations component
• SAP ME1P report tutorial (2.5 min)
• 6 task questions
2.2 AM component
• AM tutorial (2.5 min)
• 6 task questions
2.3 Associations questionnaire (3
questions)
Evaluating Interactive Visualizations for Supporting Navigation and Exploration in Enterprise Systems
373
The transaction names in both the DTM and SAP
tasks were nearly identical, both based on SAP
transaction names. The task codes in DTM were
purposely different from the SAP ones to prevent
users from reusing the codes they discovered in the
SAP part of the Navigation study in their responses in
the DTM part.
4.1.2 Associations Study
The Associations study tasks asked participants to
answer six questions regarding three entities:
Vendors, Materials supplied by Vendors, and Plants
using the Materials. The questions required different
analyses of the data but did not substantially differ in
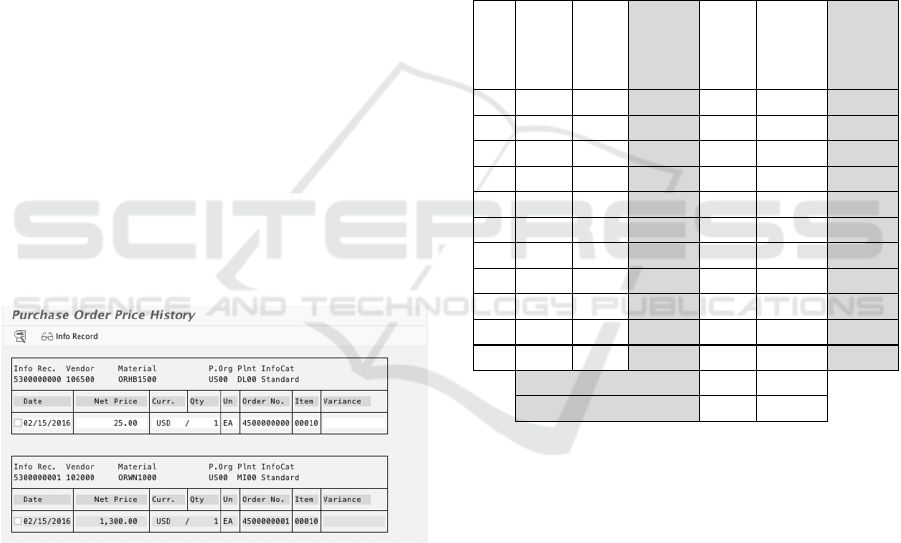
complexity. For evaluation in SAP, we prepared a
variant of the SAP Order Price History report (ME1P),
which summarizes data from purchase orders in a
textual form (see Figure 9). The AM component
visualized the same set of Materials, Plants, and
Vendors as the report but used different names. The
data included eight materials, eight vendors, and five
plants involved in approximately 24 purchasing
records. Each question asked the user to identify and
report a set of items; for example: “List vendor
numbers of all vendors that supply materials that are
used in Plant WD00.” The tutorial for AM
demonstrated basic features of the visualization; the
SAP tutorial briefly described the contents of the
report.
Figure 9: A snapshot of two records in an SAP Purchase
Order Price History Report used for comparison with AM.
To answer task questions using the AM required
that users select an appropriate item via clicking on it
or by entering its name in the search interface and
observing the linked items. The item names were then
entered by the users in the spaces provided for the
answers. To obtain the answers in SAP required
inspecting the entire report, a process that could be
simplified by the use of a selection function, available
via the Ctrl-F keyboard shortcut or by clicking on the
Find icon in the menu.
4.2 Analysis of Results
The analysis of user performance in the Navigation
and Associations studies between SAP and the
visualizations is presented next. The participants’
responses regarding the usefulness of the
visualizations, their preferences regarding the
visualizations versus SAP, and suggested
improvements are discussed in section 4.2.2.
4.2.1 Quantitative Findings
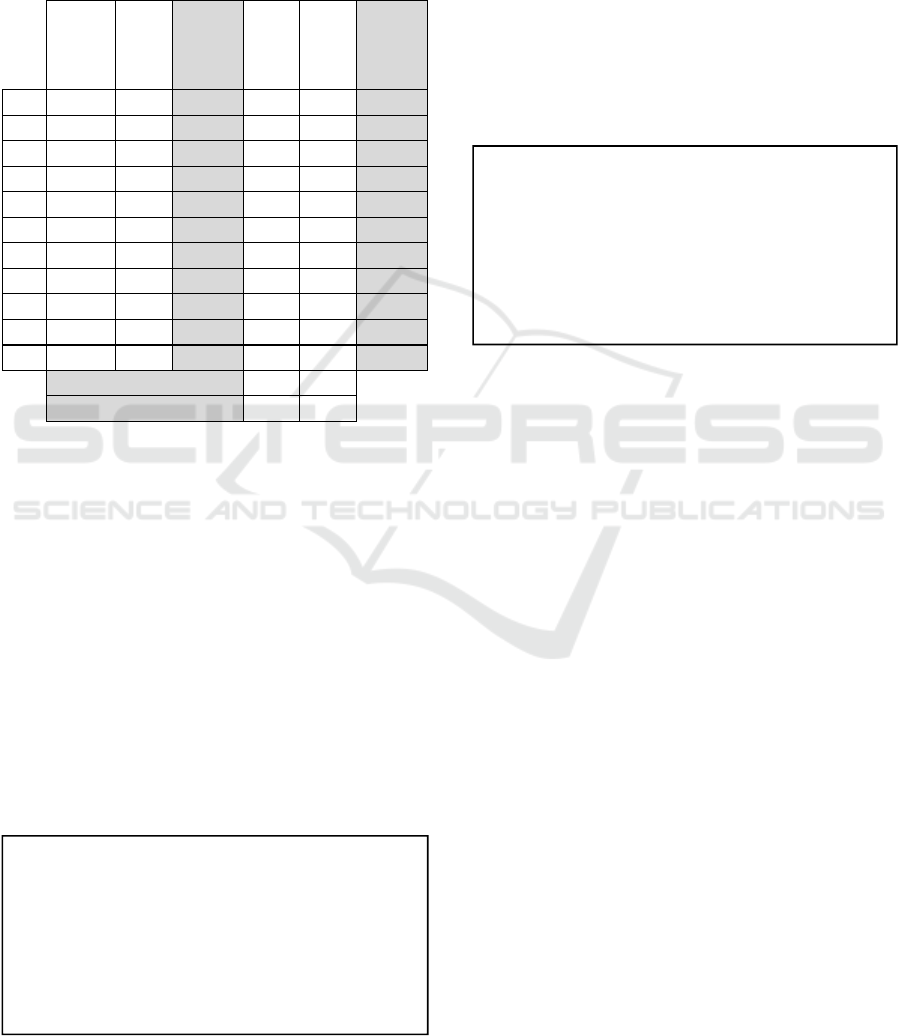
Tables 2 and 3 summarize the results from the
Navigation and Association studies, respectively.
Table 2: Summary of the efficiency and effectiveness
results of the Navigation study.
SAP
Total
Time
(Sec)
DTM
Total
Time
(Sec)
SAP/
DTM
time
ratio
SAP
corr.
out of
10
DTM
corr. out
of 10
SAP/DT
M corr.
ratio
1 579 163 3.6 6 8 0.8
2 544 222 2.5 0 6 -
3 1266 346 3.7 8 10 0.8
4 615 208 3.0 2 10 0.2
5 455 200 2.3 6 10 0.6
6 482 245 2.0 8 10 0.8
7 1104 259 4.3 9 10 0.9
8 533 234 2.3 3 10 0.3
9 705 192 3.7 2 10 0.2
10 579 222 2.6 5 10 0.5
Ave 686 229 3.0 4.90 9.4 0.6
% correct answers
49
94
% perfect answers 0 80
Navigation study were at least twice as fast at
finding transactions in DTM compared to SAP. On
average, the SAP interface required users spend three
times as much time as with DTM. In terms of
correctness, none of the users provided correct
answers to all of the questions in SAP, whereas eight
out of ten participants had perfect responses when
using DTM. Overall, the SAP interface yielded a 49%
correctness rate, versus a 94% rate with DTM. ‘Skip’
answers, indicating the user had given up, are counted
as incorrect here. Out of 51 incorrect answers with
SAP, 29 were ‘skips.’ In the DTM category, there was
one ‘skip’ answer.
As shown in Table 2, all participants in the As
shown in Table 3 for the Associations study, users
came up with answers an average of 2.6 times faster
when using the Association Map. The correctness
achieved with the use of the SAP report was
ICEIS 2016 - 18th International Conference on Enterprise Information Systems
374
approximately 67%, with two people out of 10
providing all correct answers. Using AM, correctness
was 90%, with five out of ten participants entering
perfect answers. There were no ‘skip’ answers with
SAP and one with AM.
Table 3: Summary of the efficiency and effectiveness
results of the Associations study.
SAP
Assoc
Time
(Sec)
AM
Time
(Sec)
SAP/AM
time
ratio
SAP
corr.
out
of 6
AM
corr.
out
of 6
SAP/
AM
corr.
ratio
1 373 240 1.6 5 6 0.8
2 507 191 2.7 3 6 0.5
3 622 293 2.1 6 6 1.0
4 606 78 7.8 4 5 0.8
5 280 175 1.6 1 5 0.2
6 320 90 3.5 5 5 1.0
7 351 150 2.3 6 6 1.0
8 353 206 1.7 2 5 0.4
9 621 428 1.4 3 4 0.8
10 246 193 1.3 5 6 0.8
Ave 428 205 2.6 4.00 5.40 0.7
% correct answers 66.7 90
% perfect answers 20 60
Overall, the results demonstrate that across 20
cases involving 10 users and two different tasks, the
interactive visualizations yielded greater (in 90% of
cases) or equally accurate responses and required less
time than SAP in all cases. The higher number of
‘skip’ responses in the SAP Navigation part indicates
the particular difficulty users experience in locating
transactions with this interface.
4.2.2 Qualitative Findings
After the participants completed the tasks in each of
the two studies, they were asked to respond to a short
questionnaire about their experiences. The three
questions asked after the Navigation study are shown
in Figure 10, while the three asked after the
Associations study are in Figure 11.
Figure 10: Navigation study questionnaire.
Navigation Study: Responses to the navigation
questionnaire revealed that participants were
generally pleased with DTM and typically preferred
it to SAP. In response to Question 1, eight of the 10
participants replied that they would use DTM. The
primary reason given was that it was much easier to
find transaction codes than with SAP because you can
see the connections between transactions.
Participants also commented that DTM is intuitive
and logical. Of the two dissenters, one said s/he would
try it but had difficulty getting overlapping names to
spread out. The other thought s/he would use it at first
but would then likely switch to searching with SAP
once s/he had more experience.
Figure 11: Associations study questionnaire.
In comparing DTM to SAP (Question 2), nine
participants strongly preferred DTM. Comments
included that it was much easier to use, faster for
searching, and more useful and intuitive. The one less
enthusiastic comment was that neither DTM nor SAP
are ideal for searching, but that DTM does provide
better visualizations of steps and how they are
connected.
Participants had many useful suggestions in
response to Question 3, including having DTM
remember and highlight the user’s prior searches,
spreading the transactions out more for easier
reading, and adding logical groupings of nodes (such
as production planning, inventory, etc.).
Associations Study: Responders to the associations
questionnaire were also pleased with AM. In response
to Question 1, the majority of participants
commented on how easy it was to use for finding
associated information. Seven would use AM with no
qualifications given, one would use it but would
prefer an excel report with pivoting, one would
potentially use it, and another expressed concern
about how crowded it might get when used with a full
production system. Other comments included how
well it organizes the information and how it “took
away the tedious scrolling that SAP required.”
The responses to Question 2 were all positive,
with eight participants noting that AM was much
1. Would you use the Dynamic Task Map for navigating to a
desired transaction, if it were embedded within an ERP
interface and if clicking on a transaction circle would open
the transaction? Why or why not?
2. How would you compare the Dynamic Task Map to the
way of finding transactions in SAP in terms of ease of use
and usefulness?
3. Do you have any suggestions for improving the Dynamic
Task Map interface?
1. Would you use the Association Map for answering
questions about plant-material-vendor associations if it
were embedded within an ERP interface? Why or why
not?
2. How would you compare the Association Map to the way
of finding the same information in SAP in terms of ease of
use and usefulness?
3. Do you have any suggestions for improving the
Association Map interface?
Evaluating Interactive Visualizations for Supporting Navigation and Exploration in Enterprise Systems
375

easier to use than SAP, one commenting on how it
saves time, and another on how it is clearer and less
“search-heavy.”
Some of the suggestions in response to Question
3 included preserving the view when the mouse
moves away from an association and making the drill-
down “sticky” so that the user can capture the
information more easily, automatic report
generation/file download from the selected
associations, and improved support for searching over
multiple fields.
5 DISCUSSION
The analysis of the data from this study shows that for
novice users performing common tasks, such as
finding transactions or associations among master
records, interactive visualizations considerably
decreased task completion time and increased
accuracy compared to traditional ERP interfaces.
Notably, participants were introduced to DTM and
AM at the time of the study, while the SAP interface
was already familiar to them through previous
coursework. The users’ greater success rate in our
experiment at completing the tasks with visual
interfaces that were previously unfamiliar to them
suggests that interactive visualizations may enable
novice users to complete more difficult tasks without
the extensive training and experience with the system
that would otherwise have been required.
The qualitative data analysis suggests that even as
users become more experienced with the system, they
may still benefit from interactive visualizations.
Visualizations presented here can incorporate more
advanced options, such as grouping transactions in
DTM together by business function and facilitating
easier data download from AM for report generation.
Such options would improve the fit between the user,
the business needs, and the interface capabilities,
which is an essential element of ERP implementation
success (Hong and Kim, 2002).
The results of the study presented here suggest
that interactive visualizations are one way that ERP
vendors can increase the usability of their products,
which is becoming more and more important in
today’s ERP marketplace (King, 2012). These
visualizations are more intuitive to learn and easier to
use and thus should reduce the need for extensive and
expensive training. The users’ improved perception
of the ERP system and greater confidence in their
ability to perform the necessary tasks with it would
lead to less resistance and increase acceptance of a
newly implemented system. Last, but not least, the
interactive interface would result in productivity
improvements by reducing the time it takes to
complete tasks and improving accuracy. As a result,
the need for re-work and the associated delays would
be minimized.
The main limitation of the study stems from the
fact that our visualizations were implemented as
standalone interfaces, while the SAP interfaces for
the same tasks were embedded in the context of a
larger system. Thus, some inefficiency in performing
tasks with SAP could be due to the users’ attention
being distracted by the numerous features of the
interface. Another limitation is the small number and
the uniform background of the study participants.
Although a larger, more diverse sample population
would provide a more complete assessment of the
benefits of interactive visualizations for different user
groups, our sample is appropriate for an initial
usability study targeted at novice users.
6 CONCLUSIONS
In this paper, we advance ERP usability research by
investigating the use of interactive visualizations for
navigation and association-related tasks in enterprise
systems. Our results showed that novice users
performed those tasks faster and at least as accurately
when using DTM and AM visualizations than when
using SAP. These results empirically corroborate the
view expressed by users in surveys (Lambeck et al.
2014a, 2014b) that useful visualizations decrease the
complexity of ERP interfaces, enabling more
productive use of the system. Users also
overwhelmingly preferred the visual interfaces to the
SAP alternatives.
In future work, we plan to fine-tune and enhance
the existing visualizations based on feedback from the
study. We will use the improved interfaces to
investigate the impact of different features on user
performance and user perceptions in more detail and
with a larger sample population.
REFERENCES
Babaian, T., Lucas, W., Li, M. 2015. Modernizing
exploration and navigation in enterprise systems with
interactive visualizations. Human Interface and the
Management of Information. Information and
Knowledge Design, (HCII 2015), Lecture Notes in
Computer Science, Springer, vol. 9172, 23-33.
Babaian, T., Lucas, W., Xu, J., Topi, H. 2010. Usability
through system-user collaboration: design principles
ICEIS 2016 - 18th International Conference on Enterprise Information Systems
376

for greater ERP usability. In DESRIST'10, the 5th
international conference on Global Perspectives on
Design Science Research, Robert Winter, J. Leon Zhao,
and Stephan Aier (Eds.). Springer-Verlag, Berlin,
Heidelberg, 394-409.
Cooprider, J., Topi, H., Xu, J., Dias, M., Babaian, T., Lucas,
W., 2010. A collaboration model for ERP user-system
interaction. In HICSS’10, the 43rd Hawaii
International Conference on System Sciences, 1-9.
Drobik, A., 2015. IT Market Clock for ERP Platform
Technology, 2015. Gartner.
Ganly, D. , Montgomery, N., 2015. Hype Cycle for ERP,
2015. Gartner.
Hipp, M., Mutschler, B., Reichert, M., 2012. Navigating in
complex business processes. In DEXA’12, the 23rd
International Conference on Database and Expert
Systems Applications, Part II, Springer, 466-480.
Hipp, M., Mutschler, B., Reichert, M., 2014. Navigating in
Process Model Repositories and Enterprise Process
Information. In RCIS’14, the 8th International
Conference on Research Challenges in Information
Science, IEEE, 1-12.
Hong, K. K., & Kim, Y. G., 2002. The critical success
factors for ERP implementation: an organizational fit
perspective. Information & Management, 40(1), 25-40.
Hurtienne, J., Prümper, J. Rötting, M., 2009. When
enterprise resource planning needs software
ergonomics: Some typical scenarios. In IEA’09, the
17th World Congress on Ergonomics
King, R., 2012. SAP Owns Up to Usability Problem. The
Wall Street Journal CIO Report, August 2, 2012.
Krigsman, M., 2010. Understanding Lumber Liquidators'
ERP failure. ZDNet, November 11, 2010.
Lambeck, C., Fohrholtz, C., Leyh, C., Šūpulniece, I.,
Müller, R., 2014a. Commonalities and contrasts: An
investigation of ERP usability in a comparative user
study. In ECIS’14, 22
nd
European Conference on
Information Systems.
Lambeck, C., Muller, R., Fohrholz, C., Leyh, C., 2014b.
(Re-) Evaluating User Interface Aspects in ERP
Systems – An Empirical User Study. In HICSS’14, 47th
Hawaii International Conference on System Sciences,
396-405, IEEE.
Lucas, W., Babaian, T. 2012. Implementing design
principles for collaborative ERP systems.
In DESRIST'12, the 7th international conference on
Design Science Research in Information Systems:
advances in theory and practice, Ken Peffers, Marcus
Rothenberger, and Bill Kuechler (Eds.). Springer-
Verlag, Berlin, Heidelberg, 88-107.
Myers, B., 1994. Challenges of HCI design and
implementation. Interactions, 1(1), 73-83.
Parks, N. E., 2012. Testing & quantifying ERP usability. In
RIIT’12, 1
st
Annual Conference on Research in
Information Technology, 31-36.
Parush, A., Hod, A., & Shtub, A., 2007. Impact of
visualization type and contextual factors on
performance with enterprise resource planning systems.
Computers & Industrial Engineering, 52(1), 133-142.
Pike, W.A., Stasko, J., Chang, R., O'Connell, T.A., 2009.
The science of interaction. Information
Visualization, 8(4), 263-274.
Rettig, C., 2007. The trouble with enterprise software.
Sloan Management Review, 49(1), 21-27.
Scholtz, B., Cilliers, C., Calitz, A., 2010. Qualitative
techniques for evaluating enterprise resource planning
(ERP) user interfaces. In SAICSIT’10, Annual Research
Conference of the South African Institute of Computer
Scientists and Information Technologists, 284-293.
Topi, H., Lucas, W. & Babaian, T. 2005. Identifying
usability issues with an ERP implementation. In
ICEIS’05, 7th International Conference on Enterprise
Information Systems.
van deer Aalst, W.M.P., 2011. Process Mining: Discovery,
Conformance, and Enhancement of Business
Processes. Heidelberg: Springer-Verlag.
Yi, J.S., Kang, A.K., Stasko, J.T., Jacko, J.A., 2007.
Toward a Deeper Understanding of the Role of
Interaction in Information Visualization. In IEEE
Transactions on Visualization and Computer Graphics,
13(6), 1224-1231.
Evaluating Interactive Visualizations for Supporting Navigation and Exploration in Enterprise Systems
377
