
StreetExplorer: Visual Exploration of Feature-based Patterns in Urban
Street Networks
Lin Shao
1
, Sebastian Mittelst
¨
adt
1
, Ran Goldblatt
2
, Itzhak Omer
2
, Peter Bak
3
and Tobias Schreck
4
1
University of Konstanz, Konstanz, Germany
2
Department of Geography and Human Environment, Tel Aviv University, Tel Aviv, Israel
3
IBM Research Lab, Haifa, Israel
4
Graz University of Technology, Graz, Austria
Keywords:
Street Network Visualization, Local Patterns, Urban Planning.
Abstract:
The analysis of street networks is an important problem in applications like city planning, comparison of urban
street properties, or transportation network analysis. Graph-theoretic computation schemes today provide
street network analysts with a range of topological features relating e.g., to connectivity properties of street
networks. Typically, an abundance of different network features is available, and some or all of these features
may be relevant for within- and between comparison tasks at different scales across the network. Therefore,
it is desirable to interactively explore the large segment feature space, with the goal of finding interesting
patterns based on extracted features, taking into account also the geospatial properties of a given network. We
introduce StreetExplorer, an interactive visualization system for the exploration of global and local properties
of urban street networks. The system is based on a set of appropriate similarity functions, which take into
account both topological and geometric features of a street network. Together with a set of suitable interaction
functions that allow the selection of portions of a given street network, we support the analysis and comparison
of street network properties between and across features and areas. We enhance the visual comparison of street
network patterns by a suitable color-mapping and boosting scheme to visualize both the similarity between
street network portions as well as the distribution of network features on the segment level. Together with
experts from the urban morphology analysis domain, we apply our approach to analyze and compare two urban
street networks, identifying patterns of historic development and modern planning approaches, demonstrating
the usefulness of StreetExplorer.
1 INTRODUCTION
The analysis of network-oriented data is a recurring
problem in many data analysis tasks, and to date knowl-
edge discovery and visualization has provided many
successful approaches to study network data. Many
relevant phenomena can be described by network-
oriented data structures, e.g., modeling social networks
in social science, communication networks in data in-
frastructure, or gene regulation networks in bioinfor-
matics applications.
One particular application of network-oriented data
analysis arises in the investigation of street networks in
urban areas as part of geographic data analysis. Street
networks are an integral part of any urban structure, as
they allow flows of traffic and pedestrians to connect
and commute between different parts of the city. In
conjunction with respective features within a city e.g.,
land usage or traffic, street networks may determine
important functional, social and perceptual properties
of urban settlements, such as the efficiency of trans-
portation and space utilization, social residential seg-
regation and wayfinding. Recently, graph-theoretic
methods have become popular to study topological
properties of street networks (see Section 2.1). In prac-
tice, topological measures (also called features) like
connectivity, integration or axiality can be computed
for each street segment of a larger street network. Each
of these features are typically given as real numbers,
indicating e.g., how central a street segment is to the
whole network. Experts are interested in investigating
the properties of street networks, by inspecting the dis-
tribution of the different features across the street net-
work, and correlating them with geometric and other
86
Shao, L., Mittelstädt, S., Goldblatt, R., Omer, I., Bak, P. and Schreck, T.
StreetExplorer: Visual Exploration of Feature-based Patterns in Urban Street Networks.
DOI: 10.5220/0005771800840095
In Proceedings of the 11th Joint Conference on Computer Vision, Imaging and Computer Graphics Theory and Applications (VISIGRAPP 2016) - Volume 2: IVAPP, pages 86-97
ISBN: 978-989-758-175-5
Copyright
c
2016 by SCITEPRESS – Science and Technology Publications, Lda. All rights reserved

properties of the street segments. However, the analy-
sis and comparison of local patterns based on different
street network’s configurational attributes is a common
problem to city planners and geographers. The sim-
ilarity of these local patterns may depend on several
criteria, e.g., extracted features, geometric properties
or provenience, and the identification of outstanding
pattern classes can help to enhance urban designs, city
planning, transit-oriented development, or to study his-
toric developments. For this purpose, it is useful to
investigate meaningful patterns within and between
cities, and apply the conclusions drawn from the anal-
ysis to future urban development.
We have worked with experts from urban morphol-
ogy on the problem of analyzing topological and geo-
metric features occurring in street networks. We iden-
tified the need for exploratory approaches to cope with
the analysis problem, due to several factors, which
make rule-based or purely automatic data analysis not
fully effective. First, computational graph analysis
provides a multitude of different topological features.
Which of the feature is important for the current analy-
sis is, however, not known a priori. Then, by consid-
eration of geometric features, relevant patterns may
occur at different scales with respect to the network,
e.g., a smaller or larger local area may be of interest
for comparison. Both calls for a highly interactive,
exploratory approach to investigate street network fea-
tures since it is not known a priori, which features are
of interest, and at which scales.
We contribute an application for highly interactive
visual exploration and comparison of local patterns
across a network. We apply interactive search and
appropriate visualization for local patterns of street
features for a domain expert to investigate his data col-
lection. At the heart of our approach is a flexible search
function, by which the expert can quickly indicate for a
specific network feature the regions of interest. We de-
fine a suitable similarity function to rank and compare
street network properties, taking into account topolog-
ical features, but also spatial properties of the network.
We introduce a suitable color-mapping and boosting
scheme, which allows visualizing local similarity to
a user query in context of the overall feature distri-
bution. It allows the user to quickly verify different
hypothesis regarding to recurrent patterns, and arrive
at meaningful findings on a given street network.
The remainder of this paper is structured as fol-
lows. In Section 2, we recall related work on analysis
of urban street networks, pattern analysis in graph data,
and on visualization of spatial data. In Section 3, we
introduce the basic idea of our approach, based on two
modes of query specification and result visualization.
Then, in Section 4 we describe in detail our search
methods and the similarity function behind the search.
Further, in Section 5, we demonstrate the effectiveness
of StreetExplorer by a use case application on a real
street network analysis, conducted together with our
co-author domain experts. We also provide a discus-
sion of advantages and limitations of our approach.
Finally, Section 6 concludes.
2 RELATED WORK
We discuss related work in street network analysis,
pattern extraction and visualization, and spatial visual-
ization.
2.1 Analysis of Urban Street Networks
Street network patterns are a dominant component of
a city’s spatial properties. They have been shown to be
significant for human spatial behavior, such as trans-
portation mobility and accessibility (Marshall, 2004)
and vitality of urban life (Wheeler, 2008). Urban street
networks have been investigated with respect to their
geometric and configurational attributes (e.g., number
of intersections, number and size of blocks, connec-
tivity, integration, fragmentation, etc.), their dynam-
ics as well as their relations with other morphologi-
cal components such as buildings, lots and the like.
Space syntax is currently the dominant theoretical and
methodological approach, which is based on config-
urational attributes of urban street networks (Hillier,
2002; Hillier, 2007). This approach concentrates on
the integration between urban streets (or places) and
their relative accessibility and centrality in terms of
intermediacy (Kropf, 2009). These configurational as-
pects have been found to be reliable indicators for pur-
poses of comparison between street patterns (Hillier,
2002; Vaughan et al., 2010) and for distinguishing
street pattern development, e.g., self-organized ver-
sus planned-cities ((Porta et al., 2006; Jiang, 2007)).
This body of research has produced classifications of
these patterns according to the spatial configuration
attributes of street network.
The space syntax attributes, which are based on
axial maps, i.e., the smallest set of direct axial lines
map of each investigated city (Hillier, 2002; Hillier,
2007), represent several aspects of accessibility and
centrality at different scales that can be used for a
classification of street networks. However, due to the
multidimensional character of street networks’ spa-
tial configuration, the identification and classification
of street patterns in urban areas is not a simple task.
Space syntax studies have shown that street patterns
can be identified by measuring axial lines or segments
StreetExplorer: Visual Exploration of Feature-based Patterns in Urban Street Networks
87

through a presentation of geographic distribution of
spatial configuration attributes at different geographic
scales. Such presentation can support the definition
of spatial pattern patches in the street network at dif-
ferent scale in terms of their internal structure, con-
textual structure and relations between the two (Yang
and Hillier, 2007). Such task requires interactive and
complex actions by experts in the field of urban mor-
phology.
2.2 Pattern Analysis in Graph Data
In graph and network analysis, similar to street net-
work analysis, experts are interested in recognizing
local patterns or subgraphs containing meaningful and
relevant information. Since both research areas are
highly connected they also share similar approaches
to address related challenges. (Yang et al., 2014; Tian
et al., 2012) use graph based approaches to identify
significant patterns in street networks. Street networks
were represented as graphs, whereas streets are con-
sidered as edges and road junction as nodes. A large
body of previous work addresses the visual analysis of
graphs by search-based pattern exploration, of which
we here can only give a small, illustrative sample. In
(von Landesberger et al., 2009) a visual analysis sys-
tem was introduced, which automatically identifies
common graph patterns (motifs) that are used as basis
for navigation and exploration in graph data. In (Yan
et al., 2006), a graph-substructure similarity search
based on graph features was discussed. One key as-
pect of graph analysis is the representation of patterns
in a suitable manner. (Dunne and Shneiderman, 2013)
introduced a motif simplification technique, in which
common patterns are replaced by meaningful glyphs.
More generally, a survey of methods for visual anal-
ysis of graphs is given by (von Landesberger et al.,
2011).
2.3 Visualizations of Spatial and
Movement Data
Many useful visualizations to date support interactive
analysis of geospatial and movement data, of which
we again can only give a small overview here. An
encompassing overview of visual analytics approaches
and tools for movement data is covered by (Andrienko
et al., 2013). (Bak et al., 2010) introduced an ap-
proach for joint visual analysis of urban land usage
and street network properties based on visual cluster
analysis. In (Chu et al., 2014; Ferreira et al., 2013)
mobility patterns of taxi movements were investigated
by extracting geographical information and using vi-
sualization techniques. Recent work in street network
analysis (Wang et al., 2013) uses taxi GPS data to com-
pute traffic flow rates and estimate traffic jams in the
city. A visual analysis tool for support of urban space
and place decision-making processes was developed in
(Pettit et al., 2012), relying on visualization techniques
including time cubes, heat maps, and choropleth maps.
We build on these works for visualization of net-
work and spatial data, contributing an approach for the
explorative analysis of street network features based on
adaptive selection-based search over geographic and
topological properties of the street network, including
appropriate data visualization.
3 OVERVIEW OF OUR
APPROACH
The aim of StreetExplorer
1
is to support street network
analysts during their investigation by supporting inter-
active search for similarities within the network, giving
rise to potentially interesting local patterns. We rely on
a wealth of currently existing computational methods
for topological street network features, which we help
to explore and understand by means of a search-based
visual analysis system.
The exploration design of StreetExplorer is based
on a two-step comparison approach that enables an
investigation of street patterns on the global and local
scale within and between urban networks. The design
is depicted in Figure 2. We adhere to Shneiderman’s
Information Visualization Mantra - Overview First,
Zoom and Filter, Details on Demand (Shneiderman,
1996) and propose to start the analysis session with
a global overview comparison of features in a given
network (shown in Figure 1). By means of our small
multiple view, analysts may recognize feature similari-
ties, dependencies or correlations that help to find an
interesting feature for further investigation.
We start the exploration by applying a global com-
parison of all available network features, to find a start-
ing point for the exploration, and to identify interesting
local patterns from a large number of pre-computed
features. All available features are given by a list view
to select from in the left hand side of Figure 1. This
view displays all features in a hierarchical structure
based on the street-networks’ configurational attributes
and resolution levels. Thus, features containing a high
number of resolutions will be aggregated in the list and
provide a better overview than a plain list. From this
list, several features may be chosen and visualized in a
small multiple view that represents the feature values
1
A demonstration of StreetExplorer can be found at:
https://vimeo.com/149003539
IVAPP 2016 - International Conference on Information Visualization Theory and Applications
88
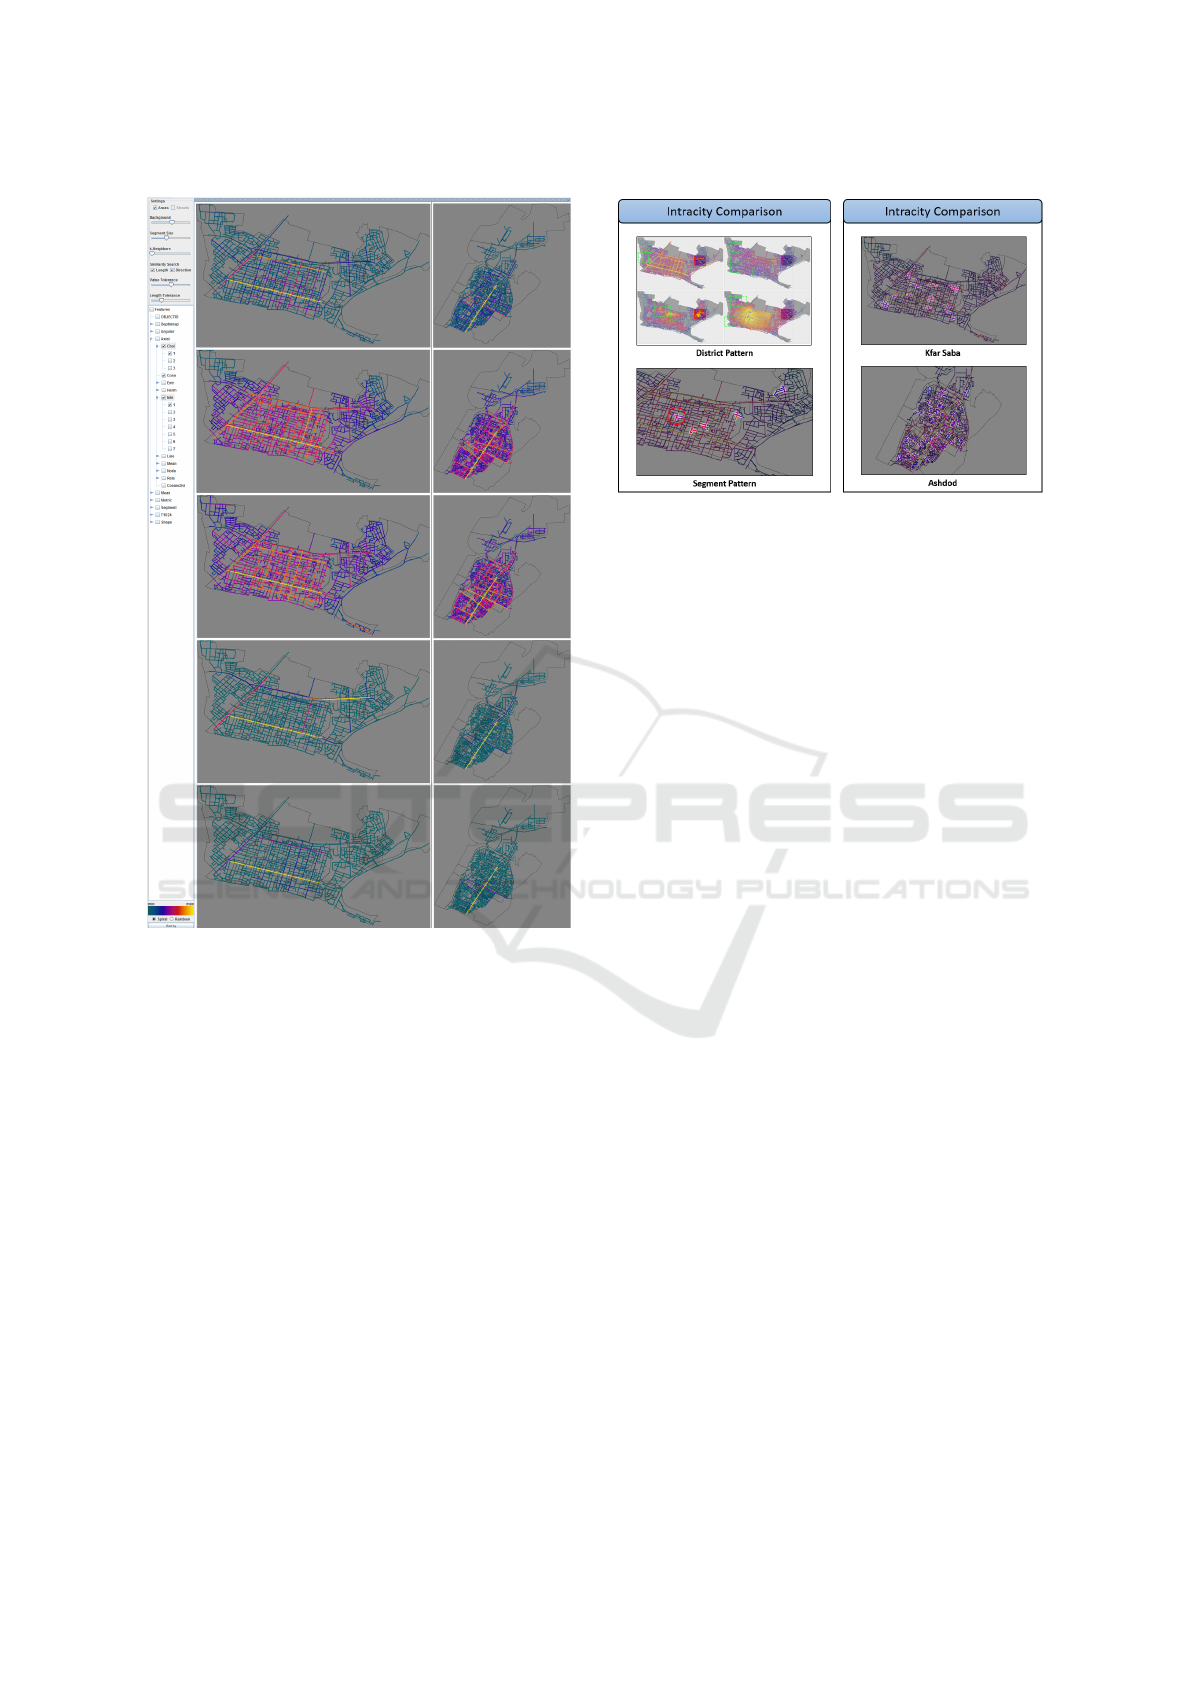
Figure 1: Feature exploration in StreetExplorer to compare
space syntax configurational attributes of two cities, namely
Kfar Saba and Ashdod. The system creates a small multiple
view of all selected features for comparison and further in-
depth investigation for similarity in the street-network.
by their original proportion of the city’s street network.
This allows for global comparison of the features. To
support the global comparison, the features (or maps)
can also be sorted according to the similarity of a se-
lected one, by means of the below discussed similarity
function (Section 4).
As a next step, the analyst could apply zooming
and panning interactions to explore the features for
interesting local patterns. To find locally interesting
patterns, we support the query formulation by two
selection-based methods, which are depicted on the
left of Figure 2. The definition of query patterns can
also directly be performed on the map by selecting cer-
tain street segments. Thereby, the analyst may define
patterns of interest, which are composed of geomet-
rical, topological and connectivity information of the
individually chosen segments. The similarity search
Figure 2: Our proposed procedure to analyze street network
patterns. The exploration starts with an interactive compar-
ison of local patterns for a selected feature. This can be
done by a district search or a user-defined search based on
the segment level. Matching results will be highlighted on
the map, and thus provide an overview of the availability,
frequency and distribution of feature-based patterns. After
interesting patterns were found, the analysis can be expanded
to compare among several cities.
occurs interactively and the best matching results will
be directly highlighted on the map.
Finally, after some interesting local patterns have
been identified for a given street network, the analysis
may continue by comparing the found pattern across
different features and possibly, also across networks
of different cities (depicted on the right of Figure 2).
4 EXPLORATION OF STREET
NETWORK PATTERNS
We describe the similarity functions of StreetExplorer
as an important part of our supported exploration ap-
proach outlined in Figure 2. Further, we discuss novel
colormapping techniques to enhance the readability of
topological features in street networks and to support
interactive highlighting.
4.1 Comparison of District Patterns
StreetExplorer enables the search and comparison of
feature similarities on the global and local scale within
and between street networks. In case these proper-
ties cannot be seen at first sight, the interactive search
methods of StreetExplorer can be utilized to explore
the street network for locally interesting properties.
We support the small multiple view by a concurrent
search, meaning that a given query is run against all
maps currently shown in the small multiple view, and
matches are highlighted on all features maps at the
StreetExplorer: Visual Exploration of Feature-based Patterns in Urban Street Networks
89

same time. To this end, we provide two local search
functions for street network patterns. The first search
function is a district comparison, which identifies sim-
ilar regions based on user-defined districts. Analysts
may define a rectangular region by using a rubber band
selection and detect similar districts based on geomet-
ric properties and feature values of the particular street
segments. This is particularly suited if analysts want
to approximately compare an area of interest e.g., east
or west peripheral area of a city. The technique we
use to compute similarity between districts in a street
network is adapted from image retrieval (Liu et al.,
2007) and relies on the distribution of feature values
as a basis for the similarity function.
In our approach, we use an equal-width histogram
of all street segment features within the given selection.
The histogram is normalized according to our color-
mapping scheme (see Figure 3 and Section 4.3). The
bin size configuration is an ill-defined problem, which
depends on the data set. This configuration can be
adjusted by the analyst himself, but to achieve similar
areas in accordance with the visual perception of the
color-mapping, we suggest a minimum bin size that
contains a stable color interval and covers all feature
values that are visually in the same range. We figured
out that the good results were achieved by using a
histogram with 10 bins (one bin for each color) that
contain further 10 interpolated hues, as demonstrated
in Figure 3. Consequently, the histogram comprises
in total a range of 100 units in the normalized feature
interval between
[0, 1]
. We then store the length of
all segments lying in the query district to the corre-
sponding histogram bins and iterate the search over
the entire map using a sliding window approach to
find the most similar regions. The sliding window
approach is a method that sequentially compares lo-
cal regions for similarity search. In this approach, a
street network is divided into a two-dimensional grid
and the similarity search is performed in each window.
Consequently, the histogram will take all intersecting
segments into account and is weighted by the length
of street segments. To assess the district similarity,
we divide the street network into a uniform-sized grid
and translate the rectangular district box over the grid
including overlapping areas. For each iteration, a new
histogram is computed and compared with the query
district by the Euclidean distance. Due to the complex
problem of scaling, the grid size can be interactively
adjusted by the user, but at this point we would like
to point out that a too small grid could cause many
matching results at the same region (slightly shifted)
and a too coarse grid could lead to missing associa-
tions. By default, the grid size will automatically be
determined according to the query size, e.g., a smaller
Figure 3: Illustration of our histogram approach to compute
district similarity. The histogram contains 10 bins that cover
further 10 interpolated hues according to a spiral colormap.
Street networks are partitioned into a regular grid and a
sliding window approach iterates the search through the
grid.
query district will also produce a smaller grid size.
The grid size corresponds to a quarter of the original
query size, and thus enables an overlapping degree of
a half width and length. In the end, the regions with
the most similar histograms will be emphasized on the
map, as shown in Figure 2 (District Pattern).
4.2 Comparison of Segment Patterns
To find more fine grained street patterns the second
local search function of StreetExplorer can be used,
which is shown in the lower left corner of Figure 2
(segment pattern). It takes the connectivity as well as
the length, direction and feature value of individual
street segments into account. To distinguish the main
segment orientations our domain experts defined 8
types of directions as shown in Figure 4 (a). Segments
are considered as similar if they possess approximately
equal direction, and are within a tolerance margin of
length and feature value. This ensures that similar
street patterns also consist of approximately the same
segments irrespective of connection. Furthermore, we
propose two different selection-based approaches to
specify the neighborhood of a given segment and form
a pattern.
The first selection is defined by a connected k-hop
clustering, which uses a selected segment as cluster-
head and groups several neighbors as members based
on the hop distance. For instance, a 1-hop street pattern
consists of one segment (clusterhead) and connected
segments, in which the distance between the cluster-
head and its members is 1 hop (junction). For better
performance, we pre-calculated all segment connec-
tions in advance. An illustration of our k-hop selection
is shown in Figure 4 (b). The orange marked segment
denotes the selected segment, whereas the blue and
IVAPP 2016 - International Conference on Information Visualization Theory and Applications
90

(a) Direction types. (b) Illustration of k-hop.
Figure 4: Illustration of our similarity properties for search-
ing k-hop based patterns. (a) shows the eight different di-
rection types; (b) illustrates the members of a street pattern
based on 2-hops (blue and green segments).
green ones are the members that are reachable by a
path of one and two hops respectively. By means of
this selection approach a street pattern can easily be en-
larged by increasing the number of k (shown in Figure
7 (a) - (c)). In this approach, the selection of the first
segment is crucial since it builds the basis of the street
patterns and initializes the similarity search based on
its neighborhood. After a street segment has been
defined as core segment (clusterhead), a single seg-
ment search over all target segments takes place, and
computes an overall similarity score for its connected
neighbors. Consequently, the analyst can quickly in-
vestigate similar local areas of a street network by
changing the clusterhead segment. Since street pat-
terns may have different neighborhood sizes, we com-
pute a similarity score by comparing the average of
feature value and the segment length of all segments
that belong to one street pattern. Equation 1 shows
the computation of the weighted average feature value
where
n
is the number of neighboring segments of one
street pattern. Accordingly, we determine the distance
of the query to the target street patterns
(Feature
avg
)
and eliminate those patterns, which exceed a certain
threshold. Analysts may determine k for the neighbor-
hood size as well as the tolerance margin for segment
length and feature value to steer the analysis process.
Feature
avg
=
∑
n
i=1
SegmentLength
i
× FeatureValue
i
∑
n
i=1
SegmentLength
i
(1)
Alternatively, the analyst can also switch to a free-
form selection in order to define an interesting pattern.
By means of this selection approach, the analysts are
able to specify even more accurate street patterns by
selecting individual segments. In this way, it is possi-
ble to form complex street patterns that contain, e.g.,
stringy, circular or chain-like structures. The basic
similarity search step is applied for each added seg-
ment and a connectivity comparison verifies whether
the matched segments are connected correctly or not.
Beginning from the first segment, the connectivity
comparison stores the connection of each new added
segment and observes the connectivity of query and
Figure 5: Demonstration of our segment connectivity com-
parison for searching individual segment patterns. The color
coding indicates the order of selected / matched segments.
Based on the ancestor connection property, the search is
invariant against pattern transformations.
target patterns in real time. Figure 5 demonstrates an
example with four correct and one incorrect connected
patterns referring to the query instance. After each new
added segment, query and target patterns are compared
for structural similarity of their neighboring segments.
This means that every potentially similar segment is
required to have an identical connected ancestors, oth-
erwise it will be eliminated from the result set. For
instance, all four correct target patterns in 5 have an
equal connection to their ancestor segments (segment
1 is connected to segment 2 and segment 2 is again
connected to segment 3), and thus are considered as
similar. The problem with the negative example is
that the last added segment (segment 3) is connected
to both ancestor segments (segment 1 and segment
2), and are thus considered as dissimilar. To this end,
our approach is invariant to rotation and allows slight
variations of target patterns.
These local search functions can also be applied
for intercity comparison. Basically, the search tech-
niques and interaction possibilities for this application
are the same as for intracity comparison. The only dif-
ference is that additional street networks are displayed
in separate small multiple views and can include in-
dividual features (see Figure 1). In this case, it might
be beneficial to compare local patterns in different
street networks (cities / features), which the analysts
have considered as interesting. Hence, we designed a
portable pattern search that can easily transfer street
patterns (queries) of one city to another city. Accord-
ingly, it enables additional comparison tasks and can
reveal interesting findings, e.g., searching for certain
patterns in all street networks; or comparison for spa-
tially similar located patterns (northern part of the city
or downtown); or searching for similar kinds of roads
(main streets).
4.3 Visual Boosting
The visualization and selection of segments can be
StreetExplorer: Visual Exploration of Feature-based Patterns in Urban Street Networks
91

(a) Without any boosting schemes. (b) With visual attention boosting. (c) With color contrast boosting.
Figure 6: Demonstration of our visual boosting approach on the street network of Kfar Saba. To enhance visual perception of
local patterns, we used a spiral colormap to show the feature values of street segments (a); reduced the saliency of unselected
segments (b) and adapted the border color of located street patterns (c).
perceptually supported by novel colormapping and
visual boosting approaches that we discuss in the fol-
lowing.
Colormapping.
(Mittelst
¨
adt et al., 2015) provide
state-of-the-art guidelines and the tool ColorCAT to
design colormaps for combined analysis tasks. In our
application, the color encoded features are continuous
and their interpretation requires the identification and
comparison of metric quantities. We use ColorCAT to
design our color encoding (see Figure 3) for our ap-
plication. The number of distinct colors is maximized
for accurate identification of color values (Ware, 1988;
Kindlmann et al., 2002;
?
) and the perceptual linearity
is preserved by linear increasing intensity, which is
required for comparing color encoded data.
Boosting with Color Contrasts.
If many streets are
sharing dense areas of the display, it is hard for the
user to perceive single streets. Studies showed that the
visibility of low contrasts is reduced in high spatial
frequency areas of the display (Barten, 1999). The
method of Mittelst
¨
adt et al. (Mittelst
¨
adt et al., 2014)
compensates for harmful contrast effects in order to
accurately visualize color encoded data. The method
applies a perception model (Fairchild and Johnson,
2004) in order to estimate the bias of contrast effects,
which are amplified in the cones of our eye. With this
approach it is possible to approximate a color
c
0
that
is in maximum color contrast to a target color
c
with
c
0
x
= D65
x
− c
x
(with
x
being the LMS channel in the
CAT02 color space and
D65
is the standardized refer-
ence light). Note, that this is only valid for saturated
colors with one of the channels being close to zero. In
order to visually boost the readability of streets in our
visualization, we draw borders around the segments of
streets. These borders are encolored with maximum
color contrast to the segment color, which accords
to boosting with color (Oelke et al., 2011). Further,
we enable the user to control the segment and border
sizes which enhances readability. On the one hand,
these contrast effects can bias the user in reading color
encoded features if the task is focused on a detailed
analysis of specific (zoomed-in) data objects. On the
other hand, this approach enhances the perception and
recognition of streets in overviews, which enables us
to read features even for dense areas on the screen.
Therefore, we recommend the approach for tasks that
require overviews of high frequency data. Further, this
approach can be applied to highlight segments and
street patterns (see Figure 7).
Boosting with Visual Attention.
The most common
reason to highlight visual elements with color is to
attract visual attention. Studies of (Camg
¨
oz et al.,
2004) show that humans are predominantly attracted
by bright and saturated colors. Since we use both
to visualize metric quantities and want to accurately
encode the elements in the selection, we reduce the
visual saliency for unselected elements. We argue
that these segments are still important for the context
information of the selection but they need not to be
visualized as prominently as the selected elements.
Therefore, we reduce the intensity and saturation of
these segments (we set both to 50% of the original
color in the HSI color space (Keim, 2000)). To further
decrease the visual saliency, we use the borders of
unselected elements and decrease the contrast to the
segment as well to the background by selecting the
same color for the border but adjust the lightness and
saturation of the border color to
50%
of the original
color. The low brightness and color contrasts reduce
the visual saliency of unselected elements and steer
our attention towards the selection.
Visual Boosting Effect.
Figure 6 demonstrates the
effect of our visual boosting approach. First, a spi-
ral colormap is applied to visualize the continuous
feature values of each street segment in the entire
city (a). The colormap ranges from green/blue (low
values), through purple/red to orange/yellow (high val-
ues). Consequently, analysts can easily detect streets
with high feature values or areas including low feature
values. Second, we reduced the visual saliency of in-
IVAPP 2016 - International Conference on Information Visualization Theory and Applications
92

considerable street segments and thus, highlight local
patterns resulting from similarity search (b). However,
one remaining challenge is to perceive the patterns and
their feature values, in particular in the case of rapid
changes during the exploration. To tackle this issue,
we finally support the highlighting by increasing the
segment size and adapting the border color of detected
local patterns (c). By default, the segment sizes are
adjusted to the global street network view (without
zoom level). We suggest to increase the segment size
when focusing the analysis on a local area (with higher
zoom level) to maintain the colors and feature values
of the particular street patterns.
We designed two search functions to investigate lo-
cal similarities in street network features. Analysts are
able to define local patterns based on geometrical fea-
tures (length, direction and composition) and analyze
the characteristics on topological features (angularity,
axiality or connectivity), which is applied in Section 5.
Feature values will be presented by our color-mapping
and help together with our boosting scheme to reveal
the similarity of discovered patterns. The search can
be used within one chosen feature to detect similar
street patterns, or over several features to identify the
distributions of patterns based on different topological
features. An analysis without network connectivity
constraints is also possible and can be achieved by
using the district search. Another possibility would be
to analyze the pattern without the influence of topolog-
ical features, which corresponds to a basic subgraph
search in network data.
5 CASE STUDY
In the previous section, we introduced the StreetEx-
plorer system for search-based exploration of feature
properties of urban street networks. We have worked
closely with urban modeling experts from a university
to use our system, and will describe the findings next.
The expertise of the users reaches back two decades
in research and consulting for urban planing and mod-
eling, progressing the state-of-the-art in the domain
significantly. Relevant application and research fields
of the experts include defining effect of land-use types
on ethnic residential integration, commercialization
developments of urban neighborhoods, and predicting
street segments’ pedestrian friendliness and walkabil-
ity. Understanding and analyzing the topology and
configurational attributes of street networks are indis-
pensable to these research and application domains.
5.1 Features Exploration
The network data, together with topological features
from street-networks’ configurational attributes has
been provided to us in standardized shape files. The
investigation was carried out by the experts and as-
sisted by the developers. Measurement of space syntax
configurational attributes is based on topological anal-
ysis of axial maps that treats individual axial lines (see
Section 2.1) as nodes and axial line intersections as
edges of a connectivity graph. The resulting graph
provides the basis for several space syntax measures
that describe the centrality of individual axial lines.
In the current study, we have used the following mea-
sures: Connectivity, Local Integration, Global Inte-
gration, Local Choice and Global Choice. For any
particular axial line, Connectivity denotes the number
of directly linked axial lines. Global Integration indi-
cates the closeness of an axial line to all other axial
lines in the system by computing the shortest distance
(or step depth) of the respective line from every axial
line in the entire urban area. The Local Integration
limits this computation to a certain neighborhood size,
which is limited by a defined number of directional
changes. Against to the above to-movement measures
that represent the accessibility of a given axial line, the
measures of Global Choice (which is equivalent to the
graph-based centrality measures of betweenness) and
Local Choice are through-movement measures. These
measures indicate the number of times a location is
encountered on a path from origin to destination for
all pairs of axial lines in the entire urban area (global
choice) or up to a defined topological distance (local
choice).
In this study we chose to investigate two cities -
Kfar Saba and Ashdod - which are representative of
the street patterns of Israeli urban space (Omer and
Zafrir-Reuven, 2010). We started our investigation
by selecting the five space syntax measures, as de-
scribed before, in order to reveal the global and local
similarity between these cities. Results for the two
cities are shown in a small multiple view (Figure 1) for
comparison. This representation clearly reflects the
configurational differences between the cities, which
has historical, developmental and topological reasons.
Kfar Saba is a city with a nearly orthogonal street pat-
tern that was established in the beginning of the 20th
century and has developed mostly according to the
pre-modern planning approach. In contrast, Ashdod
is a relatively new city that was established in 1957
according to a comprehensive city plan based on mod-
ern planning approach. The city is characterized by
a tree-like street layout associated with the idea of
neighborhood units. These differences between these
StreetExplorer: Visual Exploration of Feature-based Patterns in Urban Street Networks
93

planning approaches and the associated street patterns
are similar to other western cities (e.g. (Marshall,
2004)).
Data on the cities’ street networks were obtained
as GIS layers for the year 2012 from MAPA company
(http://www.gisrael.co.il). The Depthmap software
((Turner, 2001)) was used for constructing and analyz-
ing the axial and segment maps and for computation
of space syntax measures.
5.2 Interactive Search and Findings
We started our investigation with comparing similar
local areas by using our district comparison tool. We
realized very quickly that the distribution of similar
local areas vary at most during the exploration of the
feature Local Integration (second row of Figure 1) and
decided to use this feature for further investigation.
Moreover, previous research indicates that this mea-
sure best distinguished cities from each other (Omer
and Zafrir-Reuven, 2010) and represent most effec-
tively the differences in street patterns. Local integra-
tion measure describes integration only up to a defined
number of changes of direction (topological distance),
which is usually equal to three. The use of segments
(the lines between junctions of axial lines) enables net-
work analysis on a finer scale than using axial lines, it
also extends with a consideration of angular distance
(least angle distance) and metric distance that might
be relevant to the purpose of investigation.
Our StreetExplorer implementation provided rapid
response to a series of interactive queries we con-
ducted, iteratively switching between selections of
different segments in the overall street network, to find
interesting repetitive structures in the map. We have
been mainly focusing on areas that were established ac-
cording to the modern planning approach. After a few
trials, we selected one segment in the peripheral area
of Kfar Saba (Figure 7) and in Ashdod (Figure 8). As a
result, StreetExplorer highlighted all similar segments
in the entire street-network for further investigation.
Similar segments were found only on new areas that
were developed in the second half of the 20th century:
in the west and east peripheral areas of Kfar Saba,
and almost in the entire area of Ashdod. We then in-
creased the neighborhood level in a step-wise manner
from no neighborhood (single segments are compared)
to second and forth degrees of neighborhood (k-hop)
included in the similarity function.
As shown in Figures 7 and 8, the geographic dis-
tributions of similar patterns in both cities remained
stable and increased consistently across the neighbor-
hood level. Even though, when neighborhood size
increases, some of the smaller patters that were close
by, merge to larger ones, but some of them drop out, as
their similarity falls below the defined threshold. This
means, that by selecting the neighborhood size, the
user in StreetExplorer can interactively determine the
size of the pattern of interest and get immediate visual
feedback on the search results.
In the latter query modality, the users selects only a
single query segment, and the system increases the
neighborhood size resolution along connected seg-
ments, thereby providing several query alternatives
with different size. We note that the geometric simi-
larity of the matches to the queries (perceived mainly
by segment length and direction) is more prominent
when the neighborhood size used in the similarity com-
putation is comparably low. From a domain analysis
perspective this makes sense, as geometry and form
are mainly considered more local configurations of
attributes, and rather not applicable to district and city
levels.
Overall, this quite accurate pattern retrieval can
be related to the consideration of topological spatial
integration level at different network scales as well
as to the geometric properties of segment length and
direction. The revealed similar patterns are character-
ized by the tree-like structure of the street network. In
addition, distances between intersections on arterials
are relatively larger than the distances in traditional
patterns, and only streets at the same hierarchy or one
above or below it, can intersect with the arterials. All
these attributes do not exist in the traditional street
patterns located in the older areas in the center of Kfar
Saba.
Despite the similarity between street networks that
are established at the same period in both cities regard-
ing the location typical street patterns, they differ in the
level of homogeneity within the street patterns. In Kfar
Saba the neighborhoods are relatively homogeneous
regarding their Local Integration value over all resolu-
tions while in Ashdod the neighborhoods get quickly
very heterogeneous when increasing the spatial resolu-
tion. This is visually salient in the number of distinct
colors the segments have within a highlighted con-
figuration. Moreover, while in Kfar Saba the similar
neighborhoods remain in the periphery, independently
of the resolution level, in Ashdod the neighborhoods
spread to all districts of the city and quickly cover al-
most all the residential districts. The heterogeneity of
the street patterns in Ashdod is a result of the hierar-
chical structure of the neighborhoods’ street networks,
which is reflected well in the spatial patterns of Lo-
cal Integration, where arterial roads with the higher
integration levels separate neighborhoods from each
other. Against that, the hierarchy of importance in
Kfar Saba is much weaker with no clear distinction
IVAPP 2016 - International Conference on Information Visualization Theory and Applications
94
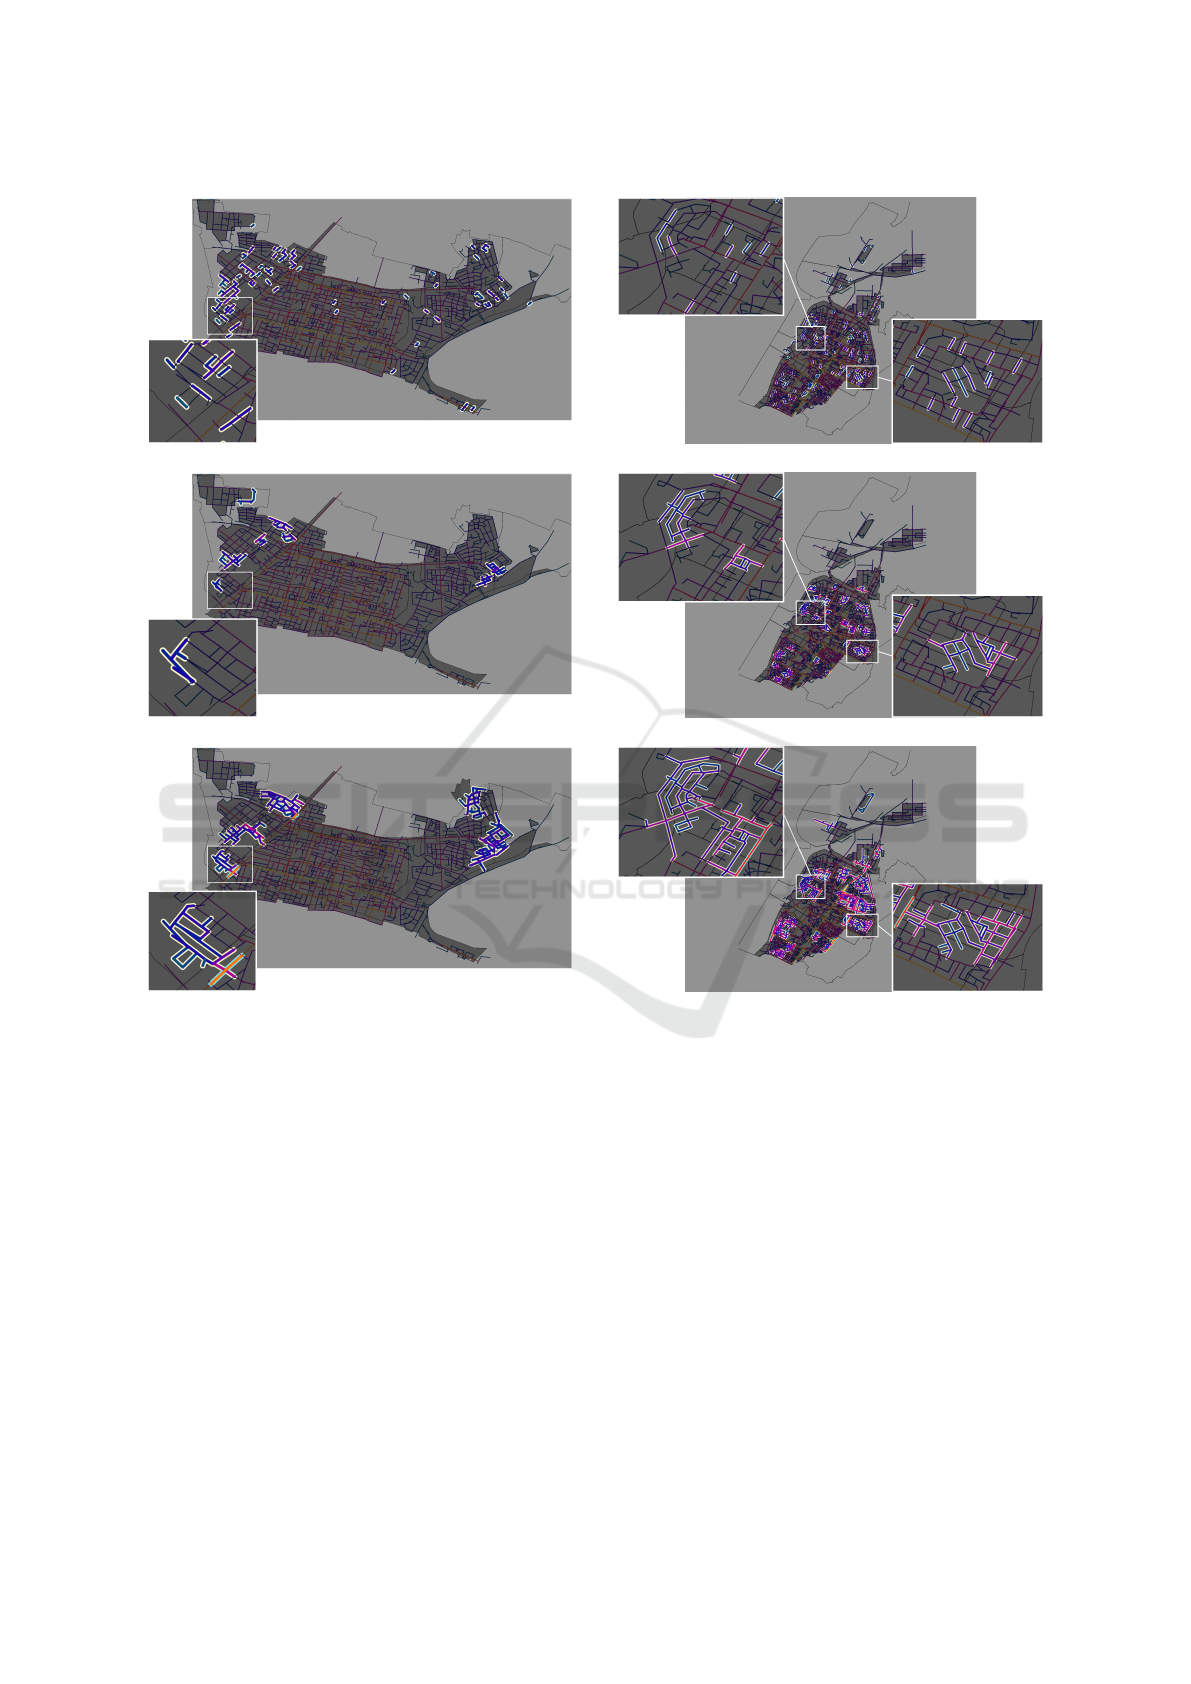
(a) No neighborhood selected.
(b) 2-hop neighborhood.
(c) 4-hop neighborhood.
Figure 7: Kfar Saba use case shows the distribution of similar
patterns in the city’s peripheral area at different scales. A
typical configuration is highlighted at the bottom left.
between neighborhoods.
Thus, unlike previous space syntax works that were
based on the spatial patterns of space syntax attribute
values of individuals segment or axial lines (i.e. neigh-
borhood at level 0), the investigation on pattern simi-
larity in street networks here is conducted at different
neighborhoods size and with simultaneous considera-
tion of topological spatial integration and geometric
aspects of street network (i.e. length and direction of
segments). Due to these capabilities of this flexible
search mechanism in StreetExplorer, we have identi-
fied street patterns that characterize urban planning
approaches as well as sub-types street patterns, in this
application, among modern street-based planning.
(a) No neighborhood selected.
(b) 2-hop neighborhood.
(c) 4-hop neighborhood.
Figure 8: Ashdod use case shows the distribution of simi-
lar segments in the city’s peripheral area. Geometric form,
length and direction, are only marginally included in the
similarity computation and only in the lowest neighborhood
resolution.
5.3 Expert Opinion
The unique contribution of StreetExplorer to the pre-
sentation and analysis of urban street network is
twofold as stated by our co-author domain experts. At
first, the simultaneous consideration of topological-
visual (space syntax attributes) and geometric (i.e.
length and direction of segments in Euclidean terms)
aspects of spatial integration pattern in urban street
network are innovative. Both aspects are essential
for describing and identifying patterns in urban street
networks (Marshall, 2004) and should be considered
StreetExplorer: Visual Exploration of Feature-based Patterns in Urban Street Networks
95

together in street network analysis. For instance, in
(Marshall, 2008) topological features, such as continu-
ity, connectivity and depth, of local street patterns were
extracted and compared with a set of pre-defined pat-
terns on a triangular projection space. StreetExplorer
enables this simultaneous assessment and allows to
represent user-defined patterns in their original spatial
position. Secondly, for the analysis it is indispens-
able to represent similar patterns at different neighbor-
hood sizes beyond the usual presentation at the level
of individual segments. Consequently, the ability to
identify street pattern pieces in urban street network
as previously described enables the building of a ty-
pology of street patterns according to spatial cultures
or urban planning approaches. This leads to explo-
ration of street patterns for the emergence and design
of urban phenomena such as walkable environment,
retail activity and urban center, legible environments
(wayfinding), residential segregation and crime. In ad-
dition to the current use of spatial integration values at
the level of individual segments or axial lines in urban
models (e.g. pedestrian or vehicle volume models) one
could incorporate spatial integration values at the level
of street pattern pieces that are defined by different
neighborhood sizes. Finally, the experts stated, that
they are not aware of any alternative tool or method
that provides such interactive analytic functionality.
6 SUMMARY AND FUTURE
WORK
We introduced StreetExplorer that helps analysts to
explore a given space of network features in their con-
text with a set of available topological street features
provided by domain-specific software. The goal is to
specifically support the exploration and visual com-
parison of street features on the global and local scale
across and between features and regions in an effec-
tive way. We supported an interesting new application
domain for visual analysis, and we provided three con-
tributions in our work as follows. First, we defined a
suitable similarity function to rank and compare street
network properties, taking into account topological
features, but also spatial properties of the network. Sec-
ond, we defined suitable interaction functions, which
allow the user to interactively select local areas of in-
terest based on free-form selection and an adaptive
neighborhood definition. Third, we defined a suitable
color-mapping and boosting scheme, which allow the
visualization of local similarity to a user query in con-
text of the overall feature distribution. Additionally,
we applied StreetExplorer together with domain ex-
perts, demonstrating the effectiveness and usefulness
of the chosen designs by showing unexpected find-
ings. While in the past the analysis has focused on pre-
defined patterns like grid, star, or ring road patterns,
now analysts are able to generate accurate patterns ac-
cording to their interests. By means of StreetExplorer
the domain experts were able to find the most infor-
mative feature and discovered interesting distributions
of local patterns that can be traced back to historic
development and modern planning of urban networks.
In the future, we plan to extend this work in dif-
ferent directions. We will enrich StreetExplorer on
the metadata level by including additional features,
such as landuse, barrier and general user comments,
which can be extracted from openstreetmaps and pro-
vide an extensive search for local patterns in street
networks. Moreover, StreetExplorer can be extended
by different clustering methods for supporting com-
parison of interesting patterns. For instance, details-
on-demand functions could be used to show the most
significant or frequent patterns and propose further
information for analysis. We want to investigate ana-
lytical methods to detect suitable parameter settings
that reveal interesting patterns. This could be realized
by using image-based techniques and comparison al-
gorithms that consider several outcomes of parameter
variations. We also would like to introduce functionali-
ties for comparison of topological features and provide
a semi-automatic feature selection approach based on
statistical measurements. Furthermore, the visual rep-
resentation and global arrangement of maps can be
enhanced by specialized layouts that take the spatial
properties of features into account.
ACKNOWLEDGEMENTS
This work was partially funded by the Juniorprofessor
Program of the Landesstiftung Baden-W
¨
urttemberg
within the research project Visual Search and Analysis
Methods for Time-Oriented Annotated Data.
REFERENCES
Andrienko, G., Andrienko, N., Bak, P., Keim, D., and Wro-
bel, S. (2013). Visual analytics of movement. Springer
Publishing Company, Incorporated.
Bak, P., Omer, I., and Schreck, T. (2010). Visual analytics of
urban environments using high-resolution geographic
data. In Geospatial Thinking, Lecture Notes in Geoin-
formation and Cartography, pages 25–42. Springer.
Barten, P. G. (1999). Contrast sensitivity of the human eye
and its effects on image quality, volume 72. SPIE press.
IVAPP 2016 - International Conference on Information Visualization Theory and Applications
96

Camg
¨
oz, N., Yener, C., and G
¨
uven
c¸
, D. (2004). Effects
of hue, saturation, and brightness: Part 2: Attention.
Color Research & Application, 29(1):20–28.
Chu, D., Sheets, D., Zhao, Y., Wu, Y., Yang, J., Zheng, M.,
and Chen, G. (2014). Visualizing hidden themes of
taxi movement with semantic transformation. In Pa-
cific Visualization Symposium (PacificVis), 2014 IEEE,
pages 137–144.
Dunne, C. and Shneiderman, B. (2013). Motif simplifica-
tion: Improving network visualization readability with
fan, connector, and clique glyphs. In Proc. SIGCHI
Conference on Human Factors in Computing Systems,
pages 3247–3256. ACM.
Fairchild, M. D. and Johnson, G. M. (2004). iCAM frame-
work for image appearance, differences, and quality.
Journal of Electronic Imaging, 13(1):126–138.
Ferreira, N., Poco, J., Vo, H. T., Freire, J., and Silva, C. T.
(2013). Visual exploration of big spatio-temporal ur-
ban data: A study of new york city taxi trips. IEEE
Transactions on Visualization and Computer Graphics,
19(12):2149–2158.
Hillier, B. (2002). A theory of the city as object: or, how
spatial laws mediate the social construction of urban
space. Urban Design International, 7(3):153–179.
Hillier, B. (2007). Space is the machine: a configurational
theory of architecture. Cambridge University Press,
Cambridge.
Jiang, B. (2007). A topological pattern of urban street net-
works: universality and peculiarity. Physica A: Statis-
tical Mechanics and its Applications, 384(2):647–655.
Keim, D. (2000). Designing pixel-oriented visualization
techniques: Theory and applications. IEEE Transac-
tions on Visualization and Computer Graphics, 6(1):59–
78.
Kindlmann, G., Reinhard, E., and Creem, S. (2002). Face-
based luminance matching for perceptual colormap
generation. In Proceedings of the conference on Visu-
alization, pages 299–306. IEEE Computer Society.
Kropf, K. (2009). Aspects of urban form. Urban Morphol-
ogy, 13(2):105–120.
Liu, Y., Zhang, D., Lu, G., and Ma, W.-Y. (2007). A sur-
vey of content-based image retrieval with high-level
semantics. Pattern Recognition, 40(1):262–282.
Marshall, S. (2004). Streets and patterns. London and New
York: Spon Press.
Marshall, S. (2008). Route structure analysis: A system of
representation, calculation and graphical presentation.
Working Paper.
Mittelst
¨
adt, S., J
¨
ackle, D., Stoffel, F., and Keim, D. A. (2015).
ColorCAT: Guided Design of Colormaps for Combined
Analysis Tasks. In Proc. of the Eurographics Confer-
ence on Visualization (EuroVis 2015: Short Papers),
pages 115–119.
Mittelst
¨
adt, S., Stoffel, A., and Keim, D. A. (2014). Meth-
ods for Compensating Contrast Effects in Information
Visualization. Computer Graphics Forum, 33(3):231–
240.
Oelke, D., Janetzko, H., Simon, S., Neuhaus, K., and Keim,
D. A. (2011). Visual boosting in pixel-based visualiza-
tions. In Computer Graphics Forum, volume 30, pages
871–880. Wiley Online Library.
Omer, I. and Zafrir-Reuven, O. (2010). Street patterns and
spatial integration of israeli cities. The Journal of Space
Syntax, 1(2):295.
Pettit, C., Widjaja, I., Russo, P., Sinnott, R., Stimson, R., and
Tomko, M. (2012). Visualisation support for explor-
ing urban space and place. In XXII ISPRS Congress,
Technical Commission IV, volume 25.
Porta, S., Crucitti, P., and Latora, V. (2006). The network
analysis of urban streets: a primal approach. Environ-
ment and Planning B: Planning and Design, 33:705–
725.
Shneiderman, B. (1996). The eyes have it: a task by data
type taxonomy for information visualizations. In Visual
Languages, 1996. Proceedings., IEEE Symposium on,
pages 336–343.
Tian, J., Ai, T., and Jia, X. (2012). Graph based recogni-
tion of grid pattern in street networks. In Advances
in Spatial Data Handling and GIS, Lecture Notes in
Geoinformation and Cartography, pages 129–143.
Turner, A. (2001). A program to perform visibility graph
analysis. In Proceedings of the 3rd Space Syntax Sym-
posium, Atlanta, University of Michigan, pages 31–1.
Vaughan, L., Jones, C. E., Griffiths, S., and Haklay, M. M.
(2010). The spatial signature of suburban town centres.
The Journal of Space Syntax, 1(1):77–91.
von Landesberger, T., G
¨
orner, M., Rehner, R., and Schreck,
T. (2009). A system for interactive visual analysis of
large graphs using motifs in graph editing and aggrega-
tion. In VMV’09, pages 331–340.
von Landesberger, T., Kuijper, A., Schreck, T., Kohlhammer,
J., van Wijk, J., Fekete, J.-D., and Fellner, D. (2011).
Visual analysis of large graphs: State-of-the-art and
future research challenges. Computer Graphics Forum,
30(6):1719–1749.
Wang, Z., Lu, M., Yuan, X., Zhang, J., and Van De Wetering,
H. (2013). Visual traffic jam analysis based on trajec-
tory data. Visualization and Computer Graphics, IEEE
Transactions on, 19(12):2159–2168.
Ware, C. (1988). Color sequences for univariate maps:
Theory, experiments and principles. IEEE Computer
Graphics and Applications, 8(5):41–49.
Wheeler, S. M. (2008). The evolution of built landscapes in
metropolitan regions. Journal of Planning Education
and Research, 27(4):400–416.
Yan, X., Zhu, F., Yu, P. S., and Han, J. (2006). Feature-
based similarity search in graph structures. ACM Trans.
Database Syst., 31(4):1418–1453.
Yang, B., Luan, X., and Zhang, Y. (2014). A pattern-based
approach for matching nodes in heterogeneous urban
road networks. Transactions in GIS, 18(5):718–739.
Yang, T. and Hillier, B. (2007). The fuzzy boundary: the
spatial definition of urban areas.
StreetExplorer: Visual Exploration of Feature-based Patterns in Urban Street Networks
97
