
Palm Vein Recognition based on NonsubSampled Contourlet
Transform Features
Amira Oueslati
1
, Nadia Feddaoui
2
and Kamel Hamrouni
1
1
LR-SITI Laboratory, National Engineering School of Tunis, University ELMAanar, BP 37 Belvedere 1002, Tunis, Tunisia
2
ISD, University Manouba, 2010 Manouba, Tunisia
Keywords: Palm Veins Recognition, NonsubSampled Contourlet Transform (NSCT), ROI Extraction, Feature
Extraction, Feature Matching.
Abstract: This paper presents a novel approach for person recognition by palm vein texture image based on Nonsub-
Sampled Contourlet Transform (NSCT). Our approach consists of four steps. First, we reduce noise and en-
hance contrast in order to produce a better quality of palm vein image then we localize the texture in the
ROI. Next, the texture of enhanced image is analyzed by NSCT and obtained features witch are encoded to
generate a signature of 676 bytes. Finally, we compute hamming distance in comparison to take decision.
The experiments are performed on CASIA Multi-Spectral Palm print Image database. The method evalua-
tion is completed in both verification and identification scenarios and experimental results are compared
with other methods. Experiments results prove the effectiveness and the robustness of NSCT method to ex-
tract discriminative features of palm veins texture.
1 INTRODUCTION
Biometrics refers to all techniques to identify a per-
son based on its intrinsic characteristics that must be
unique and measurable. These features can be physi-
cal, biological or behavioral. The most known are
fingerprints, voice prints, iris, retina and hand. They
offer an irrefutable proof to distinguish one person
from another.
Therefore, palm veins recognition represents a
new generation of integrated access control system
based on the safest biometric technology today.
Palms have a large and rich blood vein patterns. It’s
unique to each person, stable during the person's
lifetime and a palm vein image is easily captured by
near-infrared rays, without contact and without a
trace. This makes this technology non-invasive,
hygienic and widely acceptable to users.
In this paper, to obtain a high-performance of
palm veins recognition system, we have applied the
Non sub sampled Contourlet Transform (NSCT)
method which is a shift-invariant, multi-scale, and
multi-directional transform. It can capture significant
veins features along all directions.
The rest of this paper is structured as follows. In
Section 1, existing methods in literature are briefly
reviewed, in Section 2 the proposed palm veins
recognition method using the NSCT is presented, in
Section 3 experimental results of the proposed
method are given and discussed. Finally, in Section 4,
conclusions are drawn.
2 STATE OF ART
Extensive work has been made on person recognition
using palm-vein technology based on many and dif-
ferent type of filtering. For example, In the work
presented by (Pan and Kang, 2011) the image is pre-
processed by histogram equalization, then three algo-
rithms (Scale Invariant Feature Transform, Speeded-
Up Robust Features and Affine-SIFT) were used to
extract local features, and finally the matching results
were obtained by computing the Euclidean distance.
Palm vein feature extraction from near infrared
images is proposed by (Sadeghi and Drygajlo, 2011)
an approach based on local texture patterns is
proposed. The operators and histograms of multi-
scale Local Binary Patterns are investigated to
identify statistical descriptors for palm vein patterns
and novel higher-order local pattern descriptors based
on Local Derivative Pattern histograms are then
Oueslati, A., Feddaoui, N. and Hamrouni, K.
Palm Vein Recognition based on NonsubSampled Contourlet Transform Features.
DOI: 10.5220/0005780902490254
In Proceedings of the 11th Joint Conference on Computer Vision, Imaging and Computer Graphics Theory and Applications (VISIGRAPP 2016) - Volume 4: VISAPP, pages 249-254
ISBN: 978-989-758-175-5
Copyright
c
2016 by SCITEPRESS – Science and Technology Publications, Lda. All rights reserved
249
investigated for palm vein description. In the work of
(Han and Lee, 2013), they proposed an adaptive
Gabor filter method to encode the palm vein features
in bit string representation. The bit string
representation, called VeinCode, offers speedy
template matching and enables more effective
template storage. The similarity of two VeinCodes is
measured by Hamming distance.
In this paper, a new approach is proposed for
palm vein recognition with a high performance based
on NonsubSampled Contourlet Transform.
3 PROPOSED METHOD
In biometrics, Palm vein technology works by identi-
fying the vein in an individual's palm. When a per-
sonal's hand is held over a scanner, a near-infrared
light locate the veins.
The red blood cells in the palm veins absorb the
rays and show up on the map as black lines, whereas
the hand structure shows up as white. This vein
pattern is then verified to authenticate the individual.
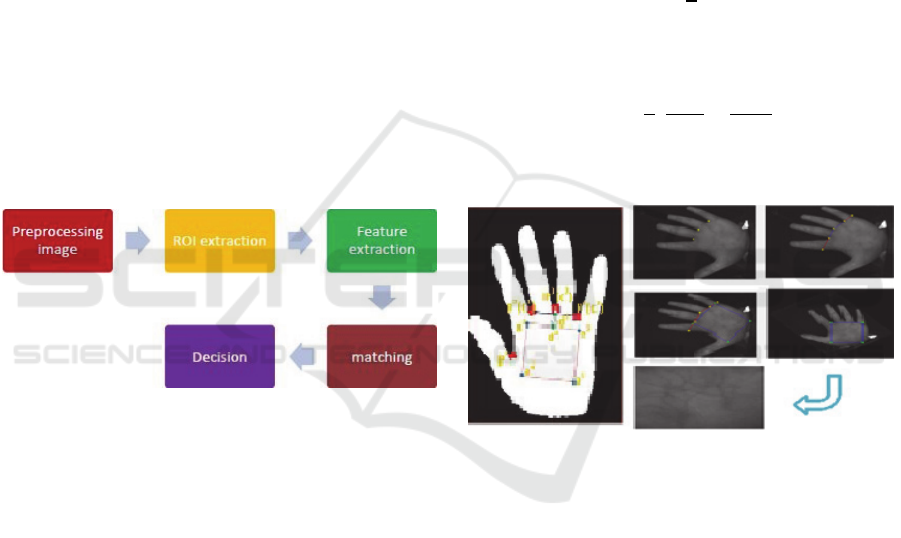
Figure 1: The process of the Palm veins recognition.
Figure 1 shows the general process of the
recognition model using Palm veins biometrics. This
palm vein recognition system consists of four steps:
palm veins region localization, preprocessing, feature
extraction, and matching.
3.1 Preprocessing
First, to segment the input image from the back-
ground we have applied a threshold. The smaller
objects due to the noise are removed through con-
nected components labeling. To normalize the con-
tour of the hand image a morphological operator
closing is carried out with a square structuring ele-
ment.
3.2 ROI Extraction
This process has many important aims; first, it serves
to remove the rotation, translation and scale (RST)
variations of palm vein images. Second, it allows
extracting the most informative area in the palm vein
image.
In the proposed palm vein recognition method, we
apply the method of (Feng et al. 2011). The four steps
to obtaining the square area ROI are described as
follows:
1) Line up the key point C
1
and the key point C
3
to
get the X-axis of image and then make a line
through the key point C
2
, perpendicular to the Y-
axis, and the intersection is d
1
.
2) Calculate the mean δ distance between the points
C
1
, C
2
, C
3
and make:
d
d
δ
2
(1)
3) Locate the square a
1
a
2
a
3
a
4
, a
1
a
2
and C
1
C
3
are
parallel, and make:
a
a
σ
3
2
,
a
d
d
a
C
C
C
C
(2)
4) Get the ROI from the original image, and
transform it into a grey image of fit size.
Figure 2: Region of interest (ROI) of palm vein image.
3.3 Palm Veins Feature Extraction
We analyze the texture to detect the most distinctive
characteristics using NSCT to extract texture features.
3.3.1 Texture Description based on NSCT
NSCT is composed of two-channel nonsubsampled
filter bank (NSFB). One is the Nonsubsampled direc-
tional filter banks (NSDFB) that provide the direc-
tionality and the other one is the Nonsubsampled
pyramid (NSP) that ensures the multi-scale property
(
Gonzalez et al., 2010)
. The structure of the NSCT (Fig.
3) ensures the shift-invariant property. Figure 3(a)
shows the structure of the two-channel NSFB, and
Figure 3(b) shows a 2-D frequency domain split into
a number of subbands. The NSP consists on a high-
pass (HP) subband and a low-pass (LP) subband, and
VISAPP 2016 - International Conference on Computer Vision Theory and Applications
250
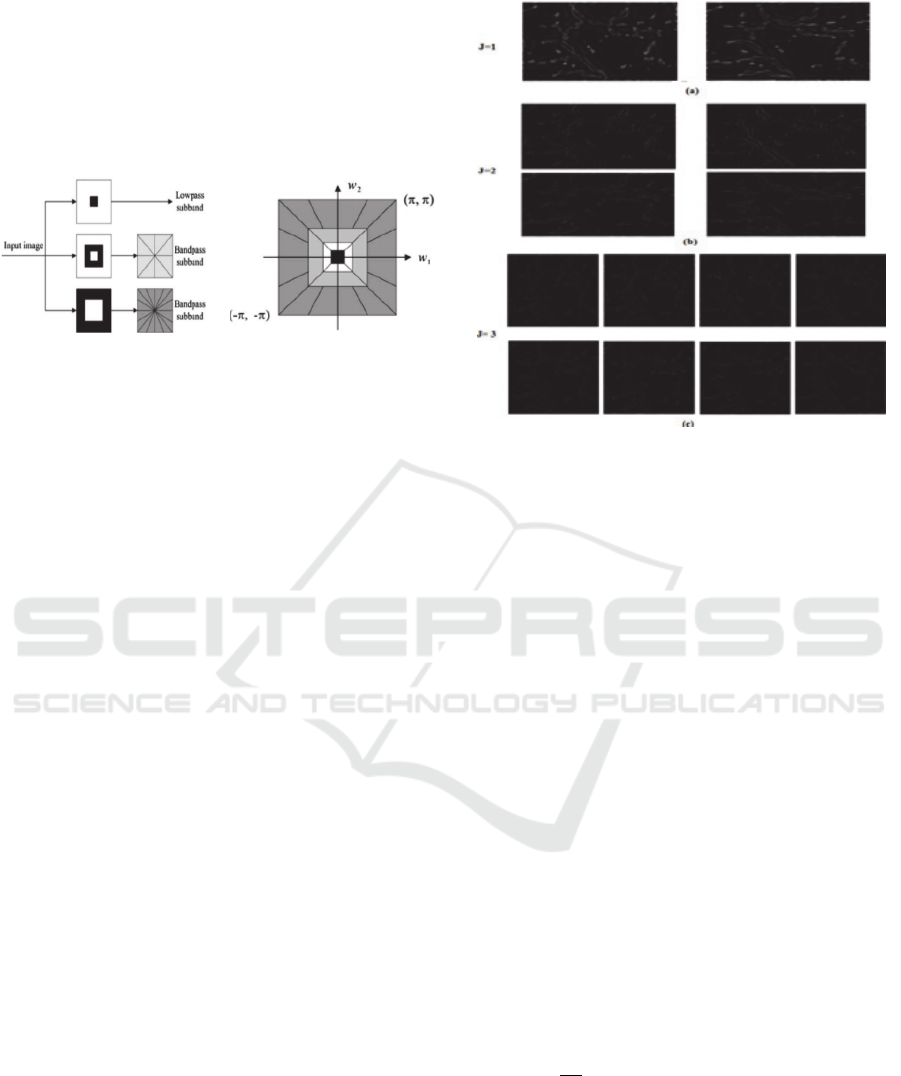
the NSDFB decomposes the HP subband into a num-
ber of directional subbands.
Consequently, the NSCT is effective in
representing well the detailed characteristics of the
strong palm vein texture along the radial and angular
directions. (
Zhou et al., 2012); (Tang et al., 2007); (Yang
et al., 2007).
(a) NSFB that implements the
NSCT
(b)2-D frequency partitioning
domain into a number of
subbands
Figure 3: NSCT structure (Gonzalez et al., 2010).
3.3.2 Palm Vein Features Extraction using
the NSCT
The binary vein image Fig 4(c) is used as the input of
the NSCT. After filtering by the NSCT, all of the
NSCT coefficients are used to define the palm vein
features.
The NSCT coefficients in all the subbands can be
defined as:
W
,W
1jJ
1id
(3)
(J) is the total number of scale decomposition; (dj) is
the number of directions at j-th scale. W
J
Represents
the low-frequency coefficients and W
i
j
represent the
mid/high-frequency coefficients in the i-th directional
subband of the j-th scale level.
To capture strong distinct directional
characteristics of the palm vein, the coefficients in the
HP subbands
W
at scale j are used as the palm vein
features. Little directional information is contained
because the pyramid subband is an approximation
and contains LP information. Therefore, the LP
coefficients are W
J
excluded in the palm vein feature
extraction process. (
Gonzalez et al. 2010)
Consequently, only the coefficients
W
in mid-
and HP subbands are used as palm vein features.The
results of the decompositions is shown in Fig4.
Then, a binary feature vector must be created, the
signs of the NSCT coefficients W
in each subband
are used to generate the binary code (BC):
Figure 4: the Directional subband images at three different
scale levels. (a) Scale 1, two directions (d1=2), (b) Scale 2
Four directions (d2=4), (c) Scale 3 Eight directions (d3=8).
bc
x,y
1, i
f
W
x,y0
0, else
;1id
(4)
(x,y) represent the coordinates in each
nonsubsampled subband image
W
. It is known that
the resulting (BC) contains sign information in each
NSCT subband. All the directional characteristics in
both multi-directions and multi-scale are considered
in the generated (BC). The final binary palm vein
vector is expressed as:
V
x,y
bc
x,y
⋯bc
x,y
⋮bc
x,y
⋯bc
x,y
⋮⋯⋮bc
x,y
⋯bc
x,y
(5)
3.4 Palm Vein Feature Matching
In order to match two palm vein feature vectors, the
Hamming distance (HD) is used. The HD measure
between two palm vein feature vectors V
1
and V
2
can
be defined as: (
Daugman, 1993)
HD
1
XY
V
x,
y
⊕V
x,
y
;
(6)
Where (x, y) represents the pixel coordinates in the
X×Y subband image. The HD measure between two
palm vein vectors calculates how many bits are
different, if the value of the HD is closer to ‘0’, it
means that the two palm vein vectors come from the
same subject, and vice versa.
Palm Vein Recognition based on NonsubSampled Contourlet Transform Features
251
4 EXPERIMENTAL RESULTS
In this section, we will introduce the performance
measurement of our algorithm in verification and
identification scenarios. Then we will try to compare
our results with results of well-known veins recogni-
tion methods found in the literature. Tests are carried
out on left and right hands images of CASIA Multi-
Spectral Palm print database (
CASIA Multispectral
Palmprint Database).
The CASIA database contains large RST
variations since it was acquired using a non-contact
sensor, it has 200 identities, 6 samples per identity
witch give us 1200 palm veins.
Verification experiments and identification
experiments are detailed in the Section below.
4.1 Verification Mode
We perform verification experiments by reporting the
inter-class and intra-class curves, Receiver Operating
Characteristic (ROC) curves, the decidability (MD),
the degree of freedom (DOF) and the equal error rate
(EER).
In verification mode, all images in the database
are matched to all other images which commonly
named as “all versus all” in the literature.
After the calculation of the hamming distances of
all templates comparisons, which is a fractional
measure of dissimilarity; 0 would represent a perfect
match, the Intra-Class and the Inter-Class distribution
are found. The Inter-Class distribution of the
hamming distances is generated by comparing
between templates of the different persons. Intra-
Class distribution is generated by comparing between
different templates of the same sample. The number
of operations is 359400, 3100 of genuines and
716 300 of imposters.
To test the separability of the veins recognition
system, the decidability index MD proposed by
(Daugman, 1993) is used. The mean and the standard
deviation of intra-class and inter-class distributions
are calculated in order to calculate the decidability, If
their two mean values are µ1 and µ2, and their two
standard deviations are σ1 and σ2, then ‘MD’ is
defined as:
MD
|
μ
μ
|
σ
σ
2
(7)
We introduce also the uniqueness of the vein patterns
which means that there is an independent variation in
the vein details (Sun et al., 2005); we can determine
the vein uniqueness by examining the Inter-Class
distribution and calculating the degree of freedom
‘DOF’ defined as:
DOF
μ
1μ
σ
(8)
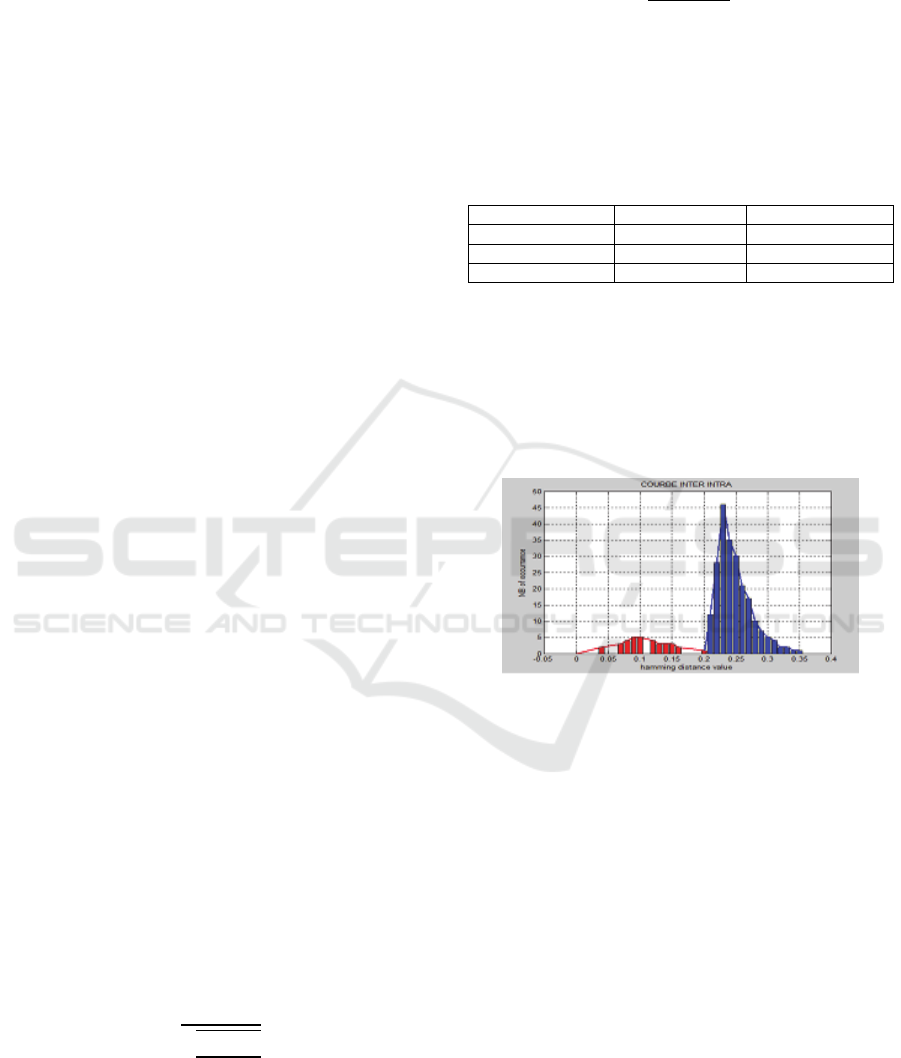
To choose the best number of decomposition k, we
have varied k form 2 to 4 and for each stage we have
generated the intra class and inter class distributions
as shown in Fig. 5. The obtained decidabilities and
the degrees of freedom are given in Table 1.
Table 1: Decidability ‘MD’ and degree of freedom ‘DOF’.
Stage k MD DOF
k = 2
1.22 11.06
k = 3
3.46 72.12
k = 4
3.43 50.67
The measure of decidability achieved high value
on CASIA database from k equal to 3; it reflects the
perfect separation between the two distributions
which don’t overlap. So the less error is found which
allows for more accurate recognition. We will focus
our study on the number of decomposition stages
k=3.
Figure 5: Intra class and Inter class distributions.
The highest HD of the intra-class distribution is
0.21 and the smallest HD of the inter-class
distribution is 0.2. Thus, a decision criterion of 0.2
can perfectly separate the dual distribution. The error
rates FAR (False Accepted Rate) and FRR (False
rejected Rate) will be 0.2% at that threshold.
Clearly, the probability of not making a false
match for single one-to-one verification trials is
99.70%, so we can conclude that the probability of
making at least one false match when searching a
database of N unrelated patterns is 0.30%.
The veins recognition system error rates, FAR and
FRR, are dependent on the adjustable adopted
threshold. Our algorithm will then compute the HDs
that will be sorted in ascending order and vary the
threshold from 0 to 1 then determine in each case the
corresponding FAR and FRR which will be used to
construct the ROC curve shown in Fig. 6.
When we increase threshold value, the FAR will
VISAPP 2016 - International Conference on Computer Vision Theory and Applications
252
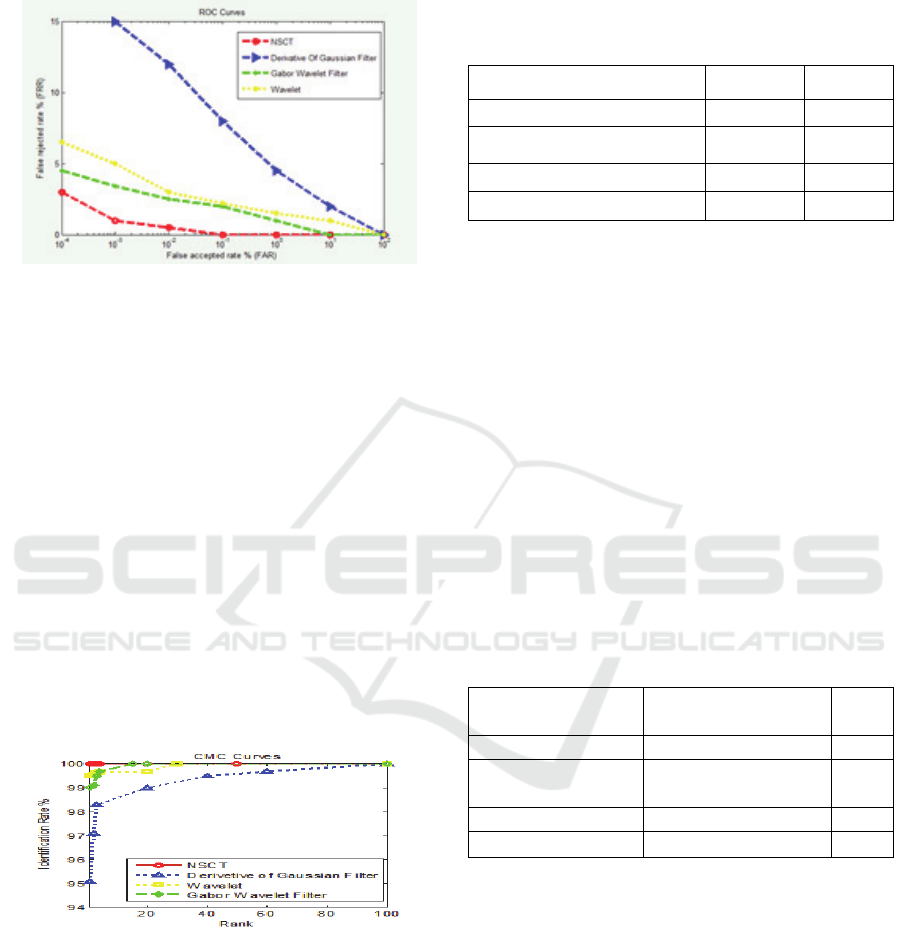
increase and FRR will decrease. When FAR is equal
to FRR, this value is called ERR (Equal Error Rate).
Figure 6: Comparison of ROC curves with other tech-
niques.
The TAR (True Acceptance Rate) can be used as
an alternative to FRR while reporting the perfor-
mance of a biometric verification system.
The results show a 99.70% of TAR in our
proposed system.
4.2 Identification Mode
The methodology we have followed consists on ran-
domly selecting one of palm veins images per subject
to form the gallery and treats all the remaining imag-
es as probes. The training set is composed of 200
Right/200Left samples and the testing set is com-
posed of 400 Right/400Left.
We report cumulative Match Characteristic
“CMC” curve (fig. 7). This system achieved 99.80%
of rank-one identification rate.
Figure 7: Comparison of CMC curves with other tech-
niques.
4.3 Comparison with State-of-the-Art
Methods
We compare the performance of the proposed method
with three state-of-the-art ones namely Wavelet
(Kong et al., 2004) Gabor Wavelet Filter (Sun et al.,
2005) and Derivative of Gaussian Filter (Wu et al.,
2006). Tests are carried out on CASIA database.
A direct comparison on ROC curves is shown in
Fig. 6 and the results of the Equal Error Rate (EER)
and the TAR are summarized in Table 2.
Table 2: EERs and TARs of the different techniques.
Method EER % TAR %
NSCT 0,2000 99,70
Derivative Of Gaussian Filter
2.8887 92.01
Gabor Wavelet Filter
0.8660 98.40
Wavelet
0.4999 98.66
We can observe that our method gives perfect
results. Indeed, the NSCT ROC curve coincides with
coordinate axis. When the threshold is low, FAR will
be 0 and FRR vary from 1 to 0.When the threshold is
high, FRR will be 0 and FAR vary from 0 to 1. When
the threshold is about 0.2, FAR and FRR will
intersect at the 0.2 position, so the EER rate will be
0.2000% and the TAR will be 99.70% witch
consistently outperforms all other techniques for
CASIA database. We observe clearly that our
proposed method achieves an important EER
reduction compared to the nearest competitor,
Wavelet method.
Figure 7 shows a comparison of the CMC curves
of these several techniques and Table 3 summarizes
the results of rank-1 identification rates and time
processing of different techniques.
Table 3: Comparison of different algorithms.
Method Rank 1 identification rate Time(s)
NSCT 99,80
0.0010
Derivative Of Gaussian
Filter
95.10 0.0900
Gabor Wavelet Filter
99.01 0.1519
Wavelet
99.63
0.1214
The NSCT code achieved 99.80% identification
rate for rank-1. It is fair to deduce that the proposed
method performs better for identification in
comparison to state-of-the art techniques. We make
also a comparison on the time of execution shown in
Table 3 which demonstrates that our approach is very
quick and perfect.
5 CONCLUSIONS
This paper proposes a palm vein recognition method,
in which shift-invariant, multi-scale, and multi-
Palm Vein Recognition based on NonsubSampled Contourlet Transform Features
253

directional NSCT coefficients are used as effective
palm vein features.
We apply a pre-processing of the image to
eliminate the noise and the unwanted points.
Next, all the NSCT coefficients in each
directional subband are used to extract palm vein
features. The created palm vein vector extracts
desirable characteristics of features in both multi-
scale and multi-directions. These features are encoded
to generate a signature of 676 bytes. Finally,
hamming distance is computed in comparison.
Experimental results show the effectiveness of the
proposed NSCT feature based method in verification
and identification modes. We obtain an excellent
results of 99,80% of rank one recognition rate and
0.2000% of EER.
Future research will focus on the improvement of
the execution time and the performance of the
proposed algorithm fusion with the multimodality of
palm and dorsal parts of hand.
ACKNOWLEDGEMENTS
The authors would like to acknowledge the National
Laboratory of Pattern Recognition, Institute of Auto-
mation, Chinese Academy of Sciences for their sup-
ply of Casia Multi-Spectral Palm print image data-
base.
REFERENCES
M. Pan, W. Kang, 2011. Palm Vein Recognition Based on
Three Local Invariant Feature Extraction Algorithms
Biometric Recognition, Lecture Notes in Computer Sci-
ence, Vol. 7098.
M. M. sadeghi, L. Drygajlo, A. , Oct. 2011. Palm vein
recognition with Local Binary Patterns and Local De-
rivative Patterns, International Joint Conference
on Biometrics Compendium (IJCB), 11-13, Washing-
ton.
W.Y. Han, J. Ch. Lee, March 2013.Palm vein recognition
using adaptive Gabor filter, Expert Systems with Ap-
plications, Vol. 40.
YiFeng,Jingwen Li, YiFeng, Jingwen Li, Lei Huang, and
Changping Liu, 2011. “Real-time ROI Acquisition for
Unsupervised andTouch-less Palmprint,” World Acad-
emy of Science, Engineering and Technology 54.
R. C. Gonzalez and R. E. Woods, 2010. Digital image
processing, (Pearson Education Inc., Upper Saddle
River), NJ, USA, 3rd edn.
J.G. Daugman, Nov.1993. High confidence visual recogni-
tion of persons by a test of statistical independence,
IEEE Trans. Pattern Anal. Machine Intell, vol. 15, no.
11.
Y. Zhou and J. Wang, Nov. 2012. Image denoising based
on the symmetric normal inverse Gaussian model and
NSCT, IET Image Processing, Vol. 6, no. 8.
L. Tang, F. Zhao and Z. G. Zhao, Nov. 2007. The nonsub-
sampled contourlet transform for image fusion, Proc.
Int.Conf. Wavelet Analysis and Pattern Recognition,
Beijing, China.
B. Yang, S. T. Li and F. M. Sun, Aug. 2007. Image fusion
using nonsubsampled contourlet transform, Proc.
Fourth Int. Conf. Image and Graphics, SiChuan, China.
“CASIA Multispectral Palmprint Database.” [Online].
Available:http://www.cbsr.ia.ac.cn/MS Palmprint Data-
base.asp.
A.-K. Kong and D. Zhang, August 2004. Competitive cod-
ing scheme for palmprint verification, International
Conference on Pattern Recognition, Cambridge UK.
Z. Sun, T. Tan, Y. Wang, and S. Z. Li, June 2005. Ordinal
palmprint representation for personal identification,
Computer Vision and Pattern Recognition CVPR, San
Diego.
X. Wu, K. Wang, and D. Zhang, Nov. 2006. Palmprint
texture analysis using derivative of gaussian filters, In-
ternational Conference Computational Intelligence and
Security, New York.
VISAPP 2016 - International Conference on Computer Vision Theory and Applications
254
