
Integration of Load Shifting and Storage to Reduce Gray Energy
Demand
Iv´an S. Razo-Zapata
1
, Mihail Mihaylov
2
and Ann Now´e
2
1
Luxembourg Institute of Science and Technology, Esch-Sur-Alzette, Luxembourg
2
Vrije Universiteit Brussel, Brussels, Belgium
Keywords:
Smart Grid, Multi-Agent Systems, Load Shifting, Storage.
Abstract:
The smart grid concept offers an opportunity to design new environmentally friendly energy markets for re-
ducing CO2 emissions. To achieve this goal, we should increase the use and penetration of green energy while
softening our dependency on gray (non-environmentally friendly) energy too. In this work we show how load
shifting and storage can be incorporated into new energy markets to reduce gray energy consumption. We
used multi-agent-based simulations that are fed with real data to analyze the influence of load shifting and
storage to reduce gray energy demand as well as the behaviour of prices for gray and green energy. Results
suggest that reduction in gray energy consumption is feasible during peak times, i.e. up to 15%. Nonetheless,
if the amount of renewable resources is increased 50%, higher reductions can be achieved, i.e. up to 30%.
Furthermore, one of the findings also suggests that storage helps to keep the price of green energy low.
1 INTRODUCTION
Engineering smart grids is a challenging task that
must deal with new emerging actors, e.g. prosumers
1
as well as with complex interactions between people,
technology and natural systems (Schuler, 2010; Ram-
churn et al., 2012). Among those interactions, eco-
nomic and power flows are of utmost importance (van
Werven and Scheepers, 2005; Schuler, 2010).
Novel mechanisms have been already proposed to
not only optimize economic and power flows but also
improve the integration of renewable resources (Ilic
et al., 2012; Kok et al., 2005; Capodieci et al., 2011;
Mihaylov et al., 2014). Nonetheless, they have not
analyzed the potential use of load shifting and stor-
age to reduce gray energy demand and improve the
integration of renewable sources.
As a way to analyze such potential use, we take
NRG-X-Change as an example of a novel mechanism
that can benefit from load shifting and storage. NRG-
X-Change aims at promoting the trade and flow of
locally produced green energy within dwellings (Mi-
haylov et al., 2014). It offers to prosumers the pos-
sibility to trade their excess of green energy by us-
ing NRGcoins, which are virtual coins inspired by
the Bitcoin protocol (Nakamoto, 2008). Unlike Bit-
1
The term prosumer refers to energy consumers that can
also produce their own power.
coins, NRGcoins are generated by injecting green en-
ergy into the grid rather than using/spendig computa-
tional power (Mihaylov et al., 2014).
Although NRG-X-Change promotes the local
trade and consumption of green energy between resi-
dential consumers and prosumers, it does not guaran-
tee that green energy production fully matches con-
sumption. In fact, when green energy is not enough
to cover demand, consumers and prosumers will con-
sume gray (non-environmentally friendly) energy to
satisfy theirs needs and maintain a given level of com-
fort. To soften the dependency on gray energy, i.e.
reducing its consumption, load shifting and storage
capabilities can be integrated into NRG-X-Change.
In this way, “original gray consumption” can be cov-
ered using stored green energy or delayed until green
energy becomes available. Nonetheless, this inte-
gration is far from trivial, since it has been already
shown that such capabilities impact energy demand
and price (Pr¨uggler et al., 2011), which may poten-
tially inhibit trade and/or increase consumption.
In this work, we present preliminary results on
the integration of load shifting and storage capabil-
ities into NRG-X-Change. Using real consumption
and production data provided by a Belgian retailer,
we performed numerical simulations to analyze the
performance of storage and load shifting as well as
the impact on energy prices and the reduction of gray
154
Razo-Zapata, I., Mihaylov, M. and Nowé, A.
Integration of Load Shifting and Storage to Reduce Gray Energy Demand.
In Proceedings of the 5th International Conference on Smart Cities and Green ICT Systems (SMARTGREENS 2016), pages 154-165
ISBN: 978-989-758-184-7
Copyright
c
2016 by SCITEPRESS – Science and Technology Publications, Lda. All rights reserved

energy consumption. Our simulations are based on
a multi-agent system that replicates the behaviour of
main stakeholders, i.e. energy retailers, consumers
and prosumers.
Results suggest that load shifting and storage can
reduce energy demand during peak hours. In this way,
a 15% reduction can be achieved within a typical Bel-
gian district that is on average composed of 60 house-
holds in which 10% are prosumers. Nonetheless, as
our results indicate, 30% reduction can be achieved
during peak hours if the number of prosumers reaches
50% within the Belgian market, which is a plausi-
ble scenario for the comming years (Rickerson et al.,
2014).
Furthermore, another finding suggests that storage
plays an important role to keep green energy prices
low as prosumers can inject and trade energy from
batteries, which provides a more constant supply of
green energy.
The rest of the paper is organized as follows. Sec-
tion 2 presents related work covering aspects such as
load shifting, demand response and negotiation strate-
gies for energy markets. Later on, Section 3 describes
green and gray energy markets as well as load shifting
and storage capabilities. Afterwards, Section 4 shows
preliminary results, whereas general conclusions and
future work are presented in Section 5.
2 RELATED WORK
2.1 Modifying Energy Consumption
Different strategies can be applied to modify the con-
sumption of energy. On the one hand, storage capabil-
ities can reduce demand for energy during critical pe-
riods by using green energy that has been previously
stored when green energy was abundant (Pr¨uggler
et al., 2011). On the other hand, demand response
(DR) capabilities can be used to reduce customers’
normal consumption pattern by shifting a percentage
of their demand to off-peak hours (Gottwalt et al.,
2011; Aghaei and Alizadeh, 2013). Different tech-
niques have been applied to support DR capabilities,
which can be roughly classified into three schemes:
1) Price based: in this scheme the price of energy
changes over time, which may motivate customers to
also change their consumption profile. 2) Incentive
or event-based: customers are rewarded for changing
their energy demand upon retailer’s requests. 3) De-
mand reduction bids: customers send demand reduc-
tion bids to energy retailers (Siano, 2014).
Although several DR techniques and programs
have been proposed in literature (Aghaei and Al-
izadeh, 2013; Siano, 2014) and implemented in pi-
lots (Niesten and Alkemade, 2016) respectively, they
all agree on an important issue: residential cus-
tomers offer a lower potential for demand reduc-
tion compared to commercial and industrial con-
sumers (Gottwalt et al., 2011; Aghaei and Alizadeh,
2013). Likewise, in (Gottwalt et al., 2011; Pr¨uggler,
2013), it is also reported that the economic benefits
are moderate for residential consumers compared to
the required investment. Consequently, as an attempt
to better reduce residential demand for gray energy,
we aim at enhancing DR techniques by using storage
capabilities. This combination will allow not only to
shift energy demand to time slots in which green en-
ergy is produced but also to slots in which storage de-
vices discharge green energy to be consumed.
2.2 Negotiation Strategies
Several mechanisms have been also proposed to trade
energy within smart grids. Nobel (Ilic et al., 2012)
applies a market mechanism in which prosumers offer
their excess of energy by submitting asks (sell orders)
while consumers submit bids (buy orders). They, both
prosumersand consumers, submit asks and bids based
on predictions about their expected production and
consumption respectively. Later on, asks and bids are
matched based on price, i.e. a scalar value. Like-
wise, PowerMatcher (Kok et al., 2005) uses a market
mechanism for matching supply to demand. Nonethe-
less, bids and asks are not scalar values but price
curves. An aggregator is in charge of grouping in-
dividual curves so that more supply and demand can
be matched. The orderbook then computes price equi-
librium to match aggregated asks and bids.
In (Capodieci et al., 2011), the authors propose
a mechanism in which energy is contracted by in-
dividual consumers and prosumers via negotiations.
Although no central mechanism rules the price of
energy, the energy retailer is in charge of assigning
prosumer-consumer pairs for negotiation. In a sim-
ilar vein, Wang and Wang have proposed adaptive
negotiation strategies to trade energy between smart
buildings and grid operators (Wang and Wang, 2013).
The trade takes the form of a bi-direcctional pro-
cess in which a seller, e.g. grid operator, continu-
ously adapts (submits) prices for energy (asks), while
a buyer replies with counter offers (bids). Bids and
asks can be adapted using the Adaptive Attitude Bid-
ding Strategy (AABS) or an improved version that
applies particle swarm optimization techniques (PSO-
AABS).
Similar to Nobel and PowerMatcher, NRG-X-
Change presents a market mechanism to locally trade
Integration of Load Shifting and Storage to Reduce Gray Energy Demand
155

energy between consumers and prosumers (Mihaylov
et al., 2014). It relies on prosumers injecting their
excess of green energy into the grid and trading
NRGcoins, which are used to pay for green energy.
In this way, prosumers injecting green energy are re-
warded with NRGcoins, whereas consumers must pay
for the usage with NRGcoins (Mihaylov et al., 2014).
To trade NRGcoins, consumers and pro-
sumers participate in a continuous double auction
(CDA) (Shoham and Leyton-Brown, 2008), where
buyers and sellers apply bidding strategies to sub-
mit bids and asks respectively. NRG-X-Change
originally uses the so-called adaptive attitude (AA)
strategy, which relies on short-term and long-term
attitudes for adapting to market changes (Ma and
Leung, 2007; Mihaylov et al., 2015). Briefly, a
short-term attitude encourages the agent to be eager
for more profit, i.e. selling at high prices or buying
at low prices, while a long-term attitude encourages
the agent to be eager for more transactions, i.e.
submitting low asks or high bids. Based on market
events (transactions, ’atractive’ bids and asks), AA
continuously updates an agent’s eagerness to sell or
buy items.
In this work, we use the NRG-X-Change to trade
green energy as it offers a novel mechanism that in-
centives prosumers to inject their excess of green
energy while promoting a transparent economic ex-
change via NRGcoins. To trade gray energy,however,
we apply a negotiation approach based on AABS as
this type of negotiation mimics retailer’s control on
gray energy prices, i.e. they establish prices based on
their private reservation price. The next section elab-
orates on these issues as well as on the overall archi-
tecture to support load shifting and storage.
3 ENERGY TRADE
Briefly, the electricity system (ES) is composed of all
systems and actors involvedin production, transporta-
tion, distribution and trade of electricity. This ES can
be divided into a commodity subsystem and a phys-
ical subsystem (van Werven and Scheepers, 2005).
The former covers all economic flows resulting from
electricity trade, whereas the physical subsystem con-
sists of all equipment that produces, transports and
uses the electricity.
In our case, as part of the commodity subsystem,
we assume the existence of green and gray energy
markets, which operate in parallel but use different
mechanisms. Moreover, the physical subsystem spec-
ifies the overall smart grid architecture as well as the
way storage and load shifting operate.
3.1 Commodity Subsystem
3.1.1 Green Energy Market
We use the NRG-X-Change approach to allow the
flow and trade of green (solar) energy between pro-
sumers (Mihaylov et al., 2014). We assume con-
sumers and prosumers are connected to the electric-
ity grid via a substation (see also Sect. 3.2). Ex-
cess of locally produced green energy is fed into the
grid and is withdrawn mostly by consumers. The
billing is performed in real-time by the substation us-
ing NRGcoins, which are independently traded on an
open currency exchange market for their monetary
equivalent.
NRGcoin is a virtual coin inspired by Bitcoin
whose main advantage is that it can be exchanged for
a specific quantity of green energy at any time. For in-
stance, if a prosumer injects 10 kWh right now, (s)he
will earn NRGcoins accounting for that amount of en-
ergy, based on the local supply and demand measured
by the substation (Mihaylov et al., 2014). Later on,
e.g. after few years, regardless of the NRGcoin mar-
ket value, theprosumer can use the same NRGcoins to
pay 10 kWh of green energy under similar energy sup-
ply and demand conditions as during injection (Mi-
haylov et al., 2014).
Unlike the original NRG-X-Change, to trade
NRGcoins, we use the Adaptive-Aggressiveness
(AAggressive) bidding strategy as it applies a learn-
ing approach, which has been shown to be very robust
in dynamic markets (Vytelingum et al., 2008). AAg-
gressive is composed of four basic blocks: equilib-
rium estimator, aggressiveness model, adaptive layer
and bidding layer (Vytelingum et al., 2008). Based on
historical record of prices, the equilibrium estimator
computes the target price for the trader, whereas the
aggressiveness model determines the trader’s risky
behaviour to submit high (low) bids (asks). The adap-
tive layer implements short-term and long-term learn-
ing to adapt the behaviour of the trader. While the
short-term learning updates the agent’s aggressive-
ness, the long-term learning modifies the agent’s bid-
ding behaviour. Finally, the bidding layer implements
a set of rules to determine whether the trader must
submit bids(asks) or not.
Parameter tuning for AAggressive is done as sug-
gested in (Vytelingum et al., 2008). Nonetheless, we
specified constraints for bids and limit prices. On the
one hand, minimum and maximum allowed bids in
the market are as follows. The minimum bid is 0.01
Euro, while the maximum bid is 0.215 Euro, which is
the estimated average price for residential customers
in Belgium during 2014 (VEA, 2014). On the other
SMARTGREENS 2016 - 5th International Conference on Smart Cities and Green ICT Systems
156

hand, limit prices for buyers and sellers were ran-
domly defined in the range 0.01 and 0.215 Euro.
3.1.2 Gray Energy Market
In (Mihaylov et al., 2014), the authors allow
prosumers trading green and gray energy with
NRGcoins. In this work, however, to trade gray
energy prosumers must pay in Euro. The main
motivation is that NRGcoins should be perceived
as assets that guarantee provision of green energy
only. Similar ideas have been previously explored.
For instance, ecolabels that inform customers on
whether some products and services are green or eco-
friendly (Room and Institute, 2010).
Since prosumers and consumers must consume
gray energy whenever there is a lack of green en-
ergy, prosumers and consumers use the AABS strat-
egy to negotiate prices for gray energy with the sub-
station (Wang and Wang, 2013). As described in Sec-
tion 2.2, the AABS strategy relies on a bi-direcctional
negotiation in which a buyer (prosumer/consumer)
submits bids (price willing to pay for energy) to a
seller (substation) that responds with asks (desired
selling prices). Once the buyer’s bid is equal to or
greater than the seller’s ask, an agreement has been
reached to trade energy among the two of them. The
final price for energy is the average between the bid
and the ask.
Substation decreases or increases their asks de-
pending on AABS selling strategy and the availabil-
ity of green energy. If green energy supply is bigger
than demand, the price for gray energy goes down,
otherwise it goes up. The idea is to discourage con-
sumers and prosumers of using gray energy. This
way, if gray energy price is higher than their reser-
vation price, they will try to shift loads. Nonetheless,
even if the price is high and green energy is not avail-
able, they will have to use gray energy anyway.
To decrease or increase gray energy prices, the
AABS’ L
2
parameter (Wang and Wang, 2013), which
is used to modify the substation’s reservation price, is
continuously adapted using Equation 1.
L
2
=
(
L
2
− α× (GS/PwD) if GS > PwD
L
2
+ α× (GS/PwD) otherwise
(1)
where GS is the supply of green energy, PwD
is the power demand and α is a random value be-
tween 0.001 and 0.005. The reservation price of
the substation is initially fixed at 0.2 Euro, which
changes depending on L2 and is a bit lower than the
maximum price for green energy (see Section 3.1.1).
Reservation prices for consumers and prosumers are
randomly determined between 0.15 and 0.30 Euro.
The rest of AABS parameters are tuned as suggested
in (Wang and Wang, 2013).
3.2 Physical Subsystem
3.2.1 Overall Architecture
In this work we use real-world data that has been pro-
vided by a Belgian energy retailer. The physical set-
ting contains prosumers that are equipped with so-
lar panels, which allows them to generate their own
power. Both, consumers and prosumers have smart
meters that report to the substation the amount of en-
ergy being absorbed from and injected to the grid. As
meters only report the injected energy after prosumers
satisfied their own demand, we do not have a full pic-
ture of the actual energy being produced. The same
applies for the absorbed energy that is reported to the
substation, i.e. we do not have information about the
overall energy being consumed by prosumers as part
of it is satisfied with their solar panels. Consequently,
we do not have information about prosumers’ internal
energy consumption and production but only about
energy flows between the meters and the substation.
Furthermore, the measurements take place every 15
minutes, which are standard time slots in the electric-
ity system (Bush, 2014).
3.2.2 Storage
In our setting we assume prosumers are the only ones
using batteries since they can generate their own en-
ergy and store their excess after satisfying own con-
sumption. Although commercial batteries offer stor-
age capabilities in the range of 4 to 13 kWh, we ran-
domly assign prosumers storage in the range of 4 to 7
kWh. E.g. Tesla’s powerwall offers storage of 7 and
10 kWh (Tesla, 2016), whereas Bosch’s offers stor-
age of 4.4 and 13.2 kWh (Bosch, 2016) respectively.
Moreover, to the best of our knowledge, only small
capacities per prosumer have been properly tested and
installed within current pilots. E.g. within the project
Grid4EU, home batteries with 4kWh capacity have
been already installed in the French region of Car-
ros (Grid4eu, 2016). Regardless of the capacity of the
battery, we assume they have an efficiency of 90%, for
both charge and discharge, which is a lower bound to
the efficiency already provided by commercial batter-
ies. E.g. Tesla and Bosch respectively report 93%
and 97.7% efficiency for storage solutions that also
include power inverters (Tesla, 2016; Bosch, 2016).
Integration of Load Shifting and Storage to Reduce Gray Energy Demand
157

3.2.3 Load Shifting
As previously reported in (Mert et al., 2008), loads
associated to devices such as washing machines, dish
washers, tumble dryers and air conditioners might
be “easily” shiftted since they not only account for
20% to 30% of the overall consumption (Paatero and
Lund, 2006) but also presented the highest willing-
ness to postpone start according to residential cus-
tomers (Mert et al., 2008). In this way, when green
energy is not available, we assume 20% to 30% of
consumers’ and prosumers’ loads can be shifted to re-
duce consumption of gray energy. Although loads can
be shifted to time slots in which green energy is abun-
dant, loads cannot be shifted for an unlimited amount
of time. Realistic times to postpone the start of loads
are between 30 min to 3 hours, i.e. 2 to 12 slots, as
reported in (Mert et al., 2008).
Likewise, we also assume a waiting time before a
consumer/prosumer can delay another load again. We
randomly assign waiting times to consumers and pro-
sumers in the range of 48 and 96 slots, which means
that they will have to wait at least half day before de-
laying another load. Furthermore, since consumers
and prosumers could all try to shift loads at the same
time, we need to avoid such case too as it may gener-
ate demand peaks at a further stage, e.g. when their
time slots expire and they need to re-start loads. To
this aim, whenever a consumer or prosumer wants to
start the shift of a load, (s)he can only do it with a
probability of 0.5. If probability is in her/his favour at
that time slot, (s)he can start shifting the load, other-
wise (s)he will have to try again in the next time slot.
In this way, we aim at constraining the start of load
shifting as well as at spreading controllable devices’
loads through a full day.
Finally, to allow load shifting, consumers and pro-
sumers use a “set and forget” approach in which they
pre-set the loads that can be shifted (e.g. washing ma-
chines, dish washers or tumble dryers) as well as the
time they can be delayed, i.e. a number between 2
and 12 slots. In addition, as load shifting depends on
whether green energy is available or not, we assume
that information about availability could be poten-
tially delivered via internet, sms, or display directly
on the appliance (Mert et al., 2008).
4 PRELIMINARY RESULTS
4.1 Simulation Settings
To understand the impact of load shifting and storage
for gray energy demand reduction and energy trade,
we use a multi-agent system that is modeled and im-
plemented in Repast simphony (North et al., 2013).
The multi-agent system is fed with real consumption
and production data provided by a Belgian energy
retailer. In our simulations, consequently, we use a
week of real consumption and production of electric-
ity within a typical Belgian district, which is com-
posed of 54 consumers and six prosumers equipped
with solar panels and batteries. Storage capacity
for batteries is randomly assigned between 4 and 7
kWh. Finally, due to the plausible increase of pro-
sumers within the electricity system, and as an at-
tempt to understand future scenarios, we also present
results for settings containing higher percentage of
prosumers (Rickerson et al., 2014).
4.2 Energy Consumption
In this section we present plots of the average amount
of gray and green energy being consumed by both
prosumers and consumers. We show values for a typ-
ical Belgian district, i.e. prosumers account for 10%
of households, as well as for futuristic/plausible set-
tings in which the percentage of prosumers are re-
spectively 30% and 50%. To achieve these percent-
ages, we fed real consumption and production data of
18 and 30 prosumers respectively in our simulations.
These numbers represent the 30% and 50% of house-
holds in a typical Belgian district (usually composed
of 60 households).
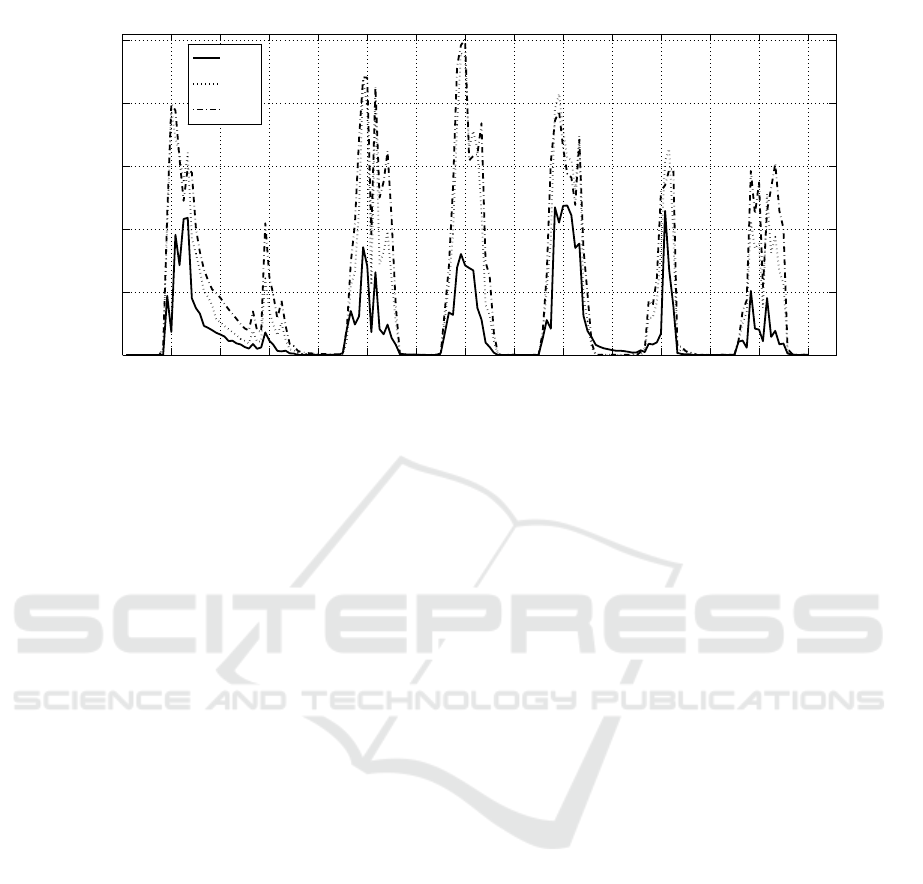
Figure 1 shows the average consumption of green
energy for different percentage of prosumers for a
whole week. As one can see, the more prosumers,
the more green energy being consumed. Although
main consumption occurs at daytime hours, when
prosumers inject their excess of production after cov-
ering their own demand, consumption of green energy
can also be observed at night time thanks to storage.
For instance, as seen in Figure 1, green energy con-
sumption is observed during night hours between the
first and second day.
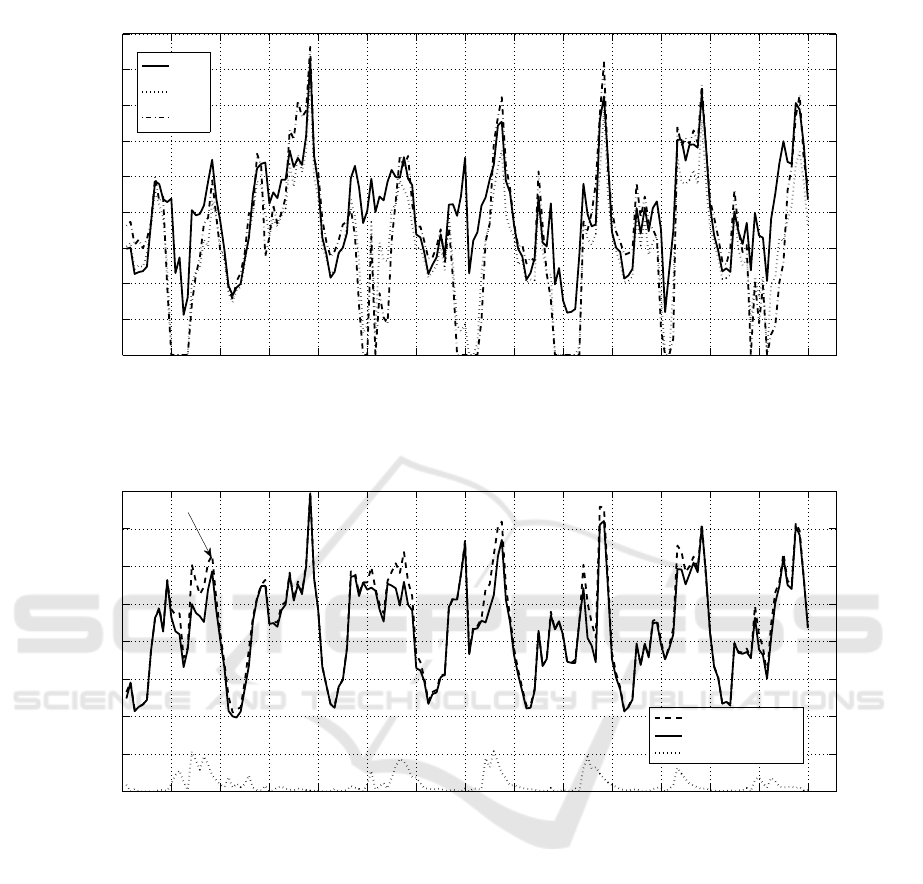
In the same vein, Figure 2 depicts the average con-
sumption of gray energy, which shows that the more
prosumers, the less gray energy is demanded during
daytime hours. Unlike, green energy consumption,
gray energy consumption occurs mostly at late after-
noon and early morning, when green energy is not
generated. Consequently, it is extremely important to
reduce the overall energy consumption during those
periods as prosumers and consumers will mostly use
gray energy.
SMARTGREENS 2016 - 5th International Conference on Smart Cities and Green ICT Systems
158
0
0.05
0.1
0.15
0.2
0.25
12h
24h
12h
24h
12h
24h
12h
24h
12h
24h
12h
24h
12h
24h
kWh
10%
30%
50%
Figure 1: Average consumption of green energy per household for different percentage of prosumers in a district. Note that
green energy can also be consumed at night time thanks to storage and load shifting.
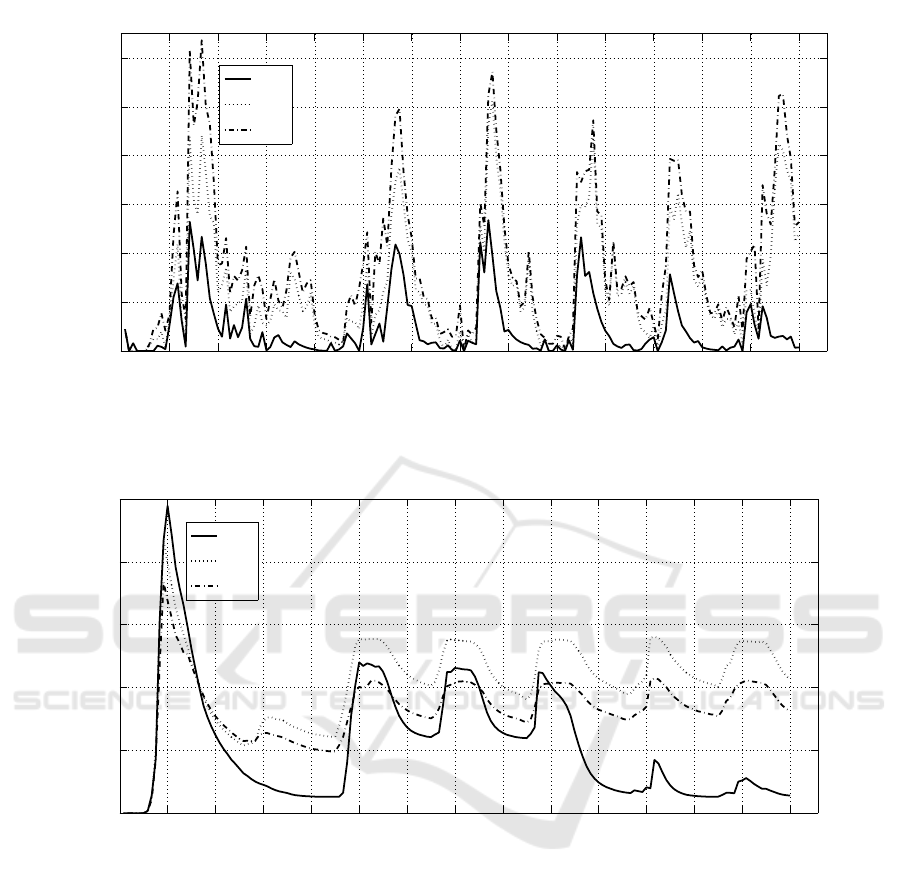
4.3 Consumption Reduction
In order to determine whether reduction in consump-
tion can be achieved using load shifting and storage,
we have analyzed the overall consumption, i.e. green
and gray consumption, of a typical Belgian district for
a whole week. We measured the average energy con-
sumption when neither load shifting nor storage are
available (original consumption) as well as the case
when both are available (adapted consumption). Fig-
ure 3 shows both measures, original (dashed line) and
adapted (solid line) consumption, which represent the
average demand the susbtation is expected to face.
Moreover, it also shows the average reduction being
achieved (dotted line).
Although peak reduction can be achieved for some
days, such reduction is moderate as the highest re-
duction is around 0.05 kWh, which is approximately
a 15% reduction compared to the original consump-
tion. Nonetheless, most of the peak reduction takes
place at night time, when green energy is not gener-
ated, which implies that demand for gray energy will
most likely decrease.
As we also wanted to determine whether a higher
reduction can be achieved for future settings, we in-
creased the percentage of prosumers per district. Fig-
ure 4 shows the average reduction in districts contain-
ing 10%, 30% and 50% of prosumers. The highest
peak reduction is achieved by the district with 50%
prosumers and is above 0.12 kWh, which represents
a reduction of at least 30% compared to the origi-
nal consumption. Nonetheless, one must be aware
that such reduction is only possible by providing con-
sumers and prosumers with load shifting capabilities
as well as providing storage capabilities to prosumers.
The performance of both capabilities is described in
the following sections, i.e. Sections 4.4 and 4.5.
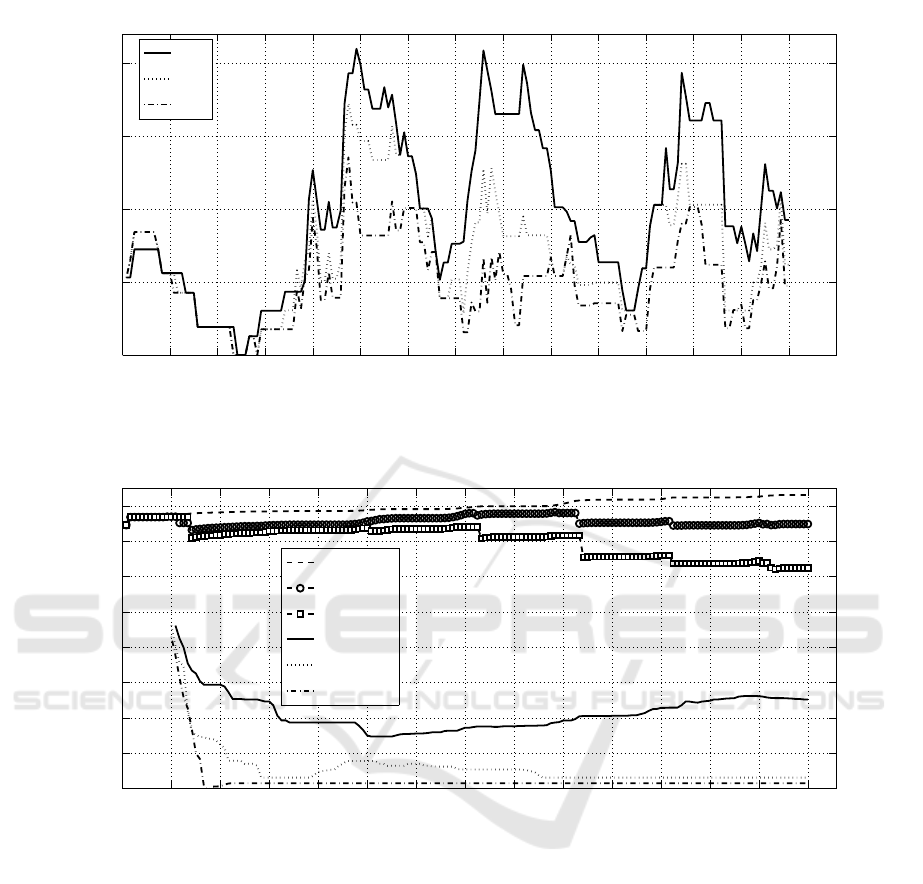
4.4 Storage
To determine how much green energy can be stored
after prosumers cover their own needs, we measure
the average state of charge (SOC), which indicates
the percentage of occupancy of prosumers’ batteries,
i.e. how full batteries are, where 0% = empty and
100% = full. Figure 5 shows the average SOC per
prosumer. It depicts three lines, one per each setting,
i.e. districts containing 10%, 30% and 50% of pro-
sumers. Batteries have capacities among 4kWh and
7kWh.
As it can be observed, batteries constantly charge
and discharge their energy to meet energy demand.
Discharge usually starts around late afternoon (the
hours when green energy production decreases),
whereas charge starts before noon. Furthermore, dis-
charge provides green energy to be consumed at night
time as observed in Figure 1.
Batteries, however, only reach full charge during
the first day. This aspect should be considered before
installing batteries with big capacity as they may not
always be filled, which means a waste of storage ca-
pacity. Likewise, two more findings should also be
considered. First of all, load shifting could help to fill
batteries as initial consumption can be delayed (see
Figure 6), which may give time to store green energy
as seen during the first day in Figure 5. The second
finding is related to the drop of production during the
second day. Drops in production will not allow batter-
Integration of Load Shifting and Storage to Reduce Gray Energy Demand
159
0
0.05
0.1
0.15
0.2
0.25
0.3
0.35
0.4
0.45
12h
24h
12h
24h
12h
24h
12h
24h
12h
24h
12h
24h
12h
24h
kWh
10%
30%
50%
Figure 2: Average consumption of gray energy per household for different percentage of prosumers in a district using storage
and load shifting. Note that when the percentage of prosumers is above 30%, consumption of gray energy reduces considerably
during daylight hours.
0
0.05
0.1
0.15
0.2
0.25
0.3
0.35
0.4
Day 1 Day 2 Day 3 Day 4 Day 5 Day 6 Day 7
12h
24h
12h
24h
12h
24h
12h
24h
12h
24h
12h
24h
12h
24h
kWh
Original Consumption
Adapted Consumption
Reduction
Peak reduction
Figure 3: Average values for original and adapted consumption (storage and load shifting capabilities) per household in a
typical Belgian district with 10% prosumers. The dotted line represents the average reduction in consumption per household.
ies to be completely filled as they will have to provide
green energy at night time. Moreover, since green
energy is also scarce due to production drops, more
loads would be shifted, which forces batteries to pro-
vide energy when the associated time slots expire.
In this way, as load shifting directly impacts on
the charge and discharge of batteries, an optimal plan-
ning of storage capacity that takes into account load
shifting is also required. Such planning will allow to
efficiently use storage (i.e. no waste of capacity) and
provide more flexibility for load shifting. Nonethe-
less, it is clear that storage helps to meet both original
and shifted demands. The performance of load shift-
ing is presented in the next section.
4.5 Load Shiftting
Although load shifting aims at curtailing energy de-
mand by delaying the start of controllable devices
(e.g. washing machines, dish washers and tumble dry-
ers), the delay cannot last for more than three hours,
i.e. up to 12 time slots (Mert et al., 2008). In this
way, our mechanism allows to shift chunks of energy
consumption whose dimensions are time and power
(watts). Shifted chunks have a time length of 2 to 12
time slots and a power given by the amount of de-
mand being curtailed (i.e. 20% to 30% of the overall
consumption). When the chunks of all consumers and
prosumers are aggregated, they can provide a consid-
SMARTGREENS 2016 - 5th International Conference on Smart Cities and Green ICT Systems
160
0
0.02
0.04
0.06
0.08
0.1
0.12
Day 1 Day 2 Day 3 Day 4 Day 5 Day 6 Day 7
12h
24h
12h
24h
12h
24h
12h
24h
12h
24h
12h
24h
12h
24h
kWh
10%
30%
50%
Figure 4: Average reduction in consumption per household using storage and load shifting capabilities for different percentage
of prosumers.
0
20
40
60
80
100
Day 1 Day 2 Day 3 Day 4 Day 5 Day 6 Day 7
12h
24h
12h
24h
12h
24h
12h
24h
12h
24h
12h
24h
12h
24h
State of Charge (%)
10%
30%
50%
Figure 5: Batteries’ average state of charge (SOC) per prosumer for different percentage of prosumers. 0% = empty and 100%
= full.
erable amount of curtailment per slot as depicted in
Figure 6.
Figure 6 shows the total demand being curtailed
per time slot for three districts composed of 10%,
30% and 50% prosumers respectively. The highest
amount of curtailment is observed in districts with
low percentage of prosumers, i.e. 10% and 30%. The
reason is that since green energy is scarce, i.e. prices
for green and gray energy go up (see also Section 4.6),
consumers and prosumers try to shift more loads. Fur-
thermore, as can be seen, it is possible to curtail up to
2kWh within a single time slot, e.g. before third day’s
noon.
Finally, regardless of the amount of demand be-
ing delayed, a shifted load is always re-started either
when green energy becomes available or before the
end of its time slot, so they are never delayed more
than three hours (12 time slots).
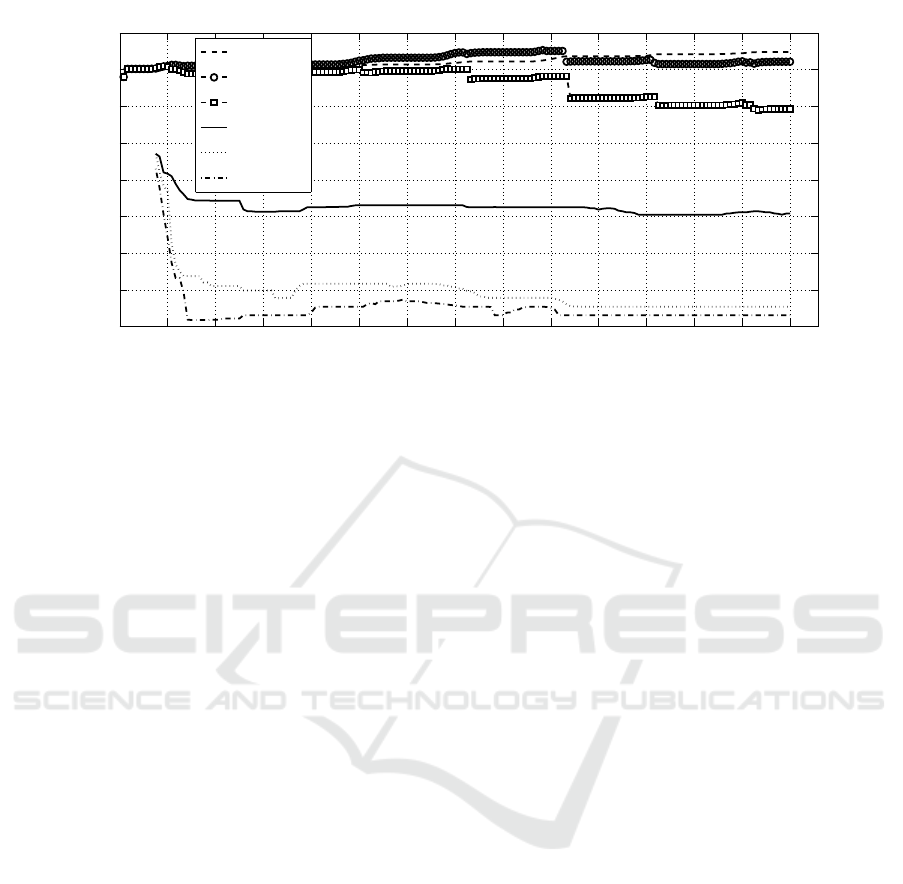
4.6 Price History
As not only energy-related measures are important to
understand smart grids, but also economic aspects, we
have also analyzed the price behaviour of both green
and gray energy. The analysis of energy prices pro-
vides an idea about the expected profits or losses in a
Integration of Load Shifting and Storage to Reduce Gray Energy Demand
161
0
0.5
1
1.5
2
Day 1 Day 2 Day 3 Day 4 Day 5 Day 6 Day 7
12h
24h
12h
24h
12h
24h
12h
24h
12h
24h
12h
24h
12h
24h
kWh
10%
30%
50%
Figure 6: Total demand being curtailed per slot over seven days.
0.12
0.14
0.16
0.18
0.2
0.22
0.24
0.26
0.28
Day 1 Day 2 Day 3 Day 4 Day 5 Day 6 Day 7
12h
24h
12h
24h
12h
24h
12h
24h
12h
24h
12h
24h
12h
24h
Euro/kWh
Gray10%
Gray30%
Gray50%
Green10%
Green30%
Green50%
Figure 7: Gray and green energy prices during a whole week for different percentage of prosumers. Gray energy prices are
mostly determined by the energy retailer but increase or decrease depending on green energy prices. Green energy prices are
ruled by the market and influenced by availability or scarcity of green energy.
given energy market.
Figure 7 shows the behaviour of gray and green
energy prices. Gray energy prices are negotiated be-
tween the substation and consumers/prosumers as ex-
plained in Section 3.1.2, whereas green energy prices
come from a continuous double auction in which the
only participants are prosumers and consumers (see
Section 3.1.1).
On the one hand, the price for green energy shows
a clear pattern, the more prosumers in a district, the
cheaper the price. For instance, the price for green
energy when the district contains 50% of prosumers
is almost 0.12 Euro after the first day, whereas the
price when the district has 10% prosumers is around
0.16 Euro. Moreover, regardless of the percentage of
prosumers, green prices start relatively high and fall
as green energy becomes abundant.
On the other hand, as an attempt to discour-
age the use of gray energy, the substation increases
and decreases the price of gray energy based on
whether green energyis abundant or not (see also Sec-
tion 3.1.2). When abundant, the price for gray en-
ergy goes down. Otherwise, the price goes up. Con-
sequently, as seen in Figure 7, the gray energy price
follows the overall behaviour of green energy prices.
It drops when green energy prices drop and increases
SMARTGREENS 2016 - 5th International Conference on Smart Cities and Green ICT Systems
162
0.12
0.14
0.16
0.18
0.2
0.22
0.24
0.26
0.28
Day 1 Day 2 Day 3 Day 4 Day 5 Day 6 Day 7
12h
24h
12h
24h
12h
24h
12h
24h
12h
24h
12h
24h
12h
24h
Euro/kWh
Gray10%
Gray30%
Gray50%
Green10%
Green30%
Green50%
Figure 8: Gray and green energy prices during a whole week without storage facilities and for different percentage of pro-
sumers. Prices for green energy are slightly higher than in Figure 7.
otherwise, which is the kind of behaviour we want to
promote as consumers may be less willing to with-
draw energy during those periods.
Finally, we have also tested the behaviour of green
and gray energy prices when no storage capabilites
are used. Figure 8 shows the behaviour of both prices.
Although the overall behaviour is similar to the one in
Figure 7, one thing is clear,the prices for green energy
are slightly higher, which may suggest that storage
helps to keep the price of green energy low. In our
case, a possible explanation of the influence of stor-
age in energy prices is that prosumers discharge their
batteries when no green energy is generated, which
may keep relatively constant the supply of green en-
ergy, i.e. green energy is less scarce and its price does
not increase. Even though this aspect requires a more
elaborated analysis, energy retailers as well as pro-
sumers should acknowledge this when considering to
invest in storage facilities since they could directly in-
fluence energy prices, which may potentially offer a
good return on investment. In this way, retailers could
try to keep profitable prices, whereas prosumers may
try to ensure low prices when buying and high prices
when selling energy. Moreover, the impact of storage
in energy prices has been previously observed when
energy retailers are equipped with storage (Pr¨uggler
et al., 2011).
5 CONCLUSIONS AND FUTURE
WORK
We present the application of a multi-agent system
to analyze the impact of load shifting and storage to
reduce gray energy demand. In addition, we simu-
late energy markets in which green and gray (non-
environmentally friendly) energy are locally traded.
Green energy is traded using NRGcoins under the
NRG-X-Change mechanism, whereas gray energy is
traded in Euro via a bi-direcctional negotiation be-
tween an energy retailer and users of energy, i.e. con-
sumers and prosumers.
To reduce energy demand, users apply load shift-
ing and storage capabilities. Storage, however,is only
available for prosumers as they can generate and store
their own power.
Results show that reduction is possible mostly
during night time hours, when no green energy is gen-
erated. Although, the highest reduction takes place
when districts contain 50% of prosumers, (moderate)
reductions are also observed for lower percentages,
which encourages us to continue exploring more in-
telligent strategies to achieve higher reductions.
Moreover, as NRG-X-Change is a trading mech-
anism based on a double auction, i.e. several actors
trying to buy and sell resources, other mechanisms ap-
plying a similar approach may take advantage of our
results. For instance, in mechanisms such as Power-
Matcher, energy aggregators can further exploit the
use of storage to influence price curves by strate-
gically charging and discharging batteries. Further-
more, regarding the integration of load shifting and
storage, an analysis as the one presented here can be
done for other innovative energy markets, i.e. using
multi-agent systems and real data to explore future but
still realistic scenarios.
In this vein, our future work will focus on apply-
ing other strategies to exploit storage and load shift-
Integration of Load Shifting and Storage to Reduce Gray Energy Demand
163

ing. For instance, cooperative and coordinated ways
to charge and discharge batteries can be applied to
not only cope with demand but also influence energy
prices. Similarly, load shifting can also be coordi-
nated among prosumers and consumers. On the one
hand, we can make sure that they all do not delay or
re-start loads at the same time. On the other hand,
we can also maximize the amount of demand being
curtailed and provide more flexibility to retailers.
Additionally, we would like to investigate optimal
planning for storage location (e.g. retailers and nor-
mal consumers owning batteries) and capacity as it
can bring economic and energy-related benefits. The
former because storage owners can profit from trading
energy. The latter because well-dimensioned capacity
can provide better flexibility for load shifting.
Finally, regarding prices for gray energy, we want
to explore different pricing schemes, e.g. time-of-
use, critical-peak or real-time pricing. These schemes
could potentially provide better responses from cus-
tomers and improve energy balancing. Nonetheless,
the final message is that to enhance the integration of
renewables into the smart grid, combination of stor-
age and DR programs is worth exploring for eco-
nomic and environmental reasons (Niesten and Alke-
made, 2016).
ACKNOWLEDGMENTS
This research has been funded by the European
Union’s Seventh Programme for research, technolog-
ical development and demonstration under the grant
agreement number 324321, project SCANERGY. At
the time of writing, Iv´an Razo-Zapata was a postdoc-
toral researcher at VUB.
REFERENCES
Aghaei, J. and Alizadeh, M.-I. (2013). Demand response
in smart electricity grids equipped with renewable en-
ergy sources: A review. Renewable and Sustainable
Energy Reviews, 18:64 – 72.
Bosch (2016). Bpt-s 5 hybrid solar power stor-
age. http://bosch-power-tec.com/en/bpte/ pro-
dukte/storage
solutions/bpt s 5 hybrid/vs 5 hybrid.
[Online; accessed 04-February-2016].
Bush, S. F. (2014). Smart Grid: Communication-Enabled
Intelligence for the Electric Power Grid. IEEE Press.
Capodieci, N., Pagani, G. A., Cabri, G., and Aiello, M.
(2011). Smart meter aware domestic energy trad-
ing agents. In Proceedings of the IEEMC ’11 Work-
shop onE-energy Market Challenge, pages 1–10, New
York, NY, USA. ACM.
Gottwalt, S., Ketter, W., Block, C., Collins, J., and Wein-
hardt, C. (2011). Demand side management—a sim-
ulation of household behavior under variable prices.
Energy Policy, 39(12):8163 – 8174. Clean Cooking
Fuels and Technologies in Developing Economies.
Grid4eu (2016). Nice grid demonstrator. http://www.nice
grid.fr/. Online; accessed 04-February-2016.
Ilic, D., Da Silva, P., Karnouskos, S., and Griesemer, M.
(2012). An energy market for trading electricity in
smart grid Neighbourhoods. In 6th IEEE Interna-
tional Conference on Digital Ecosystems Technolo-
gies (DEST), pages 1–6.
Kok, J. K., Warmer, C. J., and Kamphuis, I. G. (2005). Pow-
ermatcher: Multiagent control in the electricity infras-
tructure. In Proceedings of the Fourth International
Joint Conference on Autonomous Agents and Multia-
gent Systems, AAMAS ’05, pages 75–82, New York,
NY, USA. ACM.
Ma, H. and Leung, H.-F. (2007). An adaptive attitude bid-
ding strategy for agents in continuous double auc-
tions. Electronic Commerce Research and Applica-
tions, 6(4):383 – 398.
Mert, W., Suschek-Berger, J., and Tritthart, W. (2008). Con-
sumer acceptance of smart appliances. Technical re-
port, EIE project Smart Domestic Appliances in Sus-
tainable Energy Systems (Smart-A).
Mihaylov, M., Jurado, S., Avellana, N., Razo-Zapata, I.,
Van Moffaert, K., Arco, L., Bezunartea, M., Grau, I.,
Ca˜nadas, A., and Now´e, A. (2015). Scanergy: a scal-
able and modular system for energy trading between
prosumers. In Proceedings of the International Con-
ference on Autonomous Agents and Multiagent Sys-
tems, AAMAS ’15, pages 1917–1918.
Mihaylov, M., Jurado, S., Van Moffaert, K., Avellana, N.,
and Now´e, A. (2014). Nrg-x-change: : A novel mech-
anism for trading of renewable energy in smart grids.
In 3rd International Conference on Smart Grids and
Green IT Systems (SmartGreens).
Nakamoto, S. (2008). Bitcoin: A peer-to-peer electronic
cash system.
Niesten, E. and Alkemade, F. (2016). How is value created
and captured in smart grids? a review of the litera-
ture and an analysis of pilot projects. Renewable and
Sustainable Energy Reviews, 53:629–638.
North, M. J., Collier, N. T., Ozik, J., Tatara, E. R., Macal,
C. M., Bragen, M., and Sydelko, P. (2013). Com-
plex adaptive systems modeling with repast simphony.
Complex adaptive systems modeling, 1(1):1–26.
Paatero, J. V. and Lund, P. D. (2006). A model for generat-
ing household electricity load profiles. International
Journal of Energy Research, 30(5):273–290.
Pr¨uggler, N. (2013). Economic potential of demand re-
sponse at household level—are central-european mar-
ket conditions sufficient? Energy Policy, 60:487 –
498.
Pr¨uggler, N., Pr¨uggler, W., and Wirl, F. (2011). Storage and
demand side management as power generator’s strate-
gic instruments to influence demand and prices. En-
ergy, 36(11):6308 – 6317.
SMARTGREENS 2016 - 5th International Conference on Smart Cities and Green ICT Systems
164

Ramchurn, S. D., Vytelingum, P., Rogers, A., and Jennings,
N. R. (2012). Putting the ’smarts’ into the smart grid:
A grand challenge for artificial intelligence. Commun.
ACM, 55(4):86–97.
Rickerson, W., Couture, T., Barbose, G. L., Jacobs, D.,
Parkinson, G., Chessin, E., Belden, A., Wilson,
H., and Barrett, H. (2014). Residential prosumers:
Drivers and policy options (re-prosumers). Technical
report, International Energy Agency (IEA).
Room, B. and Institute, W. R. (2010). Global ecolabel
monitor 2010: Towards transparency. http://www.eco
labelindex.com/downloads/Global
Ecolabel Monitor
2010.pdf. [Online; accessed September,2015].
Schuler, R. (2010). The smart grid: a bridge between
emerging technologies society and the environment.
The Bridge, 40(1):42–49.
Shoham, Y. and Leyton-Brown, K. (2008). Multiagent sys-
tems: Algorithmic, game-theoretic, and Logical Foun-
dations. Cambridge University Press.
Siano, P. (2014). Demand response and smart grids—a
survey. Renewable and Sustainable Energy Reviews,
30:461–478.
Tesla (2016). Powerwall. http://www.teslamotors.com/
powerwall. [Online; accessed February,2016].
van Werven, M. J. and Scheepers, M. J. (2005). The chang-
ing role of energy suppliers and distribution system
operators in the deployment of distributed generation
in liberalised electricity markets. Technical report,
ECN-C–05-048, ECN.
VEA (2014). Vlaams energieagentschap - rapport 2013/2.
http://www2.vlaanderen.be/economie/energiesparen/
milieuvriendelijke/monitoring
evaluatie/2013/20130
628Rapport2013
2-Deel2Actualisatie-OT Bf.pdf.
[Online; accessed 23-September-2015].
Vytelingum, P., Cliff, D., and Jennings, N. (2008). Strate-
gic bidding in continuous double auctions. Artificial
Intelligence, 172(14):1700 – 1729.
Wang, Z. and Wang, L. (2013). Adaptive negotiation agent
for facilitating bi-directional energy trading between
smart building and utility grid. IEEE Transactions on
Smart Grid, 4(2):702–710.
Integration of Load Shifting and Storage to Reduce Gray Energy Demand
165
