
Facial Paresis Index Prediction by Exploiting Active Appearance Models
for Compact Discriminative Features
Luise Modersohn and Joachim Denzler
Computer Vision Group, Friedrich Schiller University of Jena, Jena, Germany
Keywords:
Facial Paresis, Facial Paralysis, Active Appearance Model, Random Decision Forest, Stennert Index,
House-Brackmann Index.
Abstract:
In the field of otorhinolaryngology, the dysfunction of the facial nerve is a common disease which results
in a paresis of usually one half of the patients face. The grade of paralysis is measured by physicians with
rating scales, e.g. the Stennert Index or the House-Brackmann scale. In this work, we propose a method to
analyse and predict the severity of facial paresis on the basis of single images. We combine feature extraction
methods based on a generative approach (Active Appearance Models) with a fast non-linear classifier (Random
Decision Forests) in order to predict the patients grade of facial paresis. In our proposed framework, we make
use of highly discriminative features based on the fitting parameters of the Active Appearance Model, Action
Units and Landmark distances. We show in our experiments that it is possible to correctly predict the grade of
facial paresis in many cases, although the visual appearance is strongly varying. The presented method creates
new opportunities to objectively document the patients progress in therapy.
1 INTRODUCTION
Facial paresis is an often occurring disease and caused
by a dysfunction of the facial nerve (Nervus facialis).
Typical symptoms are a complete or partial loss of
control for one side of the face with visible asym-
metries between the hemispheres. Facial paresis
can occur in every age (Alberti and Biagioni, 1972;
Peitersen, 2002) and regardless of gender (Peitersen,
2002).
The causes of facial paresis are manifold and
range from brain damage in certain areas over virus
infections (Lyme disease) to muscle weakness (Myas-
thenia gravis) (Peitersen, 2002). However, in some
cases no direct cause can be determined as in the case
of Bell’s palsy. All causes of the illness have in com-
mon that patients are not able to move one side of their
face and possibly suffer from both their disease and a
decreased life quality, e.g. problems with eating and
drinking or to be unable to close one eye completely
(Guntinas-Lichius et al., 2007).
The intensity of a facial paresis can be measured
in different ways, as for example by rating the ability
to control one specific muscle of the face (Stennert
et al., 1977) or by judging the ability of facial move-
ment during exercises (House and Brackmann, 1985).
Both are determined by visual assessment and there-
fore rely on the clinical experience of the rating physi-
cian. With the help of these indices the actual degree
of paralysis will be measured and therefore also a pos-
sible progress of recovery, as presented in this work.
The automated recognition of those indices will
assist physicians to rate and compare patients facial
paresis severity and identify potential recovery im-
mediately. For analysis, additional equipment is not
needed. Therefore it is possible to rate patients pare-
sis index from a distance, potentially at home.
The House-Brackmann index is the most common
grading system for facial paresis, developed in 1985
by (House and Brackmann, 1985). It consists of six
grades, where a normal face is rated with grade I and
a completely paralysed half of the face with no move-
ment at all is rated with grade VI. The detailed de-
scription for every grade can be seen in Table 1.
In contrast to the House-Brackmann-Grading
scale, the Stennert index does not rate the quality of
facial movement as a whole. It is divided into the
Stennert Index in Motion (SIM) and the Stennert In-
dex at Rest (SIR). The SIR is determined on the pa-
tient completely relaxed face. However, for the grad-
ing of the SIM the patient has to perform exercises
were each exercise activates only one facial muscle
or group of muscles (nose wrinkling, eye closure, lip
puckering, etc.). For every patient a physician has to
Modersohn, L. and Denzler, J.
Facial Paresis Index Prediction by Exploiting Active Appearance Models for Compact Discriminative Features.
DOI: 10.5220/0005787602710278
In Proceedings of the 11th Joint Conference on Computer Vision, Imaging and Computer Graphics Theory and Applications (VISIGRAPP 2016) - Volume 4: VISAPP, pages 271-278
ISBN: 978-989-758-175-5
Copyright
c
2016 by SCITEPRESS – Science and Technology Publications, Lda. All rights reserved
271

Table 1: House-Brackmann Grading System for facial paresis (House and Brackmann, 1985).
Grade Dysfunction Characteristics
I Normal Normal function in all areas
II
Mild Gross: Slight weakness noticeable on close inspection; may have very
slight synkinesis
At rest: normal symmetry and tone
Motion: Forehead: moderate to good function
Eye: complete closure with minimum effort
Mouth: slight asymmetry
III
Moderate Dysfunction Gross: obvious but not disfiguring difference between two sides; noticeable
but not severe synkinesis, contracture, and/or hemifacial spasm
At rest: normal symmetry and tone
Motion: Forehead: slight to moderate movement
Eye: complete closure with effort
Mouth: slightly weak with maximum effort
IV
Moderately severe Dysfunction Gross: obvious weakness and/or disfiguring asymmetry
At rest: normal symmetry and tone
Motion: Forehead: none
Eye: incomplete closure
Mouth: asymmetric with maximum effort
V
Severe Dysfunction Gross: barely perceptible motion
At rest: asymmetry
Motion: Forehead: none
Eye: incomplete closure
Mouth: slight movement
VI Total paralysis No movement
Table 2: Grading System for facial paresis (Stennert et al.,
1977).
Questions
SIR
Difference between lid fissure larger than
3mm?
Existing ectropion?
Nasolabial groove not visible?
Height difference between mouth corners
more than 3mm?
SIM
Frowning possible (raise eyebrow more
than 50%)?
Visible fissure in sleeping position (eyes
closed)?
Visible fissure while squinning?
Canine teeth (top and bottom) not visible
when showing teeth?
Upper second incisor not visible when
showing teeth (full width)?
Difference of distance between philtrum
and mouth corner more than 50% com-
pared to healthy side while pursing lips?
answer the corresponding questions (see Table 2) with
yes or no. The sum of answers form the final SIM.
The actual available tools and works either need
physical markers on the patients face, used a very
small patients dataset or did not use a common grad-
ing system. Some methods use physical markers in
the face that were automatically detected and used
for distance calculation and comparison (Wachtman
et al., 2001). Thus it is a non-invasive technique, it is
not irritation free as markers have to be painted on the
patients face. Only to detect the presence of a facial
paresis automatically is not sufficient as the grade of
the disease is also important to measure the progress
of therapy (Gebhard et al., 2000). To rate a patients
grade of paresis, the definition of new rating systems
based on pre-calculated facial features seems feasible
(Wang and Qi, 2005). Unfortunately those kind of
indices were not accepted by physicians. This prob-
lem can be solved by using common rating systems
like the House-Brackmann scale. Since the difference
between grade II-III and IV-V is small, it is possible
to use a reduced House-Brackmann index with only
four degrees of paresis (Gebhard et al., 2001). With
the use of local binary patterns or the Hamming dis-
tance between the left and the right side of the face
and a classification method the entire HB index can
be predicted(He et al., 2009; Song et al., 2013).
We present a novel and fast non-invasive and
irritation-free method for the automated prediction
of grades for single-sided facial paresis patients us-
ing Random Decision Forests (Breiman, 2001) as de-
scribed in Section 3. Since the method only uses im-
ages for prediction, there is no need for the patient
being present during the analysis.
In Section 2, we give an overview about related
work. The used methods which are the base of our
approach and the proposed framework are presented
in Section 3. In Section 4, we evaluate our framework
VISAPP 2016 - International Conference on Computer Vision Theory and Applications
272

on real-world datasets and discuss the results.
2 RELATED WORK
A method to quantify facial motion was proposed by
(Wachtman et al., 2001). Based on physical mark-
ers in the subjects face they tracked the movement of
these markers and calculated the distances between
them over time. The results were plotted and shown
to experts for further use. Their approach was not a
fully automated grading system but supposed to assist
physicians in the clinic or the doctor’s office.
(Gebhard et al., 2000) published an image-based
system to detect single-sided facial paresis without
the usage of physical markers. They extracted the
person in the image via segmentation and calculated
asymmetries between the left and the right hemi-
sphere. With this information, they were able to dis-
tinguish between healthy persons or patient diagnosed
with facial paresis.
To detect not only patients with facial paresis but
also the grades of facial paralysis, (Gebhard et al.,
2001) used image sequences of patients perform-
ing exercises. They calculated the difference im-
age and the optical flow between the healthy and
the sick hemisphere of patients. With these fea-
tures they trained a classifier to predict four grades
of facial paresis. These grades based on the House-
Brackmann index, however were condensed to four
possible grades.
(He et al., 2009) presented an automated dis-
criminative grading system for facial paresis pa-
tients based on the House-Brackmann-Score by using
SVMs trained on Local Binary Patterns (LBP). They
tested and trained their method on a video dataset and
achieved good results. Unfortunately their dataset is
not publicly available, thus comparison is not possi-
ble.
A more global method was developed by (Delan-
noy and Ward, 2010). They proposed an approach
based on Active Appearance Models (AAM). After
fitting the AAM to the target image they calculated
the distances between the points with respect to the
hemisphere and used these information to predict a
facial paresis score. Although they did not test their
method on real patients data they generally showed
AAMs can be used to predict the House-Brackmann
index.
A prediction method for the House-Brackmann
score based only on a few single images was devel-
oped (Song et al., 2013). After detecting the edges
of a patients image they calculated the Hamming dis-
tance for facial symmetry. The indices were pre-
dicted by an SVM combined with an Emergent Self-
Organising Map. Unfortunately their training and test
dataset only contained 46 patient data and 21 images
of healthy persons. As in (He et al., 2009) the used
dataset is not publicly available, hence direct compar-
ison is not possible.
The work of (Haase et al., 2013) used AAMs on
facial paresis patient images. Based on a Gaussian
Process regression using the AAMs fitting-parameters
the Action Units (AU) of the respective facial side
were predicted.
In this work, we present a novel approach to pre-
dict the severity of a patients facial paresis. The de-
tailed methods are described in the next section.
3 METHODS
To start the analysis of facial paresis patient im-
ages, a proper description method is needed. For the
representation of faces, generative statistical models
like Active Appearance Models (AAM) have demon-
strated to be a powerful technique with applications in
different areas (Cootes et al., 2001; Haase et al., 2014;
Song et al., 2014; Vincent et al., 2010). Although
there are more up-to-date methods for facial landmark
detection to benefit from the AAMs representation of
both shape and texture and use the extracted appear-
ance parameters as features for classification of new
and unseen images.
3.1 Framework
The proposed framework consists of three stages as
seen in Figure 1: Initially the half sided AAM is
trained on images of healthy persons with both neutral
expressions and healthy people performing the exer-
cises as can be seen in Figure 3. This trained AAM
is then fitted on the patients images using multivariate
linear regression (Matthews and Baker, 2004).
Depending on the used features for training the
obtained features from the model fitting have to be
pre-processed. Either the fitting parameters were used
to predict AUs based on a pre-trained Gaussian Pro-
cess regression (Haase et al., 2013) or the absolute
distance between the left and the right side of the face
or the Euclidean distance between the corresponding
landmarks of each side. These information combined
with the labeled facial paresis indices (Stennert or
House-Brackmann index) were now used to train the
classifier.
In our approach, a Random Decision Forest (RDF)
was used to classify facial paresis indices (Breiman,
2001). For classification, also a k-Nearest-Neighbour
Facial Paresis Index Prediction by Exploiting Active Appearance Models for Compact Discriminative Features
273

Figure 1: Overview of the framework for facial paresis in-
dex prediction.
approach and an SVM was tested for index predic-
tion but we obtained much better results by using an
RDF. The optimal parameters for the respective fea-
tures were obtained via a parameter analysis. More
detailed information and results can be found in Sec-
tion 4.
3.2 Active Appearance Models
Based on a number of annotated images I
1
,...,I
n
show-
ing instances of a specific object category, like faces,
AAMs can be automatically trained. The resulting
parametrised model can be fitted to new, yet unknown
images. The model training consists of three parts:
the shape model, the texture model and the appear-
ance model. The shape model is trained on the land-
marks of every image. For this reason, the vectorised
shapes s
1
,...,s
n
are aligned according to their scale, ro-
tation and translation. In combination they form the
matrix S = (s
1
-s
µ
,...,s
n
-s
µ
) where s
µ
denotes the mean
shape. By applying Principle Component Analysis
(PCA) on the matrix S, we obtain the shape eigen-
vectors P
S
. Each shape s
0
can be represented by its
shape parameters p
0
s
:
s
0
= s
µ
+ P
S
· p
0
s
with p
0
s
= P
T
S
(s
0
− s
µ
) (1)
In order to train the texture model, the vectorised and
shape-normalised object textures t
1
,...,t
n
are needed.
Similar to the shape model, PCA is performed to
achieve the texture eigenvectors P
t
. The texture pa-
rameters p
0
s
are defined like the shape parameters
in Equation 1. In the last step the above defined
models are combined to train the appearance model.
Again PCA is applied on the combined and variance-
weighted texture and shape models to obtain the ap-
pearance eigenvectors P
A
. The appearance parameters
p
0
a
can be calculated based on the eigenvectors P
A
and
Figure 2: Shape of an half side AAM.
the shape as well as texture information of an object:
a
0
= P
A
· p
0
a
with p
0
a
= P
T
A
· a
0
(2)
Finally, a thus trained AAM can be fitted on new im-
ages via minimisation of the texture difference be-
tween the image and the model (Matthews and Baker,
2004).
Unfortunately, an AAM is generally trained on the
entire face. This is not sufficient in the case of fa-
cial paresis patients images thus the model will not be
able to deal with the asymmetries. The solution of this
problem is to use an AAM trained only on one hemi-
sphere of a face as done by (Haase et al., 2013; Delan-
noy and Ward, 2010). To obtain as much information
as possible, the training dataset should contain images
with the exercises the patients have to perform. An
half side AAM represented by its shape-forming land-
marks is shown in Figure 2.
Based on the assumption that we have a paralysed
and a healthy side of a face, both hemispheres can be
directly compared to each other by analysing the sides
independently (Song et al., 2013; Haase et al., 2013).
3.3 Facial Feature Extraction
We used three different kinds of features, all based on
the half-sided AAM fitted on the patients image.
First, we used the combined AAM-fitting-
parameters for training. These parameters were used
in three different ways: primarily, all available pa-
rameters were used, ordered by side (right, left) and
the respective exercise the patients had to perform.
We also calculated the absolute distance of both pa-
rameter vectors to obtain the difference between both
hemispheres. By taking the absolute distance of the
parameters, we ensure an independence from the re-
spective paralysed side. Finally, we used only the
parameters of the paralysed hemisphere without the
healthy side.
As a second feature type, we used the resulting
Action Units (AU) and their intensities from the ap-
proach of (Haase et al., 2013) for each half of the face.
VISAPP 2016 - International Conference on Computer Vision Theory and Applications
274
Action Units (AU) are part of the Facial Action Cod-
ing System (FACS) used to parametrise human facial
movement (Ekman and Friesen, 1978). Every muscle
in the face is related to an AU and its activation level
is coded on a scale from A (minimal activation) to E
(maximal activation). The AU-prediction is based on
a Gaussian Process regression using the fitting param-
eters of the half sided AAM to predict the activated
AUs of a given face. This approach was evaluated on
three different and widely used datasets with both im-
ages and labeled AUs. This model was then used to
predict patients AUs in order to measure the muscle
activity in both hemispheres. For our experiments we
used a pre-trained model for AU prediction because
neither landmarks nor AUs are available for our pa-
tient dataset.
As aforementioned for the AAM parameters we
used three versions for training: all AUs with first the
right and second the left half of the face, the Action
Units of just the paralysed side and the absolute dis-
tance between the healthy and the paralysed side.
Finally, we took the fitted landmarks into account.
Due to differences in position and size of the patients
head during the image recording, the original land-
marks can not be used. Therefore we calculated the
Euclidean distance between the landmarks and their
neighbours in order to describe the movement of these
landmarks. If the paralysed half of the face is not able
to do the exercises correctly the distances between the
landmarks should be larger compared to the distances
between two healthy hemispheres.
The extracted features were then used to train a
Random Decision Forest.
4 EXPERIMENTS AND RESULTS
In the following we present the evaluation of our pro-
posed method based on a dataset with real facial pare-
sis patients data.
4.1 Dataset
The used dataset of patients with chronic facial pare-
sis was provided by the universities ENT department.
It contains images and information about 235 differ-
ent patients of all ages with half sided facial paresis in
different degrees of severity.
The information on every patient in the list were
obtained by the physician on duty during their first
visit in the hospital. These information contain the
specification of the paralysed side (left or right hemi-
sphere), the paresis form (partial or complete) and the
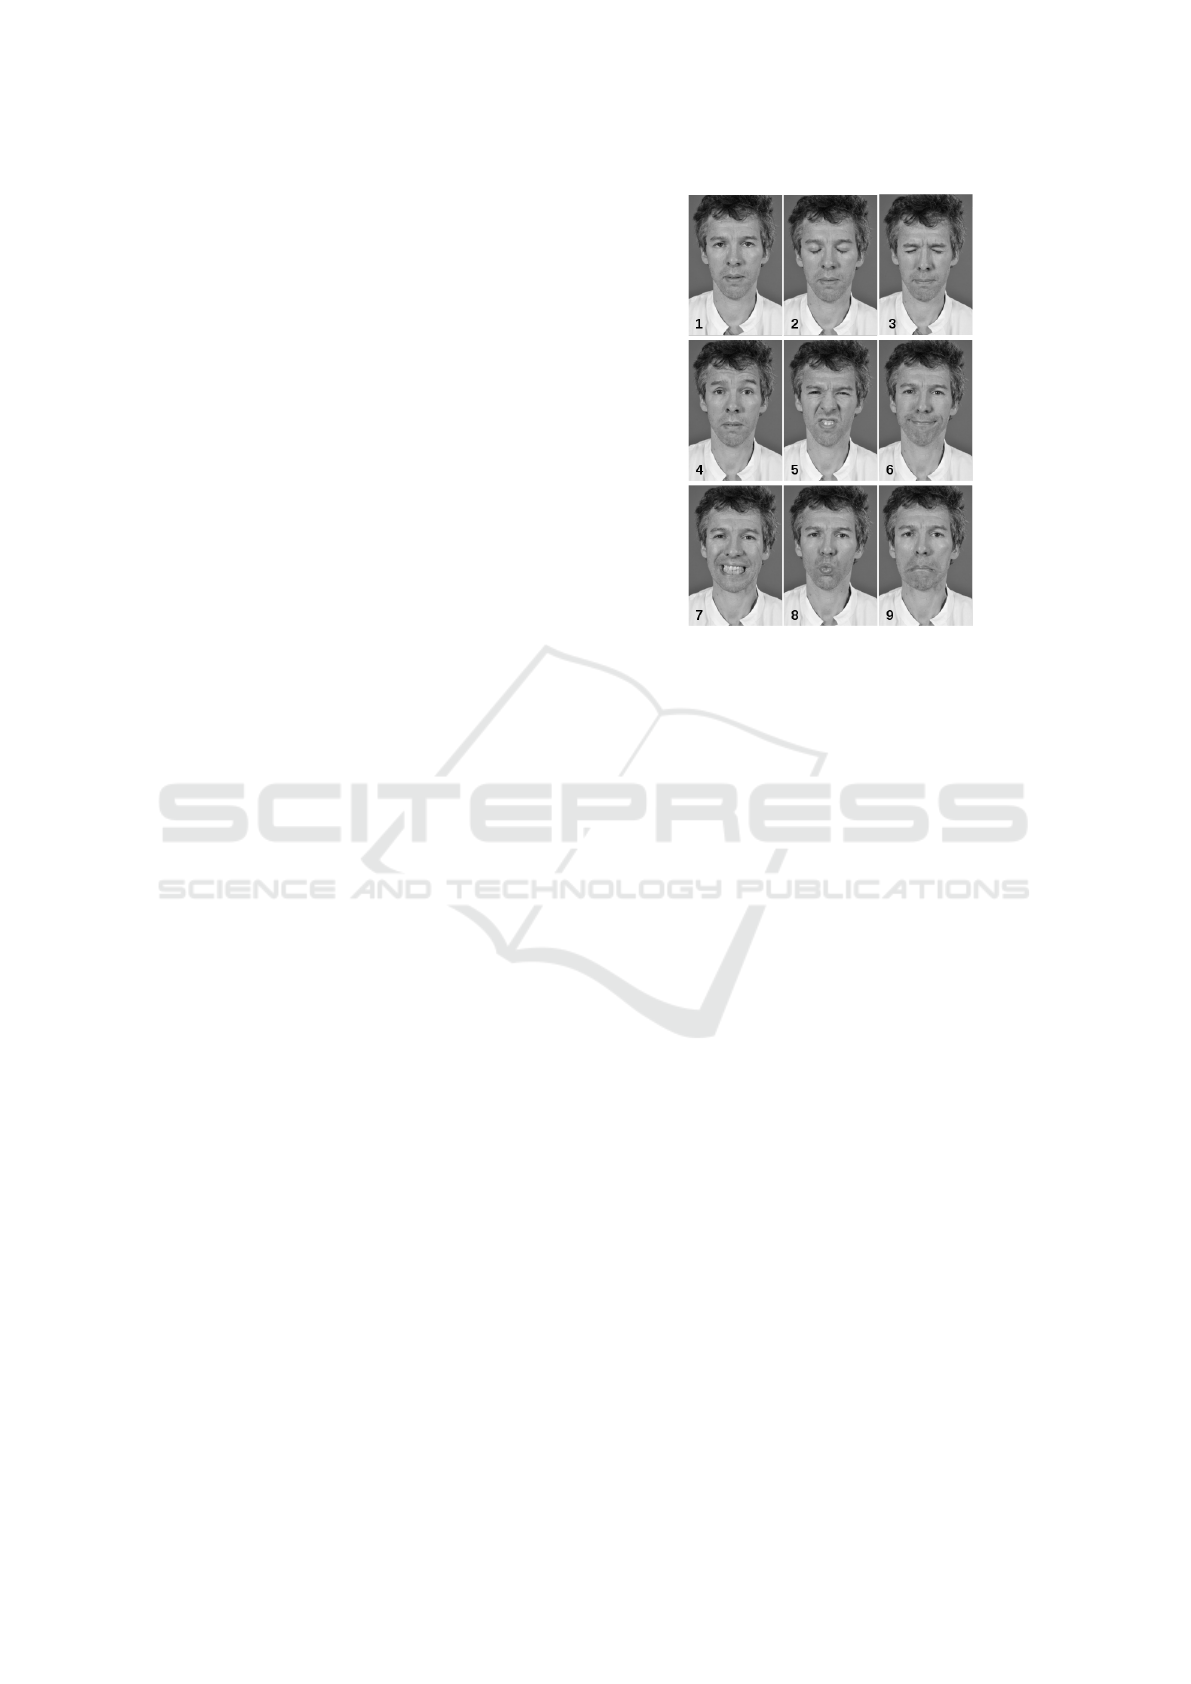
Figure 3: A healthy proband performing all nine exercises:
resting face (1), closed eyes (2), squinning eyes (3), wrin-
kled forehead (4), wrinkled nose (5), smile with closed
mouth (6), show teeth (7), pursing lips (8) and lowered
mouth corners (9) (Haase et al., 2015).
grade of severity rated according to the Stennert index
and House-Brackmann scale.
The images were taken soon after the first visit in
the hospital. During the image recording the patients
had to perform nine different exercises. These exer-
cise images include a face in rest and several expres-
sions that need different muscles to be activated as can
be seen in Figure 3.
4.2 Index prediction
The overall prediction rates of all indices and methods
can be seen in Table 6. These results were obtained
by performing a 5-fold cross-validation and a param-
eter analysis to find the best combination of param-
eters for an optimal classification. To calculate the
prediction rate we counted all prediction that differed
by less than two grades from the ground-truth label
as suggested by (He et al., 2009). This procedure is
also motivated by the inter-rater variability observed
by (de Ru et al., 2006; Coulson et al., 2005).
The results for each index to be predicted are dis-
cussed in detail in the next section.
Stennert Index in Rest
The Stennert Index in Rest (SIR) contains five dif-
ferent grades ranging from normal (0) to severe (4).
More detailed information can be seen in Table 2. The
analysis is performed on the image with the face in
rest.
Facial Paresis Index Prediction by Exploiting Active Appearance Models for Compact Discriminative Features
275
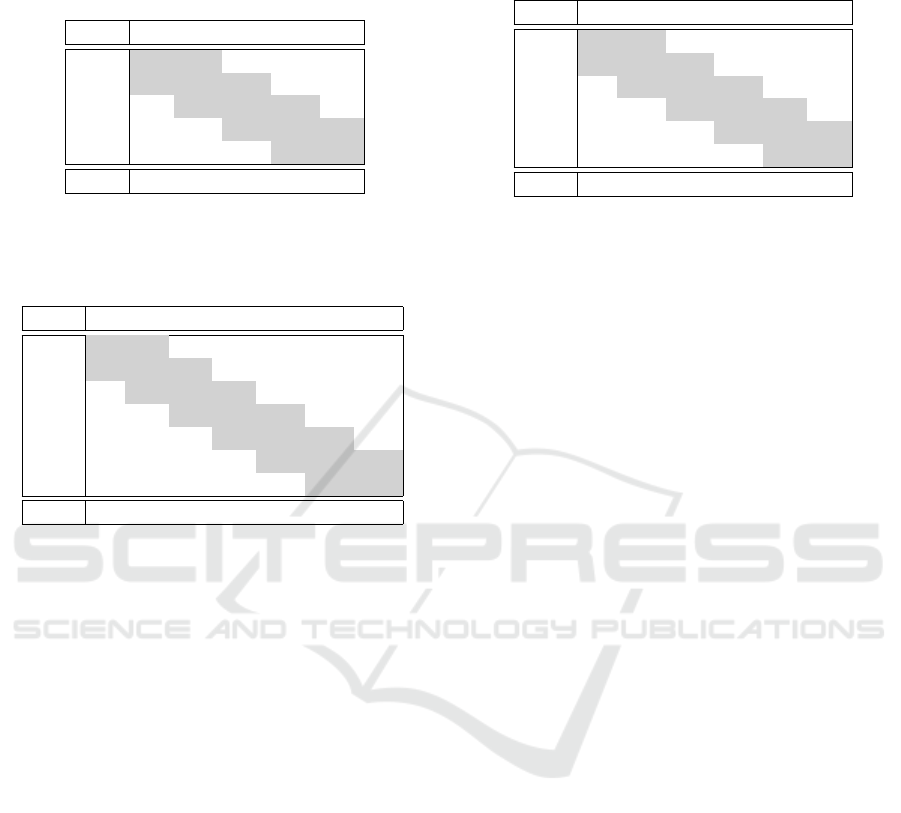
Table 3: Distribution of all Stennert Indices in Rest that
were used for prediction during the crossvalidation (predic-
tions in row and ground-truth in columns) and the distribu-
tion of indices in the used dataset.
0 1 2 3 4
0 1 1 0 0 0
1 1 21 16 10 4
2 17 23 30 18 16
3 11 6 16 3 4
4 0 1 1 1 1
Dist: 37 52 63 32 25
Table 4: Distribution of all Stennert Indices in Motion that
were used for prediction during the crossvalidation (predic-
tions in row and ground-truth in columns) and the distribu-
tion of indices in the used dataset.
0 1 2 3 4 5 6
0 0 0 0 0 0 0 0
1 0 0 1 0 0 2 2
2 1 0 1 2 1 2 5
3 0 0 0 2 4 2 9
4 2 3 6 6 9 10 21
5 0 6 5 8 18 8 23
6 1 4 2 0 4 3 4
Dist: 4 13 15 21 36 27 64
For training and testing there were a total 209 dif-
ferent patients data available. As can be seen in Table
3 the ground-truth data cluster in the middle. This
also reflects the distribution of indices throughout the
dataset (last row of Table 3). The majority of patients
has a slightly visible paresis during rest. This can be
a reason for the low recognition rate using this global
approach: the index is obtained by scoring several
regions in the face where the sum affirmed answers
form the score.
The best results for the SIR were achieved by us-
ing the Action Units of the paralysed hemisphere or
the distances between the landmarks provided by the
AAM (c.f. Table 6) with the worst recognition rate 2.3
percentage points apart. Thus all three used feature
versions seem to have nearly the same performance
when predicting the SIR.
Stennert Index in Motion
Different to the Stennert Index in Rest the Stennert In-
dex in Motion (SIM) is not based on one single image
but on six different ones. Each image shows a differ-
ent muscle movement (Figure 3) which has to be rated
according to the rating scheme (Table 2).
To evaluate this index 180 different samples were
used for training and testing. The ground-truth in-
dices cluster in the right corner of Table 4. Similar
Table 5: Distribution of all House-Brackmann Indices that
were used for prediction during the crossvalidation (predic-
tions in row and ground-truth in columns).
I II III IV V VI
I 0 0 0 0 0 0
II 0 0 2 2 0 0
III 3 18 33 27 20 3
IV 0 21 17 15 3 0
V 0 0 1 0 0 0
VI 0 0 0 0 0 0
Dist: 3 39 53 44 23 3
to the SIR the SIM is calculated by summing up the
answers of the questions to every image or muscle
movement (Table 2). Hence, two patients can be rated
with the same score but have totally different muscu-
lar defects.
Different to the SIR the used features differ in
their recognition rate (Table 6). In general the AAM-
fitting parameter provide the best recognition rate, es-
pecially the feature type that used all fitting parame-
ters plus a variable that codes for the paralysed hemi-
sphere (66.6%).
House-Brackmann Index
In contrast to the above discussed indices the House-
Brackmann index (HB) does not rate single but all
nine available images. The patients were observed
during they perform the exercises and then rated ac-
cording to the scheme (c.f. Table 1). According to
(de Ru et al., 2006; Coulson et al., 2005) the variabil-
ity through different experts is substantial.
To train and predict the HB index 165 dates from
different patients were used. Like in the case of the
SIR the predicted indices are grouped in the middle
of the table.
This time both the fitting parameters and the Eu-
clidean difference between the landmarks performed
best with a recognition rate of 80.5% as can be seen
in Table 6. The other fitting parameters were just by
0.5 percentage points worse than the best prediction
rate. That indicates that the fitting parameters in gen-
eral are suitable for the prediction of HB indices.
Throughout all indices the House-Brackmann in-
dex (HB) achieved the best recognition rates as can
be seen in Table 6. As the manually obtained indices
do not depend on single frames and local differences
but on the general degree of paresis the global method
performs best on the global index as expected.
Not focused on individual results of the different
used features the AAM-fitting parameters performed
best throughout the experiments especially in case of
the Stennert Index in Motion. The recognition rates
are also quite similar or differ just slightly by a few
VISAPP 2016 - International Conference on Computer Vision Theory and Applications
276
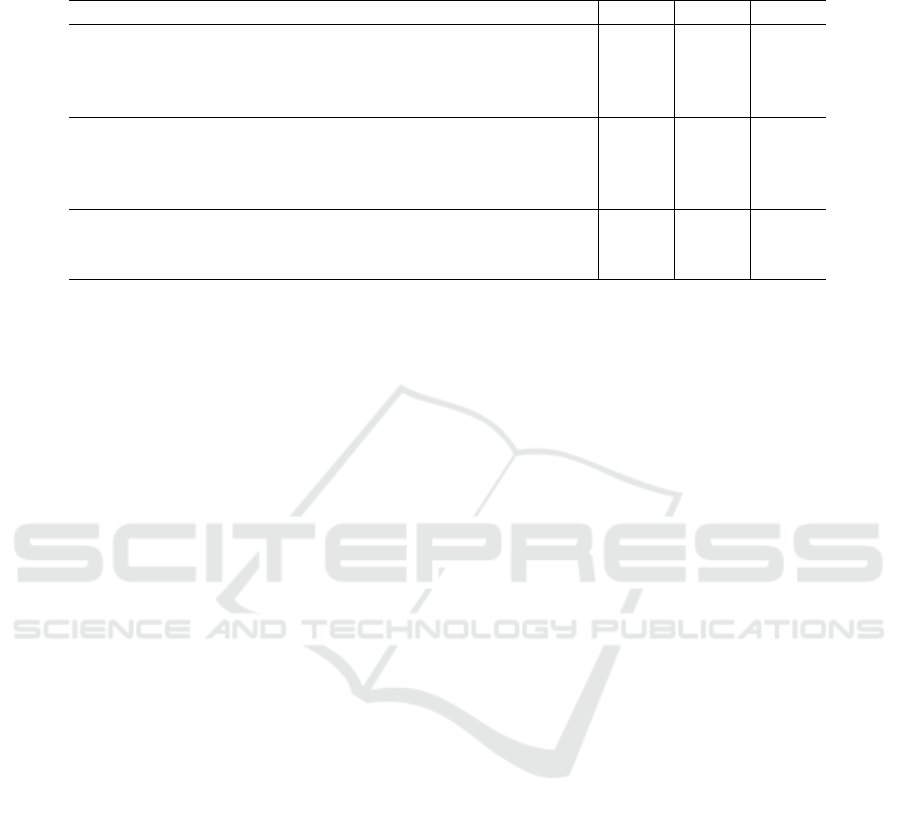
Table 6: Prediction rate of the different features and indices. The used side variable defines the paresis side of the patient. A
prediction was marked as true if the distance between predicted and measured index less or equal to one as suggested by (He
et al., 2009).
Feature Types Features SIR SIM HB
AAM-fitting parameters all parameters without side variable 70.0% 64.4% 80.0%
all parameters with side variable 70.9% 66.6% 80.0%
parameters of paralysed hemisphere 70.0% 65.5% 80.0%
left-right absolute distance 70.0% 63.3% 80.5%
Action Units all AUs without side variable 71.9% 57.2% 76.9%
all AUs with side variable 71.9% 51.1% 76.3%
AUs of paralysed hemisphere 72.3% 56.6% 74.5%
left-right absolute distance 70.0% 58.2% 78.7%
Landmark distances without side variable 71.4% 57.7% 80.5%
with side variable 72.3% 57.7% 80.5%
difference between sides 71.9% 57.2% 73.3%
percentage points. This strongly indicates that AAM-
fitting parameters can be used in classification of fa-
cial paresis indices.
Comparison to Further Work
The approach by (He et al., 2009) achieved an overall
recognition rate of 94.1% for the House-Brackmann
index prediction. For this reason their prediction rates
outperform our approach. Nevertheless these rates
are not directly comparable as (He et al., 2009) used
video sequences for their automated prediction and
not single images.
The approach by (Delannoy and Ward, 2010)
used Active Appearance Models for prediction and
achieved an average recognition rate of 87% on their
dataset. Again, these rates are not directly compara-
ble. (Delannoy and Ward, 2010) did not test their ap-
proach on real patients data but on synthesised images
that do not reflect the large variety of real patients im-
ages.
Unfortunately, there are no similar works that auto-
matically predict the Stennert index, thus comparison
is not possible.
4.3 Implementation Details
The presented framework was both implemented in R
and C/C++. The fitting of the AAM on the patients
images was done by an R framework. The index pre-
diction was implemented in C/C++ using the OpenCV
library version 2.4.10 (Bradski, 2000). The experi-
ments were performed on a standard desktop com-
puter (i5 760 CPU, 2.80 GHz). Fitting an AAM on
one single image took about five Milliseconds. The
prediction of the appropriate index less than one mil-
lisecond, hence one image is approximately classi-
fied within 5 milliseconds. This allows the analysis
of large-scaled databases within a feasible amount of
time.
5 CONCLUSION
In this work the severity of a patients facial pare-
sis is predicted automatically by using AAMs and an
RDF. The standard procedure to obtain the severity of
a facial paresis is to rate the index manually in the
clinic by a physician. Possible rating schemes for
facial paresis are the Stennert index and the House-
Brackmann scale. The indices allow a documenta-
tion of the actual severity and the status of recovery
during and after therapy. We propose an automatic
method to rate a patients facial palsy based only on
nine images. The method is irritation-free and objec-
tive. Also no interaction between patients and thera-
pist is needed for prediction. First a pre-trained Ac-
tive Appearance Model is fitted on only the images.
Afterwards we used both the resulting fitting param-
eters, the distances between the fitted landmarks and
the predicted Action Units (Haase et al., 2013) respec-
tively to train a Random Decision Forest for classi-
fication. Especially for the House-Brackmann index
we obtained a prediction rate of 80%.
ACKNOWLEDGEMENTS
We thank Prof. Dr. Orlando Guntinas-Lichius (De-
partment of Otorhinolaryngology, Jena University
Hospital) for the photographs and data of all facial
paresis patients and his valuable guidance regarding
clinically meaningful evaluations.
This work has been funded by the German Federal
Ministry of Education and Research (BMBF) within
the project Irritation-free emotion-sensitive training
system (IRESTRA), FKZ: 16SV7209.
Facial Paresis Index Prediction by Exploiting Active Appearance Models for Compact Discriminative Features
277

REFERENCES
Alberti, P. W. and Biagioni, E. (1972). Facial paralysis in
children. a review of 150 cases. The Laryngoscope,
82:1013–1020.
Bradski, G. (2000). The opencv library. Dr. Dobb’s Journal
of Software tools.
Breiman, L. (2001). Random trees. Machine Learning,
95(1):5–32.
Cootes, T., Edwards, G., and Taylor, C. (2001). Active ap-
pearance models. Transactions on Pattern Analysis
and Machine Intelligence, 23(6):681–685.
Coulson, S., Croxson, G., Adams, R., and O’Dwyer, N.
(2005). Reliability of the ”sydney,” ”sunnybrook,” and
”house brackmann” facial grading systems to assess
voluntary movement and synkinesis after facial nerve
paralysis. OtolaryngologyHead and Neck Surgery,
132(4):143–149.
de Ru, J., Braunius, W., van Benthem, P., Busschers, W.,
and Hordijk, G. (2006). Grading facial nerve function:
why a new grading system, the moress, should be pro-
posed. Otology and Neurotology, 27:1030–1036.
Delannoy, J. and Ward, T. (2010). A preliminary inves-
tigation into the use of machine vision techniques for
automating facial paralysis rehabilitation therapy. Sig-
nals and Systems Conference (ISSC), pages 228–232.
Ekman, P. and Friesen, W. (1978). Facial action coding sys-
tem: A technique for the measurement of facial move-
ment. Consulting Psychologists Press.
Gebhard, A., Paulus, D., Suchy, B., Fucak, I., Wolf, S.,
and Niemann, H. (2001). Automatische graduierung
von gesichtsparesen. In Bildverarbeitung fr die Medi-
zin 2001, Informatik aktuell, pages 352–356. Springer
Berlin Heidelberg.
Gebhard, A., Paulus, D., Suchy, B., and Wolf, S. (2000). A
system for diagnosis support of patients with facialis
paresis. German Journal on Artificial Intelligence, 3.
Guntinas-Lichius, O., Straesser, A., and Streppel, M.
(2007). Quality of life after facial nerve repair. The
Laryngoscope, 117(3):421–426.
Haase, D., Kemmler, M., Guntinas-Lichius, O., and Den-
zler, J. (2013). Efficient measuring of facial action unit
activation intensities using active appearance models.
Proceedings of the 13th IAPR International Confer-
ence on Machine Vision Applications (MVA), pages
141–144.
Haase, D., Minnigerode, L., Volk, G., Denzler, J., and
Guntinas-Lichius, O. (2015). Automated and objec-
tive action coding of facial expressions in patients
with acute facial palsy. European Archives of Oto-
Rhino-Laryngology, 272(5):1259–1267.
Haase, D., Nyakatura, J. A., and Denzler, J. (2014).
Comparative large-scale evaluation of human and ac-
tive appearance model based tracking performance
of anatomical landmarks in x-ray locomotion se-
quences. Pattern Recognition and Image Analysis
(PRIA), 24(1):86–92.
He, S., Soraghan, J., O’Reilly, B., and Dongshan, X. (2009).
Quantitative analysis of facial paralysis using local bi-
nary patterns in biomedical videos. Transactions on
Biomedical Engineering, 56(7).
House, J. and Brackmann, D. (1985). Facial nerve grad-
ing system. OtolaryngologyHead and Neck Surgery,
93:146–147.
Matthews, I. and Baker, S. (2004). Active appearance mod-
els revisited. International Journal of Computer Vi-
sion, 60(2):135–164.
Peitersen, E. (2002). Bell’s palsy: The spontaneous course
of 2,500 peripheral facial nerve palsies of different eti-
ologies. Acta Oto-Laryngologica, 122(7):4–30.
Song, I., Nguwi, Y., Vong, J., Diederich, J., and Yel-
lowlees, P. (2013). Profiling bell’s palsy based on
house-brackmann score. Symposium on Computa-
tional Intelligence in Healthcare and e-health (CI-
CARE), pages 1–6.
Song, Q., Montillo, A., Bhagalia, R., and Srikrishnan, V.
(2014). Organ localization using joint ap/lat view
landmark consensus detection and hierarchical active
appearance models. Medical Computer Vision. Large
Data in Medical Imaging, 8331:138–147.
Stennert, E., Limberg, C., and Frentrup, K. (1977).
Parese und defektheilungsindex; ein leicht anwend-
bares schema zur objektiven bewertung von thera-
pieerfolgen bei fazialisparesen. HNO, 25:238–245.
Vincent, G., Wolstenholme, C., Scott, I., and Bowes, M.
(2010). Fully automatic segmentation of the knee joint
using active appearance models. Medical Image Anal-
ysis for the Clinic: A Grand Challenge, pages 224–
230.
Wachtman, G., Cohn, J., VanSwearingen, J., and Manders,
E. (2001). Automated tracking of facial features in pa-
tients with facial neuromuscular dysfunction. Plastic
and Reconstructive Surgery, 107(5):1124–1133.
Wang, S. and Qi, F. (2005). Compute aided diagnosis
of facial paralysis based on pface. Engineering in
Medicine and Biology Society, pages 4353–4356.
VISAPP 2016 - International Conference on Computer Vision Theory and Applications
278
