
Compressed Sensing and Classification of Cardiac Beats using
Patient Specific Dictionaries
Monica Fira
1
, Liviu Goras
1,2
, Victor-Andrei Maiorescu
1,2
and Mihaela Catalina Luca
1,3
1
Institute of Computer Science, Romanian Academy, Iaşi, Romania
2
“Gheorghe Asachi” Technical University of Iaşi, Iaşi, Romania
3
University of Medicine and Pharmacy, Iaşi, Romania
Keywords: ECG, Compressed Sensing, Classification.
Abstract: In this paper, we investigated the benefits of compressed acquisition for monitoring applications of patients
with various heart diseases. The possibility of heartbeat acquisition followed by classification into one of
two classes, namely, normal beats or pathological has been approached using patient-specific dictionaries.
Moreover, several types of projection matrices (matrices with random i.i.d. elements sampled from the
Gaussian or Bernoulli distributions, and matrices optimized for the particular dictionary used in
reconstruction by means of appropriate algorithms) have been compared. The dictionaries used in the
reconstruction phase were built with and without centred R waves.
1 INTRODUCTION
Based on the concept of signal sparsity in terms of
the atoms of a certain dictionary and making use of
classical decomposition algorithms the literature of
the latest years proposes and investigates the
interesting possibility of joining signal acquisition
and compression within the concept of compressed
sensing [Donoho 2006, Donoho 2004, Candes
2008]. It has been mathematically proved that if a
class of signals allow a representation in terms of a
small number of components in a properly selected
base (i.e., the signal is "sparse" in that specific base
or with respect to the atoms of a dictionary), the
signals can be reconstructed with a very good
precision from a reduced number of measurements
consisting of projections on random vectors by
solving a linear programming problem.
The decomposition of a signal in terms of an
over-complete dictionary it is not unique, and can be
obtained by means of general methods such as
method of frames (MOF), matching pursuit (MP)
and methods based on special dictionaries, such as,
the best orthogonal basis (BOB) or basis pursuit
(BP) [Elad 2007, Shaobing Chen 1998, Polania
2011, Zhang 2013].
2 BACKGROUND ON
COMPRESSED SENSING
Compressed sensing is a new concept in signal
processing basically consisting in minimizing the
number of measurements / projections to be taken
from signals that are sparse while still retaining the
information necessary to approximate them well.
Consider a family of signals
n
j
Rx ∈
known to
have sparse representations using at most T atoms
from a fixed dictionary
nxk
R
D ∈
. Such signals can
be described as
jj
Dxj
α
=∀ ,
(1)
with
nT
j
<<≤
0
α
where T is the sparsity of the
signals and the l
0
– norm counts the number of non-
zeros entries in
j
α
.
Compressed sensing consists of a joint sensing
and compression for such signals. Using a projection
matrix
pxn
P ℜ∈
with np
T
<<< , the
technique of compressed sensing seeks to represent
x
j
by p scalars y
j
given by
jj
Pxy =
(2)
Fira, M., Goras, L., Maiorescu, V-A. and Luca, M.
Compressed Sensing and Classification of Cardiac Beats using Patient Specific Dictionaries.
In Proceedings of the International Conference on Information and Communication Technologies for Ageing Well and e-Health (ICT4AWE 2016), pages 173-179
ISBN: 978-989-758-180-9
Copyright
c
2016 by SCITEPRESS – Science and Technology Publications, Lda. All rights reserved
173

The original signal x
j
can be reconstructed from y
j
by exploiting the sparsity of it is representation so
that among all possible
α
satisfying
α
PDy
j
=
(3)
we seek the sparsest. If this representation coincides
with
j
α
, we get a perfect reconstruction of the
signal using equation 3.
jj
Dx
α
=
(4)
In general this reconstruction is based on the
solution of
αα
α
PDy
j
=
0
min
(5)
which is known to be NP – hard even for moderate-
sizes of the linear system of the constraints.
Reconstruction algorithms are standard linear
programming algorithms with perhaps quadratic
constraints such as LARS, LASSO, SparseLab,
l1Magic, (Orthogonal) Basis Pursuit, (Orthogonal)
Matching Pursuit etc.
2.1 Compressed Sensed and
Key Problems
A key problem in CS is the choice or the
construction of the dictionary based on which the
compressed signal reconstruction is made. For many
classes of signals, dictionaries (time-frequency or
time-scale dictionaries) based on which good results
using the CS concepts have been obtained are
already known. Still, there are classes of signals for
which the use of standard dictionaries do not ensure
spectacular compression results, due to the fact that
the sparsity of these signals is not ensured. This
signal classes may require the construction of new
dictionaries to fit new types of data features. The
analytic construction of dictionaries such as
wavelets or curvelets stems from deep mathematical
tools from Harmonic Analysis. It may however be
difficult and time consuming to develop complex
mathematical theory each time a new class of data,
which requires a different type of dictionary, is met.
An alternative solution is dictionary learning, which
aims deduction the dictionary from a set of training
data [Fira 2010]. Dictionary learning, also known as
sparse coding, has the potential of ’industrialising’
sparse representation techniques for new data
classes.
Recent articles present the possibility of
combining the concepts of signal representation
using dictionaries with signal classification
concepts, solving the classification problems based
not on the concrete signal, but on a small number of
random measurements of the signal acquired using a
random projection matrix. Generally speaking, the
results of the classifications are influenced by two
important factors, namely the modality of
constructing the dictionary and the classifier used.
The possibility of classifying compressed signals
is extremely useful because it brings additional
information about the signal, information that will
allow the reconstruction of original signals using
specific dictionaries. In compressed sensing, in case
the sparsity of the signal cannot be ensured using a
single general dictionary, the use of specific
dictionaries will lead to a decrease of the
reconstruction error.
Starting from the mathematic fundaments of
compressed sensing, we aimed at the software
implementation of the compressed sensing for ECG
medical signals. The key element that appears in the
case of this type of signals is to find a dictionary that
would ensure the ECG signals sparsity in direct
connection to the reconstruction method.
2.2 Purpose and Objectives
Based on the results of the classification of acquired
heart rate compressed presented [Fira 2011a] and the
results for the patient-specific dictionaries presented
in [Fira 2011 b, Fira 2013], in this paper, we propose
a new method that combines the above previous
approaches. The aim is to develop and implement a
method for compressed sensed of ECG signal
together with the detection of the abnormal heart
beats and transmission of these beats to a center for
monitoring of people with heart diseases.
The proposed problem to solve is divided into the
following sub-problems:
• Construction of patient-specific dictionaries;
• Heartbeat classification;
• Compressed acquisition of abnormal heart
beats;
• Transmission of abnormally beats to a
surveillance center / recording of these beats for
further investigation by qualified personnel;
• Reconstruction of compressed sensed beats.
3 METHOD
Starting from ECG signals for which the position of
the R-wave is known exactly, we segment the ECG
signals in heart beats cycles. : A cardiac pattern
begins from the middle of an RR interval and
finishes at the middle of the next RR interval [Fira
ICT4AWE 2016 - 2nd International Conference on Information and Communication Technologies for Ageing Well and e-Health
174
2010]. Then, based on the ECG signal segmented in
cardiac cycles, we have developed two methods of
building patient-specific dictionaries, namely:
• Dictionary consisting in heart beats with
centered R wave;
• Dictionary with not centered R Wave.
3.1 Dictionaries Built from Cardiac
Beats with Centred R Wave
Each segment contains the P-wave, the QRS
complex and the T-wave and each cardiac segment
thus obtained was resampled at 301 samples so that,
after that all patterns will have the same dimension,
thus being possible to create a specific dictionary for
the ECG signals. To obtain cardiac patterns with
resampling and centred R wave, after segmentation
the peak of the R wave was positioned on sample
151 and then the whole beat was resampled such that
on the right and on the left of the R peak there will
be 150 samples i.e., the R wave will be positioned in
the middle.
NOTE: The resampling operation of the cardiac
segment on 301(150 samples on each side of the R
wave), which has as purpose to obtain cardiac
patterns with the same size, is a reversible
modification, as long as the information related to
the initial dimension is maintained.
50 100 150 200 250 300
900
950
1000
1050
1100
1150
1200
1250
Figure 1: Cardiac beat with centred R wave.
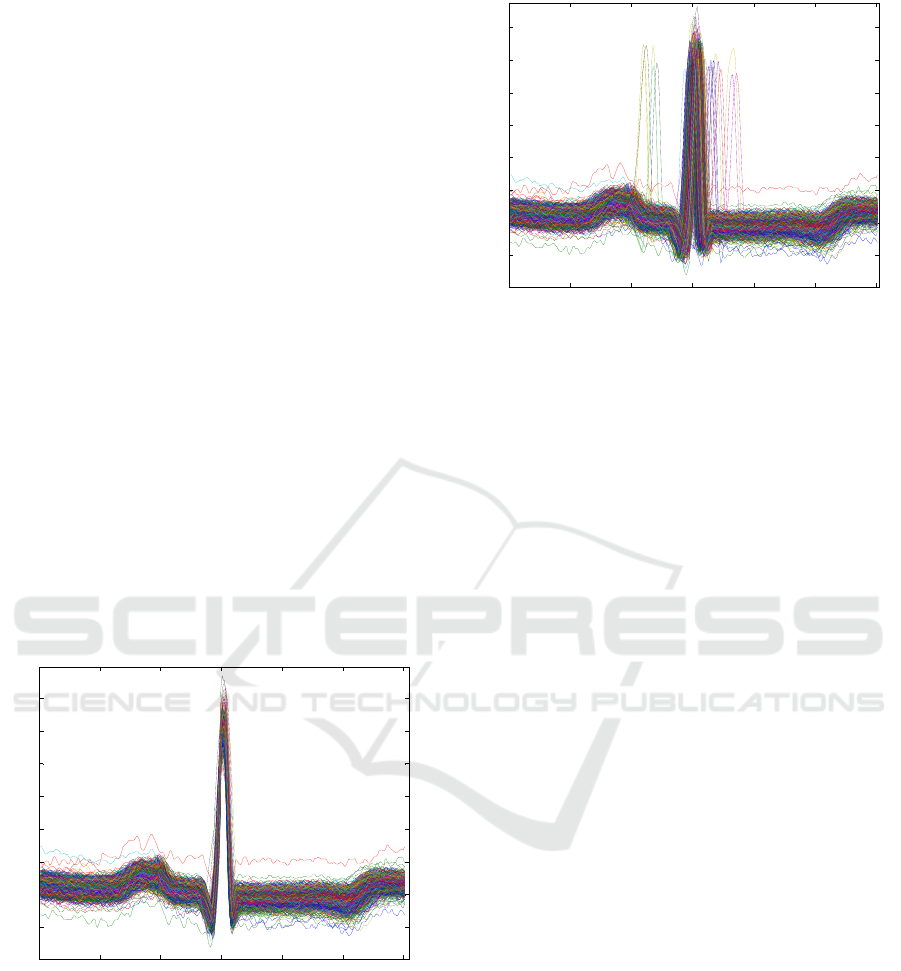
3.2 Dictionaries Built from Cardiac
Beats without Centred R Wave
When using segments with no R wave alignment,
the extracted segments are subsequently resampled
to 301 samples.
0 50 100 150 200 250 300
900
950
1000
1050
1100
1150
1200
1250
Figure 2: Cardiac beat without centred R wave.
3.3 Projection Matrices
It is known that the acquisition results are influenced
to some extent also by the type of matrix used for
acquisition. Therefore we analyzed the influence of
the compression matrix on acquisition and on the
classification of the compressed heartbeats, testing
three types of matrices, namely:
• Random matrix
• Bernoulli matrix
• Optimized matrix depending on dictionary
[Cleju 2011] - (product of random matrices and the
dictionary transposed)
3.4 KNN - k-Nearest Neighbours
The classifier used for heart beats classification is of
k-Nearest Neighbors (kNN) type. We opted for this
type of classifier since it is simple to implement in
practical applications even in hardware. For
improved results one can choose more complex
classifiers, but the results offered by this classifier
proved to be good enough; as a consequence we
selected it even for future hardware
implementations.
The kNN classifier was trained with normal and
abnormal heart beats evenly distributed on both
classes. The beats used to train the classifier were
extracted from the dictionary constructed for the
compressed acquisition.
3.5 Cardiac Patterns Reconstruction
For reconstructing the patterns we use the Basis
Pursuit algorithm to determine the coefficients. The
reconstruction of the compressed cardiac patterns is
based on using the above discussed patient specific
dictionary with or without centred R-wave. The
Compressed Sensing and Classification of Cardiac Beats using Patient Specific Dictionaries
175
KNN
coef
> 6
min
< 6
min
ECG
cardiac
pattern
Compress
Recons.
ECG
BP
Segment.
& resamp.
)(
*
NM
NM
<
Φ
1*
~
M
y
i
Ψ
α
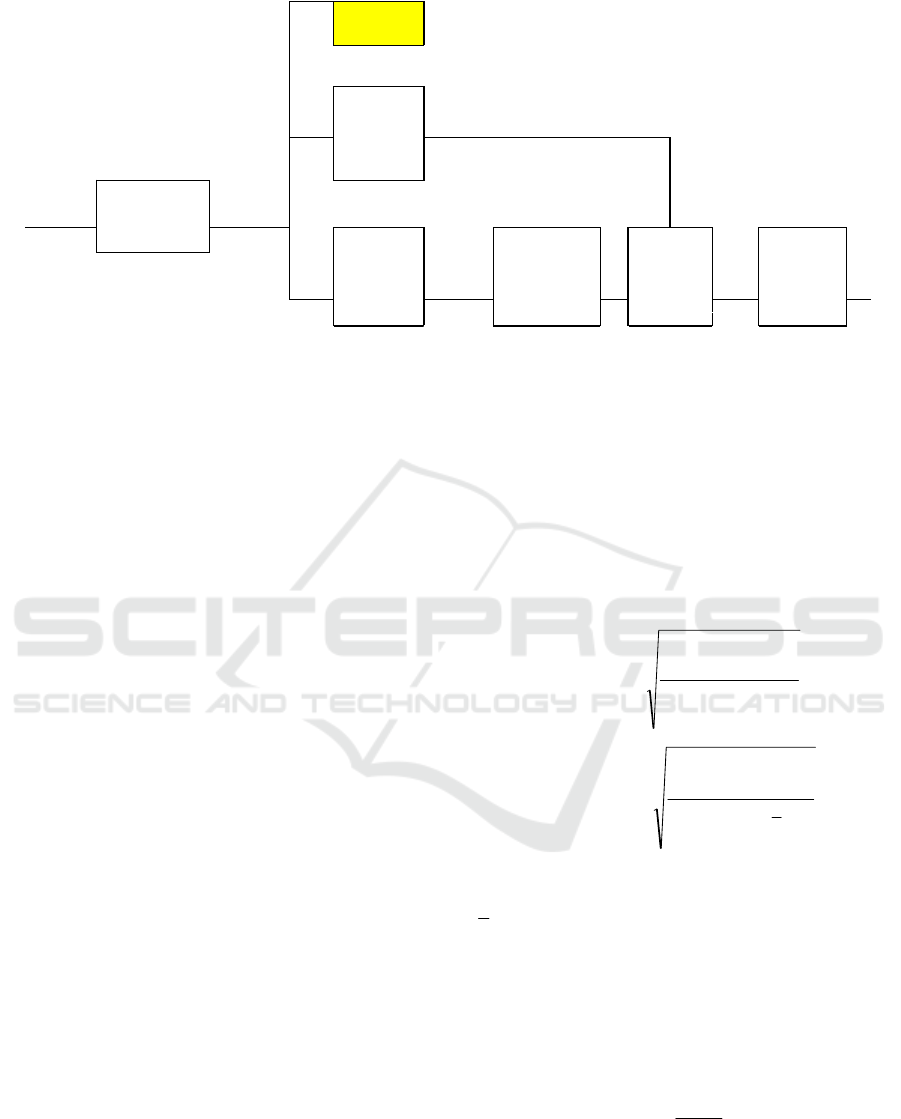
Figure 3: Principle of the method.
patient specific dictionary consists of 700 cardiac
patterns.
3.6 Principle of the Method
Most of the methods proposed by different authors
do not capitalize the quasi periodic nature of the
ECG signal and the specific particularities of the
patient. Therefore, in this paper, we propose a
method that takes into account both advantages,
namely, working with heart beats (not with the ECG
signal as it is recorded) and secondly, the used
dictionaries are made of cardiac cycles taken from
the subject of acquisition. Thus, the first six minutes
of registration or previous recordings from the same
subject (if any) are used to build the dictionary
needed for reconstruction. Only after the dictionary
was built, the compressed sensing of the heart beats
starts, followed by the classification in normal or
pathological for each heartbeat and then the
transmission or storage of data when an abnormality
is detected.
For the implementation of the proposed method a
buffer memory is necessary. From the ECG recorded
samples that are stored in the processing buffer, full
cardiac beat cycles are extracted by detecting the
maxima of the R waves, followed by segmenting
between the midpoints of consecutive RR intervals.
When using segments with no R wave alignment,
the extracted segments are also subsequently
resampled to 301 samples. As already shown, for R
wave centred, each ECG segment is split in two
parts, one from the beginning of the segment to the
location of the R wave and the other one from there
to the end, and each part are independently
resampled to a length of 150 samples.
A block diagram of the proposed method is
shown in Figure 3.
3.7 Validation of the Compression
Method
We evaluated the distortion between the original and
the reconstructed signals by means of the percentage
root-mean-square difference (PRD) and its
normalized version, PRDN:
∑
∑
=
=
−
=
N
n
N
n
nx
nxnx
PRD
1
2
1
2
)(
))(
~
)((
100%
(6)
∑
∑
=
=
−
−
=
N
n
N
n
xnx
nxnx
PRDN
1
2
1
2
))((
))(
~
)((
100%
(7)
where
)(nx
and
)(
~
nx
are the samples of the
original and the reconstructed signals respectively,
x
is the mean value of the original signal, and N is
the length of the window over which the PRD is
calculated.
For compression evaluation we used the
compression rate (CR) defined as the ratio between
the number of bits needed to represent the original
and the compressed signal,
comp
orig
b
b
CR =
(8)
where
orig
b
and
comp
b
represent the number of bits
required for the original and compressed signals,
respectively.
ICT4AWE 2016 - 2nd International Conference on Information and Communication Technologies for Ageing Well and e-Health
176

4 EXPERIMENTAL RESULTS
To test the proposed method ECG segments from 14
ECG recordings (ID 100, 101, 102, 104, 105, 106,
119, 201, 202, 203, 210, 212, 217, 219) from the
MIT-BIH Arrhythmia [physionet] database were
used. The ECG signals were digitized through
sampling at 360 samples per second, quantized and
encoded with 11 bits. The MIT-BIH Arrhythmia
database, along the ECG signals, also contains
annotations of the cardiac beats for each of the
recordings.
0 50 100 150 200 250 300
900
950
1000
1050
1100
1150
1200
RED = Reconstructed Blue = Original *Black = Measured
Figure 4: Original and reconstructed cardiac beat.
Table 1 presents the mean results for 14 ECG
records for CR = 15:1 and tree types of confusion
matrices.
Table 1: Average Results for 14 ECG Records.
Projection matrix CR
Avg.
PRD
Avg.
PRDN
Classific
ation
rate
Patient specific dictionary with un-centered R-wave
Gaussian distribution
Random*Dict†(20*301)
15:1 0.78 11.98 92.24%
0 and 1 (with controlled
arrangement)(20*301)
15:1 0.94 16.06 84.71%
Gaussian distribution
Random (20*301)
15:1 0.82 13.82 91.14%
Patient specific dictionary with centered R-wave
Gaussian distribution
Random*Dict†(20*301)
15:1 0.51 9 93.41%
0 and 1 (with controlled
arrangement)(20*301)
15:1 0.71 12.4 88.06%
Gaussian distribution
Random (20*301)
15:1 0.72 12.51 89.70%
Since many authors report besides the average
results obtained on the MIT-BIH databases results
on record no. 117 we have presented such results in
Table 2. Heart beat rate classification of this record
is not calculated because it is not relevant. There are
mostly normal heart beats, so a classification in such
a situation is senseless.
Table 2: Average Results for the 117 Record.
Projection matrix CR
Avg.
PRD
Avg.
PRDN
Patient specific dictionary with un-centered R-wave
Gaussian distribution
Random*Dict†(20*301)
15:1 0.38 8.82
0 and 1 (with controlled
arrangement)(20*301)
15:1 0.56 12.81
Gaussian distribution
Random (20*301)
15:1 0.53 12.27
Patient specific dictionary with centered R-wave
Gaussian distribution
Random*Dict†(20*301)
15:1 0.38 8.73
0 and 1 (with controlled
arrangement)(20*301)
15:1 0.49 11.25
Gaussian distribution
Random (20*301)
15:1 0.48 11.15
In Table 3 we present results for reconstructed
cardiac patterns with and without centered R-wave
for CR = 4:1, 10:1 and 15:1 for Gaussian
distribution Random*Dict† projection matrix.
Table 3: Average Results for the 117 Record for CR = 4:1,
10:1, respectively 15:1 and matrix projection by type
Gaussian distribution Random*Dict†.
Projection matrix CR
Avg.
PRD
Avg.
PRDN
Patient specific dictionary with un-centered R-wave
Gaussian distribution
Random*Dict†(20*301)
4:1 0.19 4.36
10:1 0.29 6.77
15:1 0.38 8.82
Patient specific dictionary with centered R-wave
Gaussian distribution
Random*Dict†(20*301)
14:1 0.19 4.54
10:1 0.29 6.80
15:1 0.36 8.43
Table 4: Average Results for the 100 Record for CR = 4:1,
10:1, respectively 15:1 and matrix projection by type
Gaussian distribution Random*Dict†.
Projection matrix CR
Avg.
PRD
Avg.
PRDN
Classifi
cation
rate
Patient specific dictionary with un-centered R-wave
Gaussian distribution
Random*Dict†(20*301)
4:1 0.19 4.36 99.12%
10:1 0.29 6.77 98.17%
15:1 0.38 8.82 98.83%
Patient specific dictionary with centered R-wave
Gaussian distribution
Random*Dict†(20*301)
14:1 0.19 4.54 99.85%
10:1 0.29 6.80 96.27%
15:1 0.36 8.43 99.56%
Compressed Sensing and Classification of Cardiac Beats using Patient Specific Dictionaries
177

In Table 4 we present results for record no. 100
for reconstructed cardiac patterns with and without
centred R-wave for CR = 4:1, 10:1 and 15:1 for
Gaussian distribution Random*Dict† projection
matrix and for classification witk KNN.
Table 5: Results for ECG Records for compression ratio
CR= 15:1 and centred R wave.
PPV_
class1%
PPV_
class2%
k-Nearest
Neighbors
ID_
ECG
Total
Classification
rate %
99.9 96.4 1
100
99.8
99.9 85.7 2 99.6
99.6 92.9 3 99.4
88.8 100.0 1
101
88.8
99.4 100.0 2 99.4
96.4 100.0 3 96.4
100.0 99.5 1
102
99.5
100.0 97.6 2 97.6
100.0 97.7 3 97.7
68.8 99.1 1
104
98.0
75.0 96.9 2 96.2
56.3 99.8 3 98.2
95.4 87.5 1
105
95.3
98.2 87.5 2 98.1
97.5 87.5 3 97.4
99.6 97.7 1
106
98.9
99.9 95.7 2 98.4
99.9 95.7 3 98.4
100.0 100.0 1
119
100.0
100.0 100.0 2 100.0
100.0 100.0 3 100.0
51.4 83.5 1
201
59.0
65.7 77.1 2 68.4
61.3 79.9 3 65.7
49.3 80.0 1
202
50.3
66.2 75.0 2 66.5
57.5 80.0 3 58.2
97.3 94.8 1
203
50.3
98.6 90.5 2 66.5
97.7 94.4 3 58.2
98.7 93.3 1
210
98.2
99.6 87.7 2 98.5
99.2 89.0 3 98.3
97.2 100.0 1
212
99.0
98.4 99.7 2 99.2
96.9 100.0 3 98.9
0.0 100.0 1
217
82.9
0.0 100.0 2 82.9
0.0 100.0 3 82.9
90.0 62.9 1
219
89.3
99.3 54.3 2 98.1
93.8 60.0 3 92.8
The positive predictive value (PPV) is defined as
FPTP
TP
PPV
+
=
(9)
where a "true positive" (TP) is the event that the test
makes a positive prediction, and the subject has a
positive result under the gold standard, and a "false
positive" (FP) is the event that the test makes a
positive prediction, and the subject has a negative
result under the gold standard.
Table 6 contains the average results for 14
records from the database and also record no. 117
reported in [Polania et al. 2011a, b] and
[Mamaghanian et al. 2011].
Table 6: Other results for Average Values for 24 Records
and 117 Record.
Record /
Ave.
CR
Avg.
PRD
Avg.
PRDN
Other Compression Algorithms
POLANIA [Polania
2011a,b]
117 8:1 2.18 Notspec.
POLANIA [Polania
2011a,b]
117 10:1 2.5 Notspec.
MAMAGHANIAN
[Mamaghanian
2011] for before and
after inter-packet
redundancy removal
and Huffman coding
Ave. for
14 recs
4:1
(75)
Before Huffman 35
After Huffman 15
10:1
(90)
Before Huffman >45
After Huffman >45
15:1
(93)
Before Huffman >45
After Huffman >45
Note that Mamaghanian in [Mamaghanian 2011]
presents a compression method followed by
Huffman coding. Thus the final CR is increased by
using Huffman coding. In [Mamaghanian 2011]
results are presented both before and after Huffman
coding. Therefore, for a relevant comparison our
results should be compared to those before Humman
coding reported in [Mamaghanian 2011].
Moreover, in the above work the compression
ratio expressed as
100*
orig
comporig
b
bb
CR
−
=
(9)
that is different from the formula used in this paper.
In Table 7 we presented the number of bits
required for the original and compressed signals
difference between the two formulas used
Mamaghanian in [Mamaghanian 2011] and by us in
this paper.
ICT4AWE 2016 - 2nd International Conference on Information and Communication Technologies for Ageing Well and e-Health
178

Table 7: Correspondence between CR used in
[Mamaghanian 2011] and in this paper.
100*
orig
comporig
b
bb
CR
−
=
used by Mamaghanian
comp
orig
b
b
CR =
used by us in this paper
Mamaghanian in this
paper
Mamaghanian in this
paper
10 1.11 91 11.11
20 1.25 92 12.50
30 1.43 93 14.29
40 1.67 94 16.67
50 2 95 20
60 2.5 96 25
70 3.33 97 33.33
80 5 98 50
90 10 99 100
5 CONCLUSIONS
In this paper the possibility to build and use patient-
specific dictionaries for compressed sensing heart
beats that are classified by a KNN type classifier as
normal and abnormal. The presented principle has
several significant features, namely:
• gives very good results for the classification in
two classes (normal and abnormal), i.e., detection of
abnormal compressed sensed heartbeats
• allows reconstruction for the compressed
sensed heartbeats
• needs few calculations in the compressed
acquisition stage
• uses a k-NN type classifier for the classification
stage, which also implies less complex calculations.
Taking into account all these aspects, this work
can be considered relevant for a first step in the
implementation of an algorithm for monitoring and
management of cardiac crisis situations.
ACKNOWLEDGEMENTS
This work was supported by a grant of the Romanian
National Authority for Scientific Research and
Innovation, CNCS – UEFISCDI, project number
PN-II-RU-TE-2014-4-0832 “Medical signal
processing methods based on compressed sensing;
applications and their implementation"
REFERENCES
Donoho D. Compressed sensing, IEEE Trans. on
Information Theory, 52(4) (2006) 1289 – 1306.
Donoho D. Compressed sensing, Technical Report,
Stanford Univ., 2004.
Candès E. and Wakin M., An introduction to compressive
sampling. (IEEE Signal Processing Magazine 25(2)
(2008) 21-30.
Elad M. “Optimized Projections for Compressed Sensing”,
IEEE Transactions on Signal Processing, Vol. 52, 2007.
Shaobing Chen S., Donoho D., Saunders M. A., Atomic
Decomposition by Basis Pursuit, Journal on Scientific
Computing, Vol. 20 Issue 1 (1998).
Polania, L.F, Carrillo, R.E., Blanco-Velasco M. ,Barner
K.E., Compressed sensing based method for ECG
compression, IEEE International Conference on
Acoustics, Speech and Signal Processing (ICASSP),
2011.
Zhang Z., Tzyy-Ping Jung, Scott Makeig, Bhaskar D. Rao,
Compressed Sensing for Energy-Efficient Wireless
Telemonitoring of Non-Invasive Fetal ECG via Block
Sparse Bayesian Learning, IEEE Transactions on
Biomedical Engineering, 2013.
Fira M., Goraş L., Barabasa C., Cleju N., “On ECG
Compressed Sensing using Specific Overcomplete
Dictionaries”, Advances in Electrical and Computer
Engineering, Vol. 10, Nr. 4, 2010.
Fira M., Goras L., Barabasa C., Reconstruction of
Compressed Sensed ECG Signals Using Patient
Specific Dictionaries, International Symposium on
Signals, Circuits and Systems (ISSCS 2013), Iasi,
Romania, 2013.
Fira M., Goras L., Barabasa C., Cleju N., ECG
compressed sensing based on classification in
compressed space and specified dictionaries, the 2011
European Signal Processing Conference (EUSIPCO
2011), 29 August – 2 September 2011, Barcelona,
Spain, pp. 1573 – 1577, 2011.
Fira M., Goras L., Cleju N., Barabasa C., Results on ECG
Compressed Sensing using Specific Dictionaries and
its Validation, International Conference on
Information Technology Interfaces – ITI 2012, 25 – 28
June 2012, Dubrovnik, Croatia, pp. 423-428, 2012.
Cleju N., Fira M., Barabasa C., Goras L., Robust
reconstruction of compressively sensed ECG patterns,
ISSCS 2011 (The 10-th International Symposium on
Signals, Circuits and Systems), 30 June – 1 July 2011,
Iasi, pp. 507-510, 2011.
http://www.physionet.org/physiobank/database/mitdb/
Polania L. F., Carrillo R. E., Blanco-Velasco M., E.
Barner K., “ECG compression via matrix completion”,
EUSIPCO 2011.
Polania L. F., Carrillo R. E., Blanco-Velasco M., E.
Barner K., “Compressed sensing based method for
ECG compression”, 2011 IEEE International
Conference on Acoustics, Speech and Signal
Processing (ICASSP), 2011.
Mamaghanian H., Khaled N., Atienza D., Vandergheynst
P., ”Compressed Sensing for Real-Time Energy-
Efficient ECG Compression on Wireless Body Sensor
Nodes”, IEEE Trans Biomed Eng. 2011
Sep;58(9):2456-66.
Compressed Sensing and Classification of Cardiac Beats using Patient Specific Dictionaries
179
