
Towards Statistical Comparison and Analysis of Models
¨
Onder Babur
1
, Loek Cleophas
1,2
, Tom Verhoeff
1
and Mark van den Brand
1
1
Eindhoven University of Technology, 5600 MB Eindhoven, The Netherlands
2
Stellenbosch University, ZA-7602 Matieland, South Africa
Keywords:
Model-Driven Engineering, Model Comparison, Statistical Analysis, R, Vector Space Model, Clustering.
Abstract:
Model comparison is an important challenge in model-driven engineering, with many application areas such
as model versioning and domain model recovery. There are numerous techniques that address this challenge in
the literature, ranging from graph-based to linguistic ones. Most of these involve pairwise comparison, which
might work, e.g. for model versioning with a small number of models to consider. However, they mostly ignore
the case where there is a large number of models to compare, such as in common domain model/metamodel
recovery from multiple models. In this paper we present a generic approach for model comparison and analysis
as an exploratory first step for model recovery. We propose representing models in vector space model, and
applying clustering techniques to compare and analyse a large set of models. We demonstrate our approach
on a synthetic dataset of models generated via genetic algorithms.
1 INTRODUCTION
Models are considered as central parts in Model-
Driven Engineering (MDE), potentially orchestrating
the whole software development process. As MDE
gains popularity and widespread use, the complex-
ity and variety of models increase. To cope with
this problem, many approaches have been proposed:
model comparison, matching, merging, etc. These
approaches find many application areas in MDE,
e.g. merging different model versions or detecting
model clones. While the comparison techniques
range from graph-based to linguistic ones, most in-
volve pairwise or three-way (for model versioning
from a common ancestor) comparison.
Domain model recovery, on the other hand, tack-
les the problem of extracting the common domain
model out of various individual models; obtained ei-
ther directly or indirectly by reverse engineering. Two
examples of this can be drawn directly from our on-
going project for a flexible multiphysics engineer-
ing simulation framework: constructing (1) a stan-
dardized metadata schema that can support a number
of input formats/schemas, and (2) a common meta-
model/ontology to orchestrate the interoperability of a
heterogeneous set of tools. The study in (Babur et al.,
2015a) indicates the overwhelming number of tools in
The research leading to these results has been funded
by EU programme FP7-NMP-2013-SMALL-7 under grant
agreement number 604279 (MMP).
the domain, which makes it really difficult to extend
manual model extraction efforts such as in (Babur
et al., 2015b) to cover the whole domain.
As formulated above, domain model recovery
qualifies as another potential application area for
model comparison, but with a multiplicity of mod-
els to consider. This dimension has been diagnosed
in (Klint et al., 2013) as an interesting aspect to ex-
plore. (Rubin and Chechik, 2013) further discusses
the inadequacy of pairwise comparison techniques for
multiple models and proposes an N-way model merg-
ing algorithm. To the best knowledge of the authors
the statistical dimension of the generic model com-
parison problem has been largely overlooked.
In this paper, we present an initial attempt at
model comparison and analysis for large datasets us-
ing Information Retrieval (IR) techniques and statis-
tical analysis, as an exploratory first step in model re-
covery. In IR, a vector space model (VSM) is used to
represent text documents, with vector elements cor-
responding to word occurrence (incidence) or fre-
quency. We borrow this concept to represent mod-
els as vectors of the bigram combinations of related
model elements. This model, in turn, is supplied with
inverse document frequency and type-based weight-
ing scheme to compute distances of models in the
vector space. We then use the R statistical software
(Maechler et al., 2013) to cluster, analyse and visu-
alise the dataset. As an initial feasibility test of our
approach, we use synthetically generated model pop-
Babur, Ö., Cleophas, L., Verhoeff, T. and Brand, M.
Towards Statistical Comparison and Analysis of Models.
DOI: 10.5220/0005799103610367
In Proceedings of the 4th International Conference on Model-Driven Engineering and Software Development (MODELSWARD 2016), pages 361-367
ISBN: 978-989-758-168-7
Copyright
c
2016 by SCITEPRESS – Science and Technology Publications, Lda. All rights reserved
361

ulations obtained using the metamodel-driven model
mutation framework in (van den Brand et al., 2011).
Positioning Model Comparison as a First Step for
Model Recovery. Model comparison (Stephan and
Cordy, 2013) is found in the literature as a com-
mon operation in a wide range of application areas,
such as model versioning (Altmanninger et al., 2009),
model clone detection (Deissenboeck et al., 2010),
model merging (Brunet et al., 2006), model match-
ing (Kolovos et al., 2009) and model recovery (Klint
et al., 2013). It is typically defined as a binary opera-
tor (sometimes ternary in model versioning), mapping
two model elements to a similarity measure. It can be
categorized according to the output: boolean (exact
matchers), similarity category (e.g. near-miss clones
for model clone detection), or similarity degree (e.g. a
real number in the range [0.0, 1.0]).
Model recovery can be considered as an umbrella
term that encapsulates different approaches named
domain model recovery (Klint et al., 2013), meta-
model recovery (Javed et al., 2008), automated do-
main modeling (Reinhartz-Berger, 2010), etc. We can
regard model recovery as reverse engineering a com-
mon model out of several entities, either directly from
variant models, or from other sources such as design
documents and source code - adding another layer of
reverse engineering. For this paper, we choose to ig-
nore this second layer; instead we lift the problem
completely to the model level. So the starting point
for our consideration is a set of homogeneous mod-
els, representing a common domain. A concrete ex-
ample would be the class diagrams of similar soft-
ware packages. While these models share similarities
of the domain, no individual model is an instantiation
of a metamodel or a configuration of a feature model.
We would rather like to use model comparison in the
sense of analysing the similarities among models, try-
ing to find clusters and obtaining an overview of the
whole dataset. The analysis information can be re-
garded as a first exploratory step in domain model re-
covery from multiple models.
Information Retrieval and Clustering. Informa-
tion Retrieval (Manning et al., 2008) has a long his-
tory of developments in dealing with effectively in-
dexing, analyzing and searching various forms of con-
tent including natural language text documents. As
a first step for document retrieval in general, docu-
ments are collected and indexed via some unit of rep-
resentation. Index construction can be implemented
using models ranging from boolean indices to com-
plex neural networks. One such model is the vector
space model (VSM) with the following major steps:
• A vector representation of occurrence of the vo-
cabulary in a document (binary), named term in-
cidence;
• Optionally zones (e.g. ’author’ or ’title’ zones sep-
arate from the text bodies);
• Optionally weighting schemes to be used as mul-
tipliers such as:
– inverse document frequency (see Section 2) to
increase the discriminative effect of rare words;
– zone weights, e.g. higher for important zones.
Once the VSM is constructed, the similarity of
documents can be defined as the distance between
these vectors. There exist several distance/similarity
measures, such as Euclidian, Cosine or Manhattan.
VSM with a selected distance measure is the prerequi-
site for identifing common groups of documents in the
vector space. Among many different clustering meth-
ods (Jain and Dubes, 1988), K-means is a simple but
effective one. It aims to identify cluster centers and
minimises the residual sum of (squares of) distances
of the points assigned in each cluster. Hierarchical
clustering techniques assume an unknown number of
clusters and rather build a nested tree structure (den-
drogram) of the data points, representing proximities
and potential clusters.
Objectives. The purpose of this study is to answer
the following questions:
• RQ1. How can we represent models for N-way
comparison and analysis?
• RQ2. How can we analyse and compare a large
set of models?
2 METHOD FOR COMPARING A
LARGE SET OF MODELS
In this section, we elaborate our approach on a small
example. We describe the main steps as:
1. Obtaining a set of homogeneous models (of same
type, e.g. UML class diagram) to be analyzed.
2. Generating the bigram vocabulary from the input
models and the bigram types from the metamodel
(that is, the generic metamodel e.g. UML meta-
model, rather than lower level domain-specific
metamodels); types being similar to zones in IR.
3. Calculating the term incidence matrix with an idf
and type-based weighting scheme.
4. Analyse the dataset via simple K-means and/or hi-
erarchical clustering with Manhattan distance.
A Small Exemplary Dataset. First we define a
simple metamodel with basic building blocks, based
on the Ecore kernel at (Budinsky, 2004), to base our
MODELSWARD 2016 - 4th International Conference on Model-Driven Engineering and Software Development
362
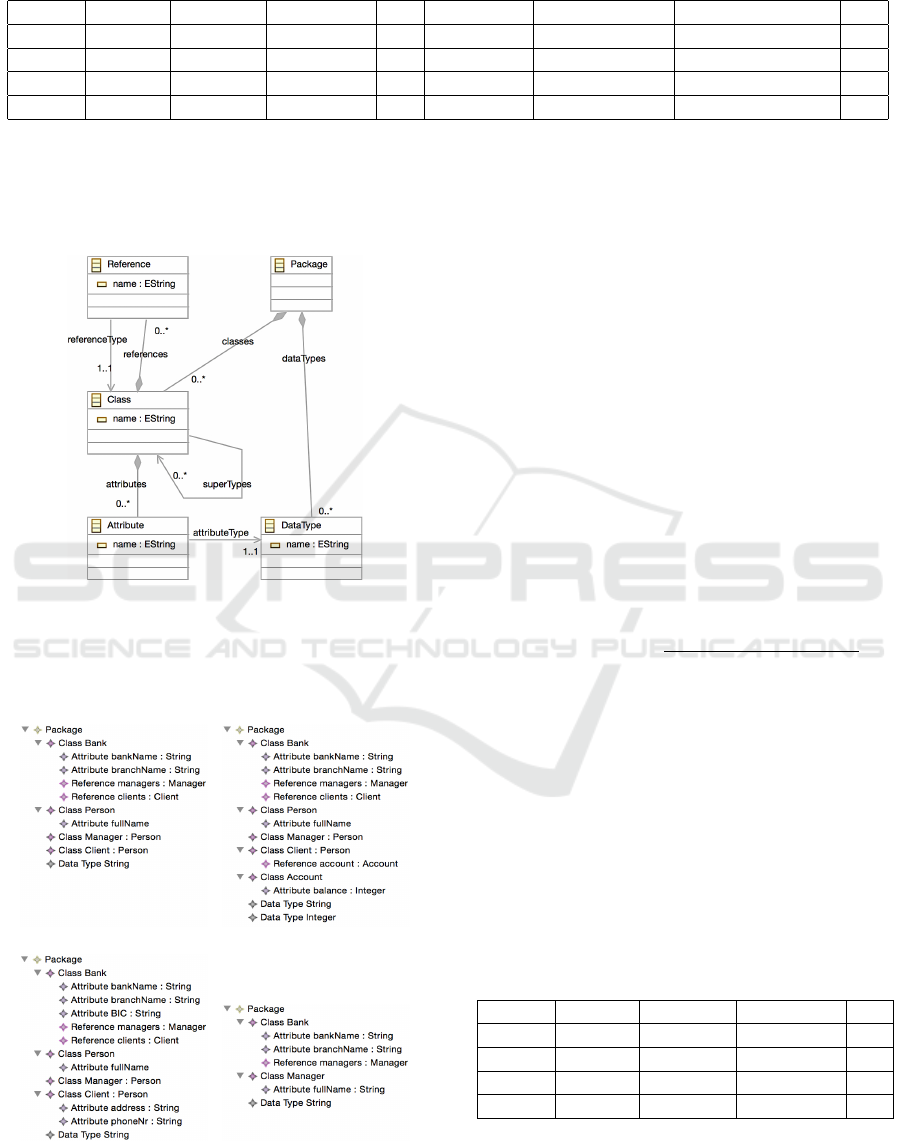
Table 1: Term incidence matrix of the input models. Note that some of the terms have been abbreviated due to space
constraints, e.g. rootPackage-Bank as r-Bank and Bank-managers as Bank-mrs.
Model r-Bank r-Person r-Account . . . Bank-mrs mrs-Manager Manager-Person . . .
M1 1 1 0 . . . 1 1 1 . . .
M2 1 1 1 . . . 1 1 1 . . .
M3 1 1 0 . . . 1 1 1 . . .
M4 1 0 0 . . . 1 1 0 . . .
experiments on; since real metamodels such as Ecore
are too large and complex for the purpose of this
study. Figure 1 demonstrates the metamodel to drive
the examples.
Figure 1: Simple metamodel for experiments.
Based on this metamodel, we construct four mod-
els with a few differences such as addition of new
classes or removal of attributes, depicted in Figure 2.
(a) Model 1 (b) Model 2
(c) Model 3 (d) Model 4
Figure 2: A small set of models.
Generating the Bigram Vocabulary. From the in-
put models and metamodel, we construct a typed
bigram vocabulary. The type information comes
from the metamodel: From Figure 1, we get the set
{classes, attributes, references, supertypes, refer-
enceType, attributeType dataTypes}. Next, we tra-
verse all the models to extract the union of bigrams as
our vocabulary: the examples in Figure 2 would yield
Model 1 = { rootPackage-Bank, rootPackage-
Person, . . . , Bank-bankName, . . . , bankName-
String, . . . } The choice of bigrams vs. unigrams cap-
tures relational information between model elements.
Calculating Term Incidence Matrix. The bigram
sets for each model allow us construct the term in-
cidence matrix as in Table 1. We propose to apply
a weighting scheme on the term incidence matrix,
which includes two multipliers: an inverse document
frequency (idf) and a type (zone) weight. The idf of
a term t is used to assign greater weight to rare terms
across models, and is defined as:
id f (t) = log
10
1 +
# total models
# models with the term t
Furthermore, a type weight is given to the bigrams
representing their semantic importance. We claim, for
instance, that classes are semantically more impor-
tant than attributes, thus deserve a greater weight. We
have used this experimental scheme for this paper:
zoneWeight(t, w) : {classes → 1.0, attributes → 0.5,
dataTypes→ 0.5, references→ 0.5, supertypes→ 0.2,
referenceType → 0.2, attributeType → 0.2}
The resulting matrix where term incidences are
multiplied by idf and weights is given in Table 2.
Table 2: Idf and type weighted matrix.
Model r-Bank r-Person r-Account . . .
M1 0,30 0,37 0 . . .
M2 0,30 0,37 0,70 . . .
M3 0,30 0,37 0 . . .
M4 0,30 0 0 . . .
K-means Clustering. As the next step of our ap-
proach, we reduce the model similarity problem into
a distance measurement of the corresponding vector
Towards Statistical Comparison and Analysis of Models
363

representations of models. Among various measures,
Manhattan distance seems to be suitable since it cor-
responds to the edit distance of two models. p and
q being two vectors of n dimensions, Manhattan dis-
tance is defined as:
manhattan(p, q) =
n
∑
i=1
|p
i
− q
i
|.
While clustering makes little sense for our small
example dataset we can still compute the center of just
one cluster and the distances of models to the center.
The center can be considered as a rough average of
that cluster. Similarly, the model closest to the center
can be considered as a representative of that cluster.
The models’ distances to center are given in Figure 3.
●
●
●
●
M1 M2 M3 M4
123
Distances
Models
Figure 3: Distances of models to the cluster center.
3 A DATASET FOR MODEL
COMPARISON
Model Mutation Framework. We use the model
mutation framework in (van den Brand et al., 2011)
to synthetically generate populations of models to
be used for comparison. The framework is capa-
ble of generating mutations on a model based on its
metamodel, i.e. the mutated instances will still be
metamodel-compliant. It can be configured to gener-
ate random distribution of different types of mutations
such as addition, removal or modification of model el-
ements. For more information on the features and op-
eration, please refer to (van den Brand et al., 2011).
Synthetic Generation of Model Populations. Us-
ing the mutation framework, we have generated a sim-
ple setting for creating model populations based on
the metamodel in Figure 1 and a slightly modified
version of the bank model example in Figure 2. The
goal is to emulate a model population evolved from
a common model (e.g. a hypothetical domain model).
The genetic algorithm starts with the initial generation
consisting of only M
0
, i.e. the root model. At every it-
eration, the set of models at that level (called a gener-
ation) is mutated with one atomic addition (with 70%
probability) or removal (with 30% probability) oper-
ator. The number of offsprings generated at each iter-
ation is set by a branching factor b, and the total num-
ber of iterations is set by a generation count n. For
our experiments, we did not consider any fitness func-
tion (i.e. every generated model survives) or crossover
operations. One further simplification is that modifi-
cation of model elements (e.g. renaming) is also not
included as a mutation operator.
The algorithm basically creates tree structures rep-
resenting model generations with atomic mutations at
each branch. Following this setting, we have gener-
ated one dataset to test our approach: with b = 2 and
n = 5, where we keep the older generations and thus
have the whole population tree.
4 EXPERIMENTS & DISCUSSION
Experiment on the Whole Tree. The first analysis
on the dataset was determining the number of clusters,
k. A simple method for this is running the clustering
for a range of 1 to a suitably large N and visualis-
ing the total sum of squares within clusters. Figure 5
shows these numbers for N = 15. A visual heuris-
tic was used for locating ’elbows’ in the plot, poten-
tially good candidates for k. Inspecting the figure, we
picked k = 7 by its significant drop after k = 6, and
the relative saturation after k > 7.
We in turn cluster the dataset with Manhattan dis-
tance and k = 7. The tree-like structure of model pop-
ulation, with each node as one model, branch as a mu-
tation, and depth as a generation, allows a good visu-
alisation of the clustering algorithm. The clustering
was done with the Kmeans function of amap package
and the result is depicted in Figure 4. Each cluster was
coded with a unique colour/pattern. The visualisation
agrees with the initial intention; populations evolve in
different directions and start to form clusters.
Experiment on the Leaves. We would also like to
analyse the set of models, finding representative mod-
els and outliers among them. To emulate this sce-
nario, we used only the youngest generation (i.e. the
leaves of the tree) to cluster. First we clustered the set
with just k = 1 to find a center and plot the distances
of each model to the center, depicted in Figure 6. Two
implications are that there are no representative mod-
els close enough to the center, and no visible outliers
within the single cluster. This is expected as mod-
els have accumulated mutations over generations and
form separate clusters (Figure 4).
This scenario is suitable for applying hierarchical
clustering just on the leaves, and try to reconstruct a
hierarchical similarity scheme resembling the one in
Figure 4. Indeed, we obtained a dendrogram of the
models using the hclust function in stats package with
Manhattan distance, given in Figure 7. The nodes on
MODELSWARD 2016 - 4th International Conference on Model-Driven Engineering and Software Development
364
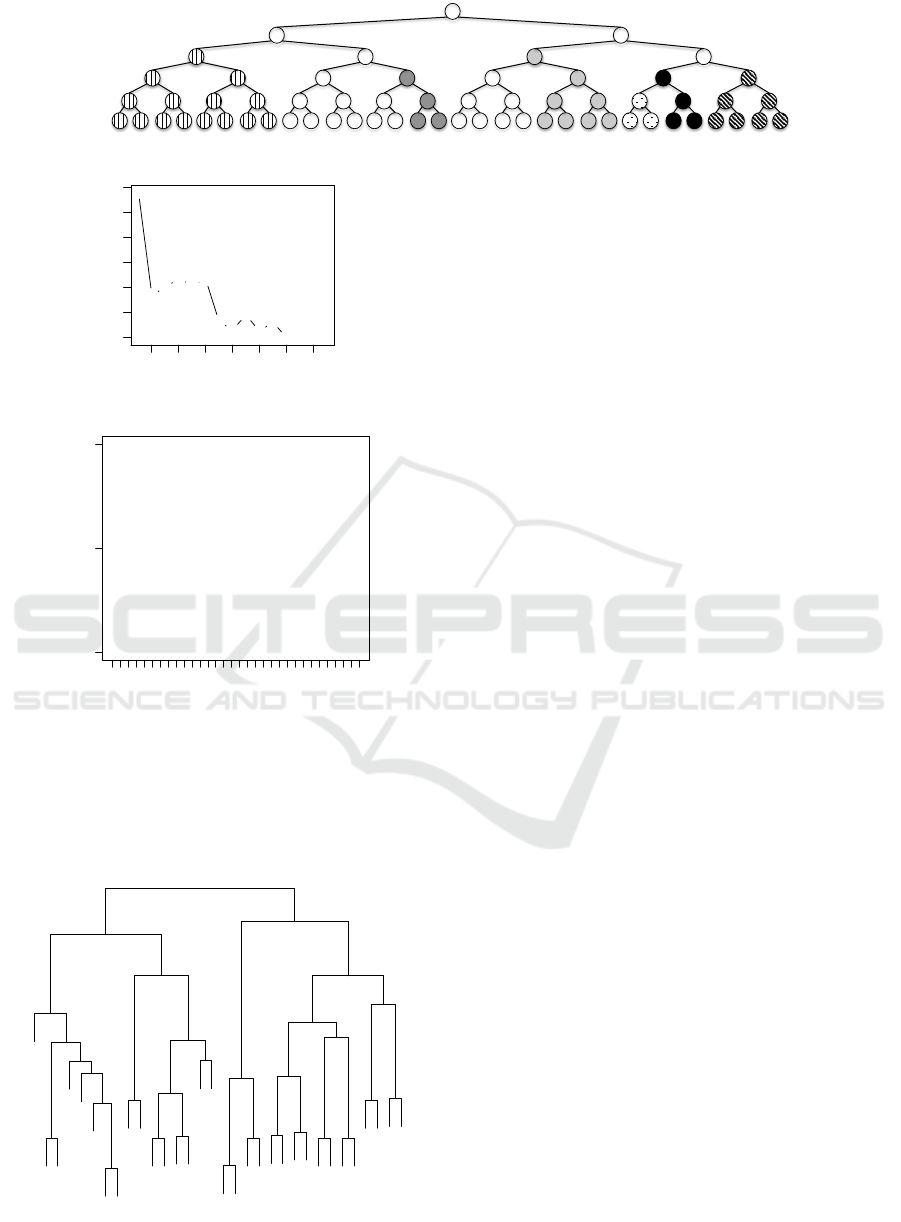
Figure 4: Population tree with 7 clusters.
●
●
●
●
●
●
●
●
●
●
●
●
●
●
●
2 4 6 8 10 12 14
50 60 70 80 90 110
Number of Clusters
Within groups sum of squares
Figure 5: Total sum of squares within clusters vs # clusters.
●
●
●
●
●●
●
●
●
●
●
●
●
●●
●
●
●●
●●
●
●
●●
●●
●
●●
●
1 4 7 10 13 16 19 22 25 28 31
6 7 8
Manhattan distances to center
Models
Figure 6: Distances of the leaf models to the center.
the dendrogram are labelled 1 to 32 and correspond
to the consecutive leaves from left to right in Fig-
ure 4. There is an obvious resemblance between the
two structures; the dendrogram can be interpreted as
an approximate reconstruction of the population tree.
11
15
16
14
13
12
9
10
3
4
5
6
1
2
7
8
23
24
21
22
17
18
19
20
25
26
27
28
29
30
31
32
0 2 4 6 8 10
Cluster Dendrogram
hclust (*, "complete")
d
Height
Figure 7: Hierarchical clustering - dendrogram.
An Initial Assessment of our Approach. Based on
our experiments, a statistical perspective on the com-
parison and analysis of large datasets seems promis-
ing. While the dataset was synthetic and relatively
small, we were able to obtain intuitive results. Using
VSM allows a uniform representation of models for
statistical analysis, while the accompanying idf and
type-based weighting scheme yields a suitable scal-
ing in the vector space (RQ1). Using a distance mea-
sure and clustering over VSM, many characteristics
and relations among the models, such as representa-
tives, clusters and outliers, can be analysed (RQ2).
An advantage of our approach is the scalability
and tool support. The algorithm complexity range
from linear (e.g. VSM construction) to polynomial
(e.g. K-means as observed complexity and hierarchi-
cal clustering) with respect to the number and size
of models. Moreover, R provides a plethora of ef-
ficient and flexible statistical libraries for analysis.
Metamodel-based construction of the bigram vocab-
ulary provides a good amount of reduction in vector
space, improving over basic IR indexing.
Threats to Validity. While our initial experiments
indicate the potential of our approach for large-scale
model comparison and analysis, there are a number
of threats to validity. The biggest one is that we have
used a synthetic, simplified and homogeneous dataset.
The variations in the synthetic dataset are simpler than
in a real world scenario where larger, more complex
and possibly heterogeneous models are reverse engi-
neered from different tools. For instance, we currently
handle neither Natural Language Processing (NLP)
issues such as synonyms/renamings, nor semantical
equivalence of model elements. Furthermore, while
the general architecture of our approach seems plausi-
ble, we have not evaluated other options for individual
steps; but chosen them intuitively as a first attempt.
5 RELATED WORK
Only a few model comparison techniques consider
the multiplicity of input models without doing pair-
wise comparisons, such as N-way merging based on
weighted set packing in (Rubin and Chechik, 2013).
Feature model extraction (She et al., 2011) and con-
Towards Statistical Comparison and Analysis of Models
365

cept mining (Abebe and Tonella, 2010) use NLP to
cluster features/concepts. (Ratiu et al., 2008) builds
domain ontologies as the intersection of graphs of
APIs, but does not focus on the statistical dimension
of problem. Metamodel recovery (Javed et al., 2008)
is another approach which assumes a once existing
(but somehow lost) metamodel, and does not hold for
our scenario. (Dijkman et al., 2011) applies a tech-
nique similar to ours, specifically for business pro-
cess models using process footprints and thus lacks
the genericness of our approach. Note that a thor-
ough literature study beyond the technological space
of MDE, for instance regarding data schema match-
ing and ontology matching/alignment, is out of scope
for this paper and is therefore omitted.
6 CONCLUSIONS AND FUTURE
WORK
In this paper, we have presented a new perspective
on the N-way comparison and analysis of models as
a first step in model recovery. We have proposed a
generic approach using the IR techniques VSM and
tf-idf to uniformly represent multiple models, and ap-
ply statistical analysis with K-means and hierarchi-
cal clustering. Using a model mutation framework,
we have synthetically generated a dataset to apply our
method and demonstrate its potential uses. The re-
sults indicate that our approach is a promising first
step for analysing large datasets, being generic and
scalable/efficient using R.
As future work, the most important goal is to work
with real datasets of possibly heterogeneous models,
rather than the synthetic one. A real dataset (e.g. class
diagrams of multiple domain tools) can be acquired
through reverse engineering, which we have omitted
for this paper. The NLP or semantic issues pose the
next set of challenges to tackle. A careful assessment
of different and more advanced options for model rep-
resentation, distance measures, and clustering tech-
niques needs to be done in order to increase the accu-
racy and efficiency of our approach. Although this is
presented as an exploratory step, it can also be inves-
tigated how VSM and clustering information can be
used for model merging and domain model recovery.
REFERENCES
Abebe, S. L. and Tonella, P. (2010). Natural language pars-
ing of program element names for concept extraction.
In Program Comprehension (ICPC), 2010 IEEE 18th
International Conference on, pages 156–159. IEEE.
Altmanninger, K., Seidl, M., and Wimmer, M. (2009). A
survey on model versioning approaches. International
Journal of Web Information Systems, 5(3):271–304.
Babur,
¨
O., Smilauer, V., Verhoeff, T., and van den Brand, M.
(2015a). Multiphysics and multiscale software frame-
works: An annotated bibliography. Technical Report
15-01, Dept. of Mathematics and Computer Science,
Technische Universiteit Eindhoven, Eindhoven.
Babur,
¨
O., Smilauer, V., Verhoeff, T., and van den Brand,
M. (2015b). A survey of open source multiphysics
frameworks in engineering. Procedia Computer Sci-
ence, 51:1088–1097.
Brunet, G., Chechik, M., Easterbrook, S., Nejati, S., Niu,
N., and Sabetzadeh, M. (2006). A manifesto for model
merging. In Proc. of the 2006 Int. Workshop on Global
Integrated Model Management, pages 5–12. ACM.
Budinsky, F. (2004). Eclipse modeling framework: a devel-
oper’s guide. Addison-Wesley Professional.
Deissenboeck, F., Hummel, B., Juergens, E., Pfaehler, M.,
and Schaetz, B. (2010). Model clone detection in prac-
tice. In Proc. of the 4th Int. Workshop on Software
Clones, pages 57–64. ACM.
Dijkman, R., Dumas, M., Van Dongen, B., K
¨
a
¨
arik, R.,
and Mendling, J. (2011). Similarity of business pro-
cess models: Metrics and evaluation. Inf. Systems,
36(2):498–516.
Jain, A. K. and Dubes, R. C. (1988). Algorithms for clus-
tering data. Prentice-Hall, Inc.
Javed, F., Mernik, M., Gray, J., and Bryant, B. R. (2008).
Mars: A metamodel recovery system using grammar
inference. Inf. and Software Tech., 50(9):948–968.
Klint, P., Landman, D., and Vinju, J. (2013). Exploring the
limits of domain model recovery. In Software Mainte-
nance (ICSM), 2013 29th IEEE International Confer-
ence on, pages 120–129. IEEE.
Kolovos, D. S., Ruscio, D. D., Pierantonio, A., and Paige,
R. F. (2009). Different models for model matching:
An analysis of approaches to support model differenc-
ing. In Comparison and Versioning of Software Mod-
els, 2009. ICSE Workshop on, pages 1–6. IEEE.
Maechler, M., Rousseeuw, P., Struyf, A., Hubert, M., and
Hornik, K. (2013). cluster: Cluster Analysis Basics
and Extensions. R package version 1.14.4.
Manning, C. D., Raghavan, P., Sch
¨
utze, H., et al. (2008).
Introduction to information retrieval, volume 1. Cam-
bridge university press Cambridge.
Ratiu, D., Feilkas, M., and J
¨
urjens, J. (2008). Extracting
domain ontologies from domain specific apis. In Soft-
ware Maintenance and Reengineering, 2008. CSMR
2008. 12th European Conf. on, pages 203–212. IEEE.
Reinhartz-Berger, I. (2010). Towards automatization of
domain modeling. Data & Knowledge Engineering,
69(5):491–515.
Rubin, J. and Chechik, M. (2013). N-way model merging.
In Proc. of the 2013 9th Joint Meeting on Foundations
of Software Engineering, pages 301–311. ACM.
She, S., Lotufo, R., Berger, T., Wøsowski, A., and Czar-
necki, K. (2011). Reverse engineering feature models.
In Software Engineering (ICSE), 2011 33rd Interna-
tional Conference on, pages 461–470. IEEE.
MODELSWARD 2016 - 4th International Conference on Model-Driven Engineering and Software Development
366

Stephan, M. and Cordy, J. R. (2013). A survey of model
comparison approaches and applications. In Model-
sward, pages 265–277.
van den Brand, M., Hofkamp, A., Verhoeff, T., and Proti
´
c,
Z. (2011). Assessing the quality of model-comparison
tools: a method and a benchmark data set. In Proc. of
the 2nd Int. Workshop on Model Comparison in Prac-
tice, pages 2–11. ACM.
Towards Statistical Comparison and Analysis of Models
367
