
Energy Saving and Efficiency Tool
A Sectorial Decision Support Model for Energy Consumption Reduction in
Manufacturing SMEs
Samuele Branchetti, Gessica Ciaccio, Piero De Sabbata, Angelo Frascella, Giuseppe Nigliaccio
and Marco Zambelli
ENEA - Italian National Agency for New Technologies, Energy and Sustainable Economic Development,
Via Martiri di Monte Sole 4, Bologna, Italy
Keywords: Energy Efficiency, Energy Saving Measures, Intelligent Models, Rule Sets, Benchmark, Self-diagnosis,
Sustainable Economy, Energy Consumption Awareness.
Abstract: The problem of Energy Efficiency in industry is a hot topic but companies are not still implementing, on a
mass scale, energy efficiency actions. One of the most important barriers is that companies are scarcely
aware of their consumptions and consider energy as a fixed cost and not as a resource to be managed. In this
paper it is proposed a model, based on self-analysis of consumptions, for facing this barrier. On the base of
this model, a software tool, Energy Saving and Efficiency Tool (ESET), was designed as a starting point of
an energy diagnosis path for SMEs. ESET was developed for textile/clothing sector but the model is general
and, starting from it, similar sectorial tools can be developed. The tool provides different kinds of outputs:
best practices, for helping companies to improve its own energy performances; energy efficiency indices,
compared with reference values; energy use behaviours. Particularly, best practices are selected using a
large set of rules, distilled from the experience of professional energy auditors. The analysis of the accuracy
and completeness of ESET results was performed on six companies selected among all those involved in
ESET testing and application. The results of this evaluation are very encouraging.
1 INTRODUCTION
The manufacturing sector plays an important role in
European economy, since it represents 10% of all
enterprises in the non-financial sector and accounts
for 80% of European exports (European
Commission Factories of the Future, 2013). Its
global turnover in Europe is around 7.080.000
million of € and the total amount of energy costs is
about 140.000 million of € (EUROSTAT, 2013).
Moreover, 99,6% of the 5,1 millions of enterprises
operating in the manufacturing and construction
European sectors are SMEs (3E, 2013).
The problem of Energy Efficiency (EE) in
industry is a hot topic, since the need for reducing
the impact of human activities on the environment
and for saving resources, as raw material and
energy, has become urgent and therefore there is a
strong commitment from policy. Policy instruments
can be split into four main categories: instruments
for planning (like strategies and national
programmes of action), institutional organizations
(like EE implementation management organizations
or cooperation of administrative and municipal
management bodies), financial instruments (like
public investment programme and EE funds) and
communicative instruments (like institutional day of
information) (Ekmanis, 2010).
A certain number of studies has been developed
about energy efficiency methodologies, going from
general energy management methodologies
identifying steps for getting energy efficiency
(Capobianchi, 2011), to models for assessing energy
saving measures (Doukas, 2009; Doukas, 2006).
Moreover, further studies were performed focusing
on (both general and process specific) techniques
and opportunities for energy efficiency, that in the
following sections we refer globally as “best
practices” (Worrell, 2009). The main references, on
these topics, are the Best Available Techniques
(BATs) elaborated from the European IPPC Bureau,
330
Branchetti, S., Ciaccio, G., Sabbata, P., Frascella, A., Nigliaccio, G. and Zambelli, M.
Energy Saving and Efficiency Tool - A Sectorial Decision Support Model for Energy Consumption Reduction in Manufacturing SMEs.
In Proceedings of the 5th International Conference on Smart Cities and Green ICT Systems (SMARTGREENS 2016), pages 330-339
ISBN: 978-989-758-184-7
Copyright
c
2016 by SCITEPRESS – Science and Technology Publications, Lda. All rights reserved

following the request Article 13(1) of the Industrial
Emissions Directive (The European Parliament and
The Council of the European Union, 2010).
These Best Available Techniques Reference
Documents (BREFs) contain, for each industrial
sector, the more effective techniques for getting a
high level of environment protection and pollution
control, including energy consumption issues.
Considering the previous points (policy
commitment, availability of energy management
standard, methodologies and best practices) why are
companies still not implementing, on a mass scale,
energy efficiency actions? A good answer is
proposed by Dörr (2013), which identifies the
following barriers:
distance between industrial needs and scientific
results;
high costs for the implementation of a company
energy management system, measuring devices
and additional ICT structures;
too general and abstract description of energy
management systems in ISO 50001, that is the
reference standard in this field (ISO, 2011).
The problem of energy efficiency was faced by the
authors of this paper through a series of projects
funded by the European Commission (ARTISAN,
SESEC and SET), focused on Textile and Clothing
sector as pilot (turnover around 150.000 million of €
in 2012 and total amount of energy costs about
2.600 million of €, with peaks of energy intensity
near to 30% for some subsectors like dyeing
(EUROSTAT, 2013)).
Moreover a European informative campaign,
Energy Made to Measure (EM2M), led by the
European industry association (EURATEX), was
launched in 2014 with the aim of improving real
European companies in their energy efficiency
awareness.
From these activities, a further barrier was
identified, which precedes, in time and in logic, the
previous ones: the companies of the sector (and,
more generally, SMEs), have still very scarce
awareness of their consumptions. The main reason is
that they consider energy as a fixed cost that has to
be paid instead than a resource that can be managed
and used in a more efficient way.
In order to overcome this barrier, a path was
defined based on self-analysis of consumptions,
collection of data for improving benchmarks and
suggestion of customised best practice lists
(unfortunately the Textile/Clothing sector BREF is
not so recent, since its date goes back at 2003).
For this purpose, a set of software tools was
developed in the last years, in the context of the
above quoted projects, for supporting companies in
understanding their energy performances, comparing
them with sectorial benchmarks and identifying
which actions could be implemented for improving
their own efficiency.
In this paper the self-analysis standalone tool,
called ESET Tool, developed through the activities
of SET project, will be analysed.
There exist other self-analysis tools, developed
by other initiatives and European projects. Ten tools
were analysed (Table 1), eight for industry and two
for buildings, and compared with ESET Tool.
Among the industry tools, four of them address
specific sectors, two are targeted on specific kinds of
Table 1: Outputs provided by the analysed tools and by ESET Tool.
Audit
results
Energy
savings
Energy
indicators
List of best
practices
Payback
period
Green house
emission / reduction
Cost
savings
Plant Energy Profiler X X X
FanSave X X X X
PumpSave X X X X
AMETHIST X
LiCEA X X
A2A X X X X X X
SEAS 2.0 X X
SENECA X
Green Gain X
Energy Performance
Indicator Tool
X X X
ESET X X X X X X
Energy Saving and Efficiency Tool - A Sectorial Decision Support Model for Energy Consumption Reduction in Manufacturing SMEs
331
subsystems (pumps and fans) and the others are
general.
The inputs required by each of the analysed tools
were compared and two possible approaches were
identified:
very detailed set of inputs (bottom-up approach):
these kinds of tools have a very affordable
output, but filling them is a complex activity and
requires a deep knowledge of company processes
and of related consumptions;
macro-level set of inputs (top-down approach):
in this case there is a loss of details in the final
output, but data analysis is much easier and
quicker.
The second approach is more attractive for the
companies, but the first one gives more effective
results. So, for the ESET Tool a partial and/or
progressive filling approach was chosen.
Furthermore, even with a not complete filling of the
tool, some results are given: the more the input is
complete, the more the output is comprehensive and
faithful. This strategy is thought for making the tool
attractive and for allowing companies to deepen the
self-analysis process, after having observed their
main energy indicators.
Another important point of view for this
comparison is the provided output.
From this point of view, Table 1 shows that the
ESET Tool provides the more complete set of
outputs, among the analysed tools.
A last important point is that, although ESET
Tool is sector specific, it is thought to be easily
portable on different sectors, by developing and
upgrading the model toward other industrial sectors.
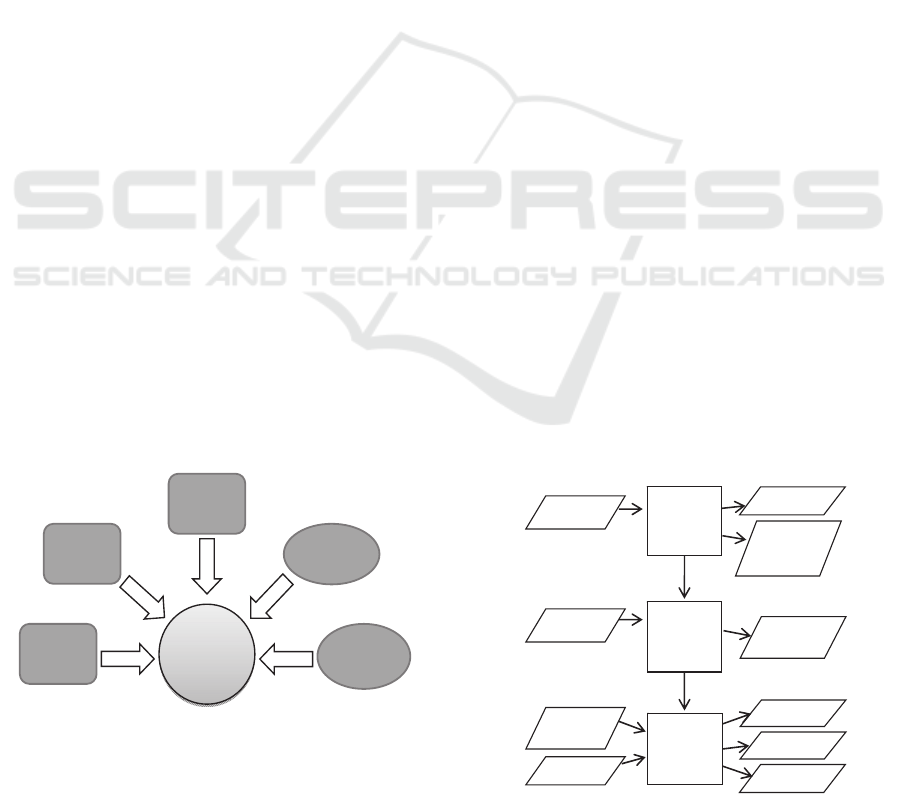
2 THE PROPOSED MODEL
ESET
Financial
incentives
Legal
obligations
Guiding
document
ESETWEB
ESETTool
Figure 1: General ESET structure.
The ESET Tool is the starting point of a group of
instruments developed under SET project, including
(in addition to ESET Tool) a web application (ESET
Web), a guiding document and further documents
reporting Financial incentives and Legal obligations
(Figure 1).
The main scope of this article is to present ESET
Tool and the model behind it, with some references
to ESET Web.
2.1 Structure and Approach
Thanks to previous experiences (ARTISAN and
SESEC) we have learnt that companies which deal
with energy efficiency issues, even for the first time,
are interested in receiving indications about
measures they could implement in the factories in
order to reduce energy consumptions and related
costs (possibly with a short payback time); they also
find useful obtaining a series of indices, calculated
on yearly and monthly basis, which give them a
view of their behaviours; particularly they would
like to know which aspects influence their
consumptions or their costs; moreover, they would
like to understand how much their performances
differ from their peers, nationally or on European
scale.
Starting from these learned lessons, the
following outputs were defined:
best practices
indices and comparison with peers
behaviours.
It was immediately clear that a certain amount of
company data is needed, but companies are often not
able to find energy data easily or, if asked for too
many data, they prefer to renounce.
To face this point, ESET was designed with a
step-by-step approach, involving ESET Tool and
ESET Web, asking factories data, organizing them
in self-consistent sections and giving back the
related outputs progressively (Figure 2).
Step1
(ESETTool)
Step2
(ESETTool)
Yearly
data
Monthlyand
Processdata
Step3
(ESETWeb)
Data
uploadedby
ESETtool
Machines
specificdata
Cross‐cutting
BestPractices
Indices
Process
specificBest
Practices
Benchmark
Technology
basedModel
Performances
against
Eurostatdata
elaborations
Figure 2: Flow chart of ESET.
SMARTGREENS 2016 - 5th International Conference on Smart Cities and Green ICT Systems
332

In details, in the first step user is asked to insert
basic yearly information of the factory (data on
business, turnover, production, purchased energy,
cogeneration and energy generation when available,
energy uses). The results are some global energy
indices and a list of recommended best practices,
independent from the production processes (cross-
cutting), which could be applied in the factory and,
consequently, could contribute to reducing energy
consumptions associated to auxiliary systems.
In the second step the ESET Tool requires more
detailed data related to productive phases and
technologies and, on monthly base, production and
energy consumptions. The outputs in this case are
diagrams which analyse monthly data variations and
a list of recommended process specific best
practices. The suggested measures, if applied, could
lead to a reduction in energy consumptions
associated to production processes.
A third step is under test (ESET Web) and aims
to extend and deepen the analysis on factories data
with new indices, performances comparison against
dynamic personalised energy benchmarks;
furthermore a section is dedicated to “Technologies
based models” for the main textile processes, that
allows to calculate the expected theoretical
consumption for single machine or department.
Companies are allowed to access the web
application and its services by anonymously sending
their data through ESET Tool, at the end of the
second step.
The data required by ESET Tool can be retrieved
by companies from the following sources:
purchased energy (amount and costs) usually
available from bills;
production data retrieved from company’s ERP
(Enterprise Resource Planning system);
information on factory organization, processes
and technologies provided by company’s
production technician.
The effort to complete the data set needed by ESET
Tool depends on the capability of the company in
monitoring their production and on their internal
organization.
Anyway, the total time necessary to apply
effectively ESET Tool to a factory ranges from few
hours to a working day.
2.1.1 Best Practices
A list of best practices for improving energy
efficiency in an industrial factory was identified on
the base of several resources: the performed energy
audits, the experience of ENEA experts in the textile
sector, the Berkeley Lab document about Energy-
Efficiency Improvement Opportunities for the
Textile Industry (Hasanbeigi, 2010), the EMS
project outcome (EMS-Textile, 2006), the BAT
document (IPPC, 2003) and the ENEA document
about rational use of energy in textile sector
(Paganelli, 1997).
The review of state of art in energy efficient
measures allowed to split the identified best
practices into the following categories:
Cross-cutting measures
- Reduction of peak power
- Lighting
- Heating/Air conditioning
- Electric motors
- Compressed air
- Pumping systems
- Fan systems
- Steam systems
- Vacuum systems
Sector specific measures (e.g. for textile) for
- yarn production machinery
- fabric production machinery
- finishing systems
The rationalization of the best practices list was
made in two phases.
At first, the best practices list was enriched with
indicative information about:
investment cost
energy saving (fuel and/or electricity)
order of magnitude of payback time.
Then, they were prioritized on the base of the
expected cost, benefit and payback time.
Finally a list of 117 cross-cutting best practices
and 113 process specific best practices was created
(CITEVE, 2014). Each of the identified measures
was linked to a process or kind of machinery,
organized and classified in a hierarchical
classification which covers the most relevant textile
processes and the related phases and technologies.
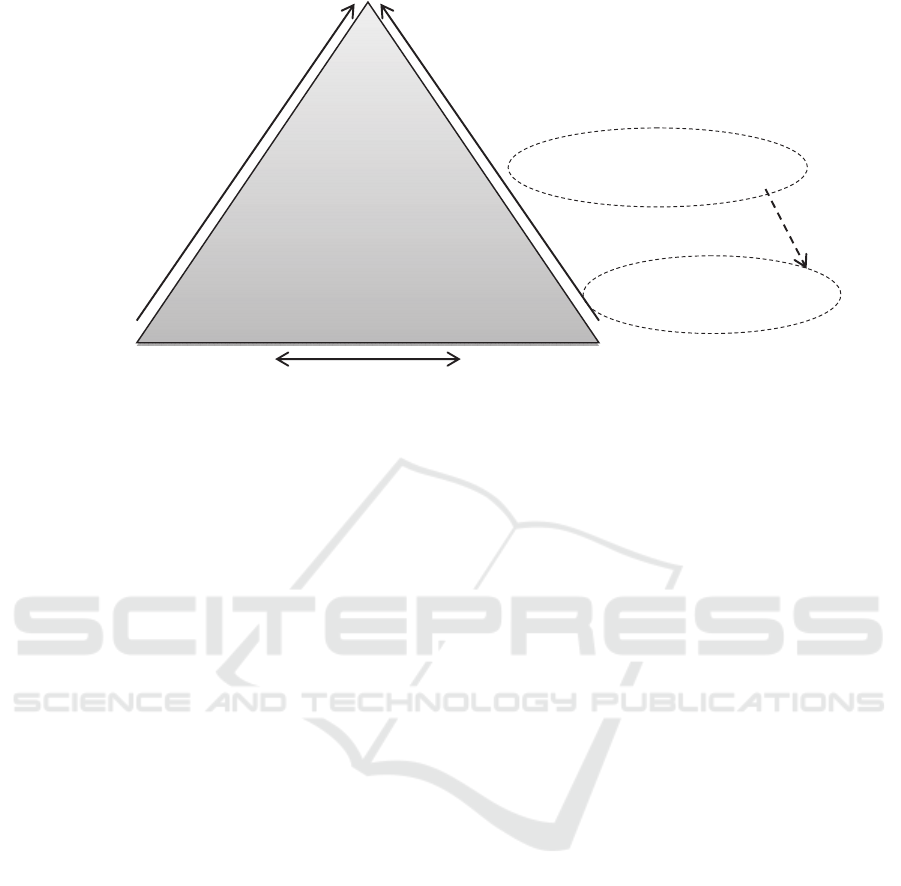
2.1.2 Comparison of Performances
As reported by a study (Asia Pacific Energy
Research Centre, 2000), moving down along the
pyramid of Figure 3 the faithfulness of energy
indices increases, but the data aggregation level falls
down, the quantity of data required increases and
finding an appropriate benchmark becomes much
more difficult.
Taking into account these dynamics, we have
built a system to support a twofold level of indices,
Energy Saving and Efficiency Tool - A Sectorial Decision Support Model for Energy Consumption Reduction in Manufacturing SMEs
333
Efficienc
y
Anal
y
sis Level
Data A
gg
re
g
ation Level
Q
uantit
y
of data re
q
uired
National Energy Intensity
(Mtoe/$GDP)
International
Statistics
National
Statistics
Sectoral
Statistics
Sub-sectoral
Statistics
Individual
Plant Data
Operational Unit Efficiency
(toe/tonne production)
Individual Plant Efficiency
(toe/tonne)
Sub-sectoral Efficiency
(Mtoe/tonne production or Mtoe/$)
Sectoral Energy Intensity
(Mtoe/$value added)
E
SET Sectoral
references
ESET
Benchmarks
Figure 3: The ESET shifting to Operational Unit Efficiency level on the Energy Efficiency Indicator Pyramid. Elaboration
from Asia Pacific Energy Research Centre (2000) and Phylipsen (1998).
in order to enrich the data analysis moving to the
“Operational Unit Efficiency” level of the pyramid:
Step 1 and Step 2 outputs: sectorial reference
values built on an elaboration of national
Eurostat data based on NACE categories
(finishing, yarn and fabric production);
Step 3 outputs: comparison of internal indices
towards energy benchmarks for textile processes,
dynamically built around the target company
from a centralized database by ESET Web.
The sectorial reference values used in Step 1 and
Step 2 are stored inside the ESET Tool and allow
companies to perform a first comparison. They
consist in four main classes of indices:
Energy cost / turnover (%)
Energy consumption / turnover (toe/Euro)
Energy cost / production (Euro/kg)
Energy consumption / production (toe/kg).
Nevertheless the Eurostat data refers to NACE
categories for the textile industry that are too general
and include kinds of factories very different. This
has led to consider a different approach. In Step 3,
energy benchmarks are built dynamically through a
company profiling approach, based on a centralised
database which collects companies data from the
ESET Tool, and on a web application which
calculates the customised energy benchmarks and
executes further elaborations.
This is a work in progress within the SET
European project, which is involving a number of
textile companies (300) in the application of ESET.
The logic and the methodology of the energy
benchmarks definition deserves an in-depth analysis
and will better explained in an ad hoc paper.
2.1.3 Company Behaviour
To get information about how companies use
energy, it is highly interesting to investigate the
relationship between production and energy
consumptions: in other words how the energy
consumption variation is related to the production.
One of the data analysis performed by ESET
Tool is a regression analysis to check the existence
of a linear relationship between production
(independent variable) and energy consumptions
(dependent variables). Specifically, ESET
implements a linear regression where the model
parameters (slope and interception of the best fit
line) are estimated from monthly data (Figure 4).
The extent of linear relationship is evaluated
through the R-square, that is the square of Pearson
product moment correlation coefficient.
In details, if R-square is close to 1 the model fits
well the data, the consumptions appear strongly
related to the production and the following
indicators can be evaluated:
consumption when production is zero, which
represents those consumptions not directly
related to production and includes avoidable and
unavoidable consumptions;
consumption for each additional unit, the energy
required to produce each additional unit of
product;
SMARTGREENS 2016 - 5th International Conference on Smart Cities and Green ICT Systems
334
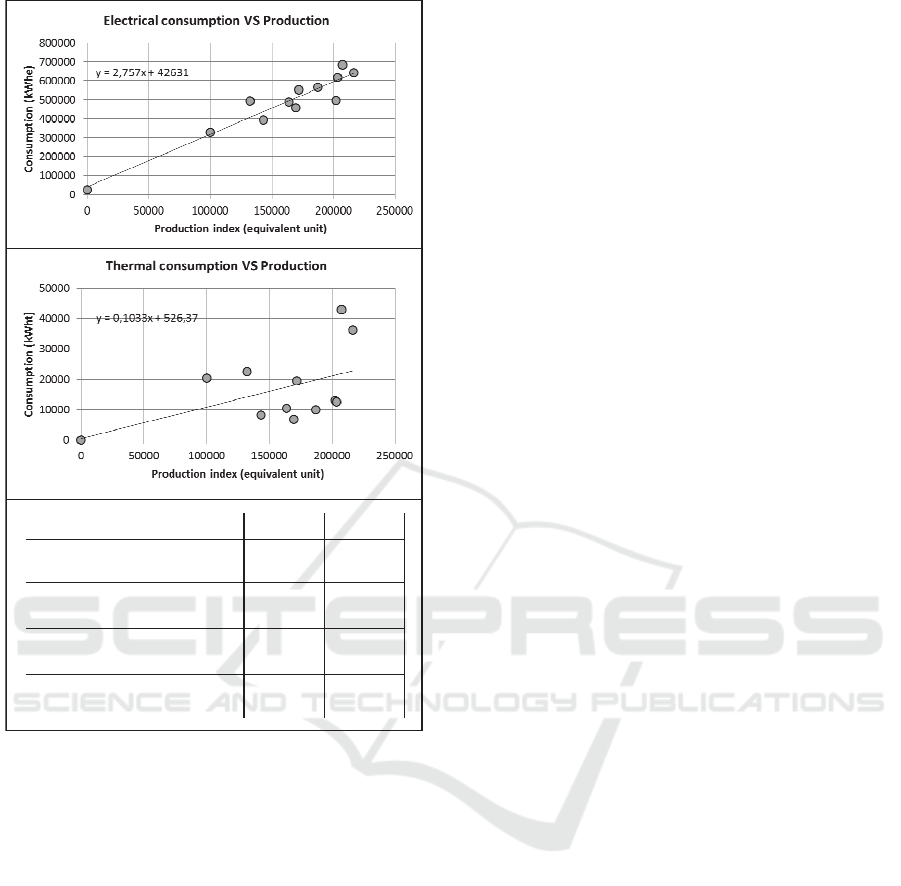
Electrical Thermal
R‐square
Consumptionwhenproductionis
zero(kWh)
Consumptionforeachadditional
equivalentunit(kWh/eq.unit)
Baseenergyconsumption(%)
0,91
0,26
42.630,5 526,37
2,76
0,10
8,90 3,12
Figure 4: One of ESET Tool outputs (regression analysis)
from a real case. The electric consumption shows a strong
relationship with the production, while the thermal
consumption appears poorly related (due to winter heating,
production changes, other).
base energy consumption, which is the energy
portion not related to production and represents a
worthy area for further energy saving
investigation to enhance the energy efficiency.
If R-square is close to 0 the model doesn’t fits the
data and the consumptions could be affected by
energy uses not directly linked to the production
(e.g. winter heating, air conditioning, etc.), as shown
in the second graph of Figure 4.
2.2 Implementation
Each ESET step is composed of two main parts: a
data input section and an output section that shows
the outcomes. It has been designed according to a
user-friendly structure, which leads the user in a path
through the different data sections. It allows to run
the analysis also with incomplete information, but in
this case the outcomes could be partial and less
relevant respect to the real case.
ESET Tool is multilingual: presently it is
customized in 12 languages and could easily extend
his interface to new ones, when requested. Moreover
it faces localisation issues like differences in price of
energy, differences in values of conversion factors
for toe calculation (due to different national mix of
electricity generation), comparison against national
Eurostat references.
2.2.1 Rules for Best Practices Selection
A list of suggested best practices for the company is
selected by the ESET Tool through an evaluation
process, which includes two kinds of rules:
cross-rules, which take into account the value of
company energy indices and act on the whole
best practices list;
specific rules, that act on a single best practice
(or on a group of them) taking into account the
companies features related to market positioning,
consumers, technologies, productive phases and
plants features.
It is important to underline that, by default, all best
practices are considered valid and the ESET Tool
discards the ones considered not suitable for the
specific case (Table 2). In details, it discards the
following types of best practices:
the ones linked to those consumptions having a
low incidence within the company energy uses
(based on Pareto’s law, also known as the 80-20
rule) or that having a value lower than the
sectorial references;
the ones without a link to specific consumers,
processes or technologies implemented by the
company or not considered useful on the base of
the company features.
This system of rules is integrated within ESET Tool
and arises from many years of energy audits
performed by experts and from a specific knowledge
of textile sector.
2.2.2 Use of MS Excel (Why?)
The ESET Tool was implemented using MS Excel
VBA (Visual Basic for Application) language.
The choice of using MS Excel as platform for the
tool instead of a Web Application was taken after a
lot of discussions with SET partners more used to
deal with companies and, particularly, with compa-
Energy Saving and Efficiency Tool - A Sectorial Decision Support Model for Energy Consumption Reduction in Manufacturing SMEs
335

Table 2: Simplified scheme of the rules to discard best practices.
Cross rules Specific rules (1) Specific rules (2)
Electrical
consumption
Thermal
consumption
Electrical
index
Thermal
index
Process, phase or
technology linked
to the energy
measure
Answers to the
question (if any)
≤ 20% of
consumptions
Discard
electrical
measures
≤ 20% of
consumptions
Discard
thermal
measures
if absent then
Discard the
linked measure
(or group of them)
if present then
Evaluate the set
of answers linked
to the measure
(or group of them)
between
20-30% of
consumptions
Evaluate
electrical index
between
20-30% of
consumptions
Evaluate
thermal index
≤ sectorial
reference
Discard
electrical
measures
≤ sectorial
reference
Discard
thermal
measures
AND
AND
Other cases: No effects
nies involved in the projects.
The idea is that, if companies are requested to
leave on a server their internal data (like turnover,
consumption and production data) they would
become cautious and could decide to not use the tool
because they do not trust on the confidentiality of
this data. So, it would be easier to convince
companies in using a stand-alone tool. Moreover,
Excel is a software about which non-ICT people
(who should use the tool) is more confident.
3 PILOT APPLICATION
The pilot factories considered in the following
analysis have been selected among about 60
companies already involved in SET project and
EM2M campaign activities.
3.1 Pilots Selection
For a deeper analysis of the quality of the outcomes
provided by ESET Tool, we selected six SMEs
representative of different kinds of companies
involved in the usage of ESET, taking into account
type of production, size of the company (based on
turnover and number of the employees) and
incidence of energy costs on the turnover. In detail:
no. 3 yarn producers
no. 1 fabric producer
no. 1 fabric and finishing producer
no. 1 clothing producer.
The turnover of these companies ranges from
3.000.000 € to 25.000.000 € and the number of
employees ranges from 12 to 204, while the weight
of energy costs on the turnover ranges from 0,8%
(clothing) to 25,37% (yarn production).
These companies were trained by SET experts on
the ESET usage, filled the tool and received the
suggested best practices. In addition, energy
efficiency experts of ENEA visited the factories and
provided a further report with energy analysis and
proposed actions.
A comparison was done, for each of the six
companies, between the ESET outcomes and the
results of the visits performed by ENEA experts.
After, the experts were asked to evaluate the
adequacy of the best practices selected by the tool
for each visited factory.
3.2 Results
The accuracy and completeness of ESET results
were analysed applying the methods used to evaluate
the Information Retrieval (IR) systems (Baeza-
Yates, 2011).
The IR is widely used to achieve and find useful
information from large amount of data.
The notions of “Precision” and “Recall”
(Manning, 2009), which represent respectively a
measure of truthfulness and of completeness of
results, were used to measure the effectiveness of an
IR system.
We applied the notions of “Precision” and
“Recall” to the set of rules used to select and discard
best practices within ESET Tool, which can be
assimilated to an IR system.
In this context, the “Precision” is the fraction of
retrieved best practices that are relevant for the
SMARTGREENS 2016 - 5th International Conference on Smart Cities and Green ICT Systems
336
specific case:
(1)
The “Recall” is the fraction of relevant best practices
that are retrieved:
(2)
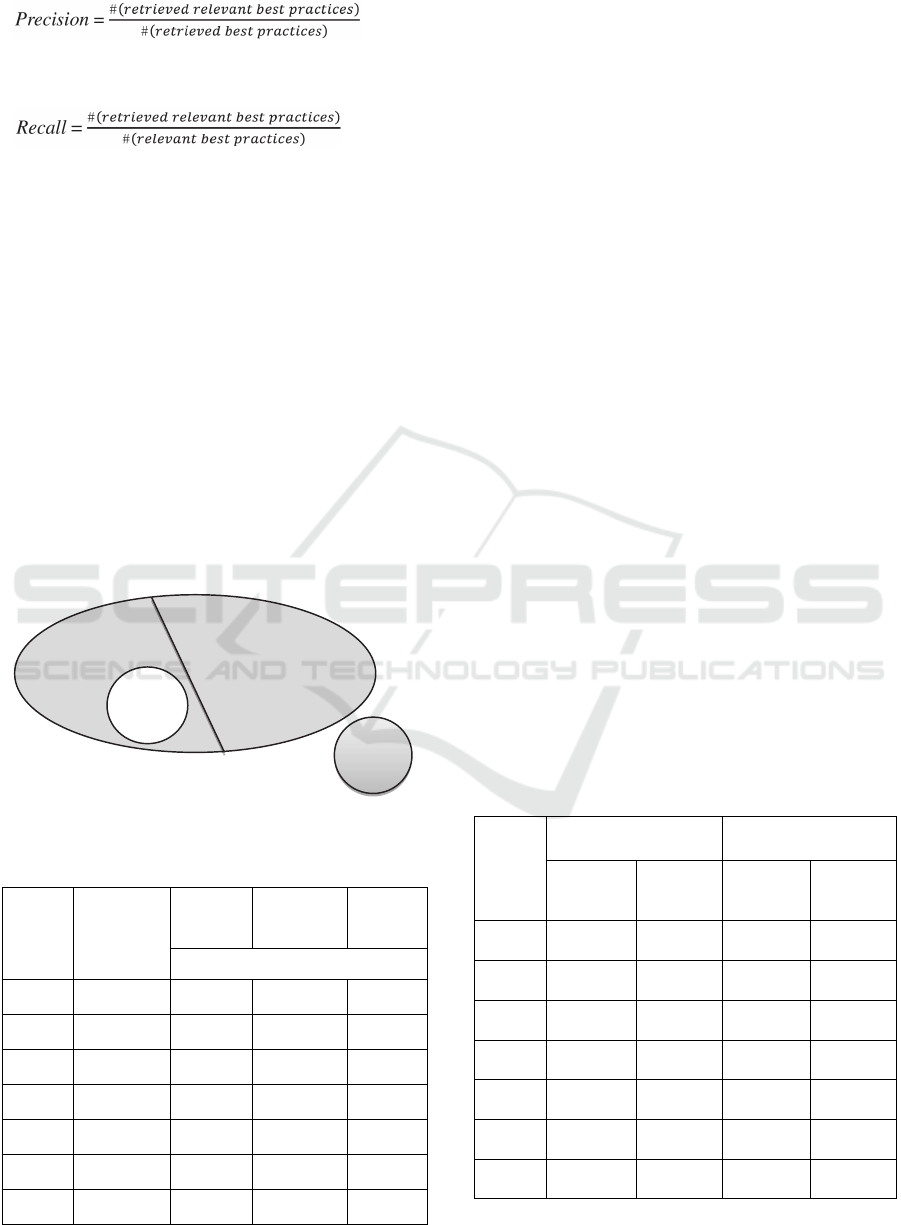
3.2.1 ESET Outcomes Analysis
The analysis process of the outcome of ESET Tool
involves ENEA experts which visited the factories
and follows the steps below:
the experts evaluate, for each company, the best
practices (BPs) retrieved by ESET Tool to
indicate the relevant feasible best practices and
the unfeasible ones;
they also identify a “first class” subset, i.e. easily
and quickly applicable, within the relevant
feasible best practices retrieved by ESET Tool;
then, the experts identify the “missing” best
practices that should have been recommended
but were not retrieved by the tool, looking the
whole set of ESET best practices (Figure 5).
BPsretrievedbyESET
Feasible
Unfeasible
First
Class
Missing
Figure 5: Best practices categories.
Table 3: Results from experts evaluations.
BPs
retrieved
by ESET
(A)
Feasible
(B)
First class
(C)
Missing
(D)
Expert evaluation
Case 1 32 23 7 2
Case 2 57 41 25 3
Case 3 40 28 10 2
Case 4 56 48 18 6
Case 5 58 38 5 2
Case 6 73 57 15 1
Total 316 235 80 16
The results of these steps, reported in Table 3,
represent the starting point to analyse the
“Precision” and “Recall” indices calculated both for
feasible best practices and the subset of “first class”
best practices (Table 4).
3.2.2 Results Evaluation
The analysis of “Precision” and “Recall” values for
feasible best practices allowed to assess the
effectiveness of ESET Tool, with the following
considerations:
ESET Tool is able to retrieve best practises with
a high level of precision (74,37%). This result is
coherent with the system of rules integrated into
the tool, that initially considers all the best
practices as valid and then discards only the ones
evaluated as not suitable for the specific case;
the tool is also able to properly select the
relevant best practices (93,63%), losing few
applicable measures (less than 7%).
Some other observations can be done calculating the
values of “Precision” and “Recall” for first class best
practices.
Few of these first class best practices are lost
(recall 83,33%), even if a lot of applicable but not
prior best practices are brought to the attention of the
company (precision 25,32%). But this apparently
low precision value is coherent with the philosophy
of the tool, which does not intend to substitute the
analysis of an expert or an energy audit, but aims to
make companies aware that energy can be saved and
consequently it discards only the really useless best
practices.
Table 4: Values of Precision and Recall indices.
Feasible BPs First class BPs
Precision
B/A
Recall
B/(B+D)
Precision
C/A
Recall
C/(C+D)
Case 1
71,88% 92,00% 21,88% 77,78%
Case 2
71,93% 93,18% 43,86% 89,29%
Case 3
70,00% 93,33% 25,00% 83,33%
Case 4
85,71% 88,89% 32,14% 75,00%
Case 5
65,52% 95,00% 8,62% 71,43%
Case 6
78,08% 98,28% 20,55% 93,75%
Total
74,37% 93,63% 25,32% 83,33%
Energy Saving and Efficiency Tool - A Sectorial Decision Support Model for Energy Consumption Reduction in Manufacturing SMEs
337

4 CONCLUSIONS
A model has been presented in this paper for helping
companies (and in particular SMEs) to become
aware of their energy efficiency and to manage
energy as a resource and not as a cost.
The main instrument for applying this
methodology is a software tool containing
intelligence distilled from the experience of
professional energy auditors. At the moment, this
tool is contextualized for textile and clothing sector,
but the model is general and the tool can be
extended, with little effort, to other industrial
sectors.
The model has been tested comparing its results
with the opinion of energy efficiency experts that
have really visited the pilot companies. The results
were very encouraging. In particular, through these
tests, it was possible to verify that the tool is able to
select the most part of relevant best practices, losing
few of applicable measures.
There are two possible paths for the evolution of
the tool after the end of SET project.
The first one is to make it a ‘largely used tool’
for assessment of company energy efficiency profile
and its evolution year-by-year or after the execution
of energy efficiency improvement actions (so
enabling an objective evaluation of the obtained
benefits). In order to be effective, the application
model has to be pushed in order to foster self-
analysis on large scale. At this aim, the tool is
promoted in EM2M campaign, which is achieving
interesting results (in 2014, more than 20 public
events took place in 8 countries involving around
500 professionals and in 2016 the involvement of
more than 300 companies of textile and clothing
sector is foreseen).
The second one is the improvement of the tool
for supporting the evaluation of the fundability of
the proposed best practices. This extension will
complete the kind of results offered to the
companies, covering the still lacking financial
aspects.
Finally the tool and the related methodology is
meant to be extended to further industrial sectors,
assuring further developments of specific sectorial
benchmark.
ACKNOWLEDGEMENTS
SET is an on-going project funded by the
“Intelligent Energy – Europe” programme (grant no.
IEE/13/557/SI2.675575). It is designed to enable
within 30 months at least 150 European Textile
SMEs to improve their energy efficiency, achieving
tangible and quantifiable benefits.
SESEC was a project co-funded within the
European Programme Intelligent Energy Europe by
EASME (grant no. IEE/11/827/SI2.615931).
ARTISAN was a Research & Development
project co-financed by the European Commission’s
7th Framework Programme (FP7-ICT-2011-7 Grant
agreement 287993).
REFERENCES
3E, 2013. Energy efficiency policy measures for
manufacturing SMEs in Europe: a comparative
analysis [Online]. Available from:
http://www.3e.eu/energy-efficiency-policy-measures-
for-manufacturing-smes-in-europe-a-comparative-
analysis/ [Accessed: 19th June 2015].
Asia Pacific Energy Research Centre, 2000. Energy
Efficiency Indicators – A Study of Energy Efficiency
Indicators for Industry in APEC Economies. Tokyo:
Asia Pacific Energy Research Centre
Baeza-Yates, R., Ribeiro-Neto, B., 2011. Modern
Information Retrieval: The concepts and technology
behind search. New York: ACM Press.
Capobianchi, S., Andreassi, L., Introna, V., Martini, F.,
Ubertini, S., 2011. Methodology Development for a
Comprehensive and Cost-Effective Energy
Management in Industrial Plants. In Kini Dr Giridhar
(ed.) Energy Management Systems. Rijeka: InTech.
CITEVE, 2014. SET - Production Processes and
Efficiency Measures. Internal Deliverable D2.3.
Dörr, M., Wahren, S., Bauernhansl, T., 2013.
Methodology for energy efficiency on process level. In
Procedia of Forty Sixth CIRP Conference on
Manufacturing Systems, Setubal, Portugal, ed.
Elsevier, 2013. 7 (2013). pp. 652 – 657.
Doukas, H., Nychtis, C., Psarras, J., 2009. Assessing
energy-saving measures in building through an
intelligent decision support model. In Building and
Environment 44 (2). pp. 290-298.
Doukas, H., Patlitzianas, K.D., Iatropoulos, K., Psarras, J.,
2006. Intelligent building energy management system
using rule sets. In Bulding and Environment 42 (10).
pp. 3562-3569.
Ekmanis, J., Zebergs, V., Zeltins, N., 2010. Adaption of
the general policy assessment methodology for
managing the energy saving process. In
ENERGETIKA 56 (1). pp. 1-7.
EMS-Textile, 2006. Energy Management Manual. EMS-
Textile Consortium.
European Commission Factories of the Future 2013. Multi
Annual Roadmap for the Contractual PPP.
EUROSTAT, 2013. Annual enterprise statistics for special
aggregates of activities (NACE Rev. 2) [Online]
Available from: http://appsso.eurostat.ec.europa.eu/
SMARTGREENS 2016 - 5th International Conference on Smart Cities and Green ICT Systems
338

nui/show.do?dataset=sbs_na_sca_r2&lang=en
[Accessed: 29 October 2015].
Hasanbeigi, A., 2010. Energy-Efficiency Improvement
Opportunities for the Textile Industry. Berkeley:
Ernest Orlando Lawrence Berkeley National
Laboratory.
IPPC, 2003. Reference Document on Best Available
Techniques for the Textiles Industry. European
Commission.
ISO, 2011. ISO 50001:2011 Energy management systems
– Requirements with guidance for use.
Manning, C.D., Raghavan, P., Schütze, H., 2009.
Evaluation in information retrieval. Cambrigde:
Cambridge University Press.
Phylipsen, G.J.M., Blok, K., Worrell, E., 1998.
benchmarking the Energy Efficiency of the Dutch
Energy-Intensive Industry; A preliminary assessment
of the effects on energy consumption and CO2
emissions. Utrecht: Dept. of Science, Technology and
Society, Utrecht University.
Paganelli, M., Vatrano, F., 1997. Uso razionale
dell'energia nel settore tessile. ENEA.
The European Parliament and the Council of the European
Union, 2010. Directive 2010/75/Eu of the European
Parliament and of the Council on industrial emissions
(integrated pollution prevention and control).
Available from: http://eur-lex.europa.eu/legal -
content/EN/TXT/?uri=celex:32010L0075 [Accessed:
6th October 2015].
Worrell, E., Bernstein L., Roy, J., Price, L., Harnisch, J.,
2009. Industrial energy efficiency and climate change
mitigation. In Energy Efficiency 2 (November). pp.
109-123.
Energy Saving and Efficiency Tool - A Sectorial Decision Support Model for Energy Consumption Reduction in Manufacturing SMEs
339
