
Guess the Number - Applying a Simple Brain-Computer Interface to
School-age Children
Luk´aˇs Vaˇreka
1
, Tom´aˇs Prokop
1
, Jan
ˇ
Stˇebet´ak
2
and Roman Mouˇcek
1
1
NTIS - New Technologies for the Information Society, University of West Bohemia, Univerzitni 8, Pilsen, Czech Republic
2
Department of Computer Science and Engineering, University of West Bohemia, Univerzitni 8, Pilsen, Czech Republic
Keywords:
Electroencephalography, Event-related Potentials, Brain-Computer Interface, P300, Discrete Wavelet Trans-
form, Multi-layer Perceptron.
Abstract:
Although research into brain-computer interfaces is more common in recent years, studies concerning large
groups of specific subjects are still lacking. This paper describes a simple brain-computer interface (BCI)
experiment that was performed on a group of over 200 school-age children using the technique and methods
of event related potentials. In the first phase, experimental data were recorded in various elementary and
secondary schools, mainly in the Pilsen region of the Czech Republic. The task was to guess the number
between 1 and 9 that the measured subject thinks on. Concurrently, a human expert made a decision about
the target number based on averaged P300 waveforms observed on-line. In the second phase, an application
for automatic classification was developed for off-line data. A small subset of the data was used for training;
the rest of the data was used to evaluate the accuracy of classification. Two feature extraction methods were
compared; subsampling and discrete wavelet transform for feature extraction. Multi-layer perceptron was used
for classification. The human expert achieved the accuracy of 67.6%, while some of the automatic algorithms
were able to significantly outperform the expert; the maximum classification accuracy reached 77.2%.
1 INTRODUCTION
Recent advances in cognitive neuroscience and brain
imaging techniqueshavestarted to provide us with the
ability to interface directly with the human brain. In
brain-computerinterfaces (BCIs), instead of using the
brain’s normal output pathways, users explicitly try to
manipulate their brain activity to produce signals that
can be used to control computers. Any BCI has input
(e.g. electrophysiological activity from the user), out-
put (i.e. device commands), components that trans-
late input into output, and a protocol that determines
the operations. The electroencephalographic signal
is widely used in BCI systems as input because of
low cost of the device and simple use. This signal
is acquired by electrodes on the scalp and processed
to extract specific signal features (e.g. amplitudes of
evoked potentials) that reflect the decision of the user.
These features are translated into commands that op-
erate a device (e.g. a simple word processing pro-
gram). The user must follow the protocol of the BCI
system and maintain attention of focus. Then the BCI
system must select and extract features that the user
can control and must translate those features into de-
vice commands correctly and efficiently. (McFarland
and Wolpaw, 2011)
The technique of event-related potentials (ERPs)
uses the electroencephalographic signal enriched by
markers denoting the time points of brain stimulation
precisely synchronized to the brain activity. The P300
(depicted in Fig. 1) waveform is a cognitive event-
related potential with a positive low amplitude. It is
usually obtained with the oddball paradigm, which is
based on random occurrence of rare (target) stimuli
in sequence of frequent (non-target) stimuli. Because
of the fact that the P300 is a cognitive reaction to out-
side events, manybrain-computerinterfaces are based
on the P300 detection. However, the detection of the
P300 is challenging because the P300 component is
usually hidden in the underlying EEG signal. (Luck,
2005)
Many papers report different approaches for the
P300 BCIs, however, it is difficult to compare them
directly because they use data recorded from differ-
ent laboratories and different subjects. Furthermore,
various paradigms that differ in many parameters, in-
cluding inter-stimulus intervals and number of trials
averaged, are used. However, there is a benchmark
Va
ˇ
reka, L., Prokop, T., Št
ˇ
ebeták, J. and Mou
ˇ
cek, R.
Guess the Number - Applying a Simple Brain-Computer Interface to School-age Children.
DOI: 10.5220/0005801402630270
In Proceedings of the 9th International Joint Conference on Biomedical Engineering Systems and Technologies (BIOSTEC 2016) - Volume 4: BIOSIGNALS, pages 263-270
ISBN: 978-989-758-170-0
Copyright
c
2016 by SCITEPRESS – Science and Technology Publications, Lda. All rights reserved
263
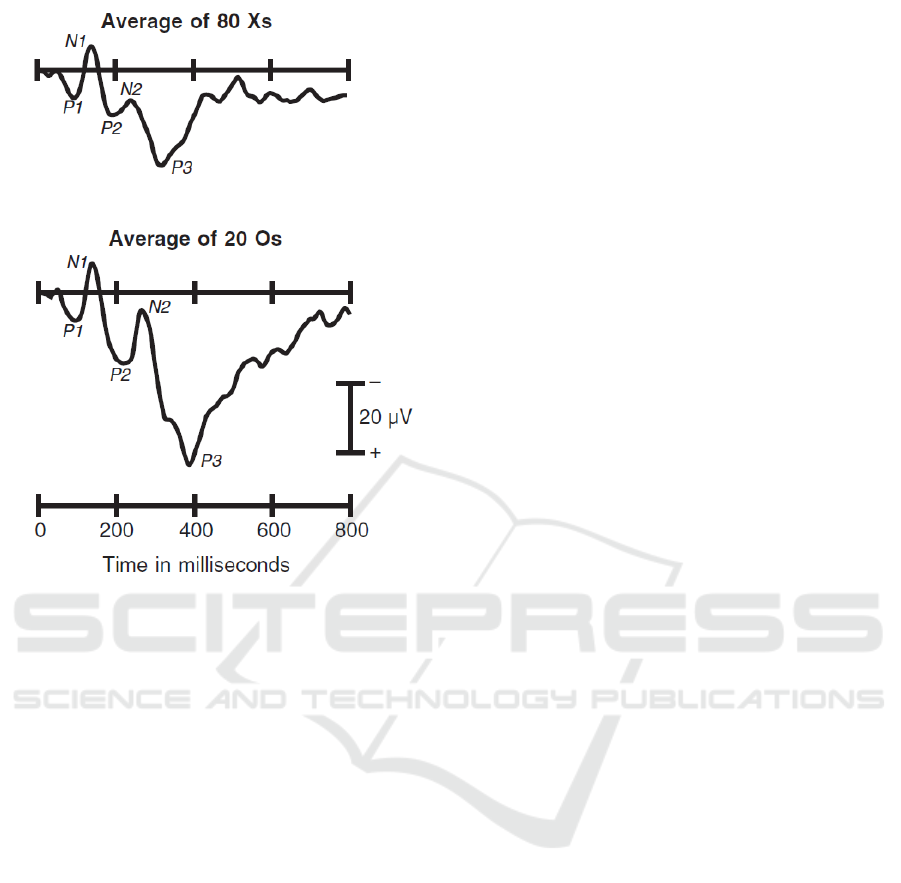
Figure 1: Comparison of averaged EEG responses to non-
target stimuli (Xs) and target stimuli (Os). There is a clear
P300 component following the Os stimuli. Negative is plot-
ted upward (Luck, 2005).
P300 speller dataset from the BCI Competition 2003
(Blankertz et al., 2004) and some papers report results
achieved on this dataset. Several approaches were
able to reach 100% accuracy using only 4-8 averaged
trials on the BCI Competition 2003 data (Cashero,
2012). To the best knowledge of the authors of this
paper, the BCI Competition 2003 datasets as well as
other datasets used in P300 BCI publications are rel-
atively small or not publicly available.
The aim of this paper is to propose a simple BCI
and to compare different P300 detection techniques
by testing them on a large dataset containing more
than 200 records from school-age children. The data
and metadata used in this article are freely avail-
able on the EEG/ERP portal in the package named
“PROJECT DAYS P3 NUMBERS” (Moucek and
Jezek, 2009). A “guess the number” experiment was
used for this purpose. The goal of the experiment is to
figure out the number chosen by a subject. Typically,
different classification methods in BCI are evaluated
and comparedin terms of classification accuracy. Fur-
thermore, because the numbers were also guessed by
an expert in the field, a unique opportunity arises to
compare both accuracies.
2 EXPERIMENTAL DESIGN
The guess the number experiment was originally de-
veloped to demonstrate the benefits of using BCI to
public. The experiment is based on visual stimula-
tion. The subject is asked to secretly choose a num-
ber between 1 and 9 and to concentrate on this number
(i.e. the target stimulus). The subject told the experi-
menters the number they were thinking of at the end
of the experiment.
2.1 Environment
The experiments were conducted in elementary and
secondary schools mainly in the Pilsen region, the
Czech Republic between autumn 2014 and spring
2015. The measurements were taken at the time of
regular school hours, typically in the morning. Each
experiment was performed in a classroom that was
dedicated for health entertaining and educating pro-
gramme, also including Neurosky brain games, ECG
monitoring, modeling of body muscles, etc. Unfortu-
nately, the environment was usually quite noisy since
many children were in the room at the same time.
2.2 Stimulation Protocol
The participants were stimulated with numbers flash-
ing on the monitor in random order. The interstimu-
lus interval was 1500 ms. The flashing number were
white on the black background as shown in Figure
2. The subjects were sitting approximately 1 m from
the monitor for as long as needed (approximately 10
minutes on average, stopped when the experimenters
were convinced that they are able to guess the num-
ber thought). They were asked to sit comfortably, pay
attention to the stimulation, not to move, and to limit
their eye blinking. To increase alertness, the subjects
were instructed to silently count the occurrences of
target stimuli.
2.3 Hardware and Software
The mobile EEG laboratory was used. It was nec-
essary to have equipment that was easy to unpack, in-
stall, and pack. Consequently, the following hardware
devices were used: a standard small or medium 10/20
EEG cap, the BrainVision standard V-Amp ampli-
fier, standard electrodes, electro gel, conductivepaste,
and degreasing gel. To speed up the guessing task,
only three electrodes were active: Fz, Cz, and Pz.
These electrodes are significant for the P300 detec-
tion (Luck, 2005).
BIOSIGNALS 2016 - 9th International Conference on Bio-inspired Systems and Signal Processing
264

Figure 2: Numbers 1 - 9 were randomly shown on the mon-
itor.
2.4 Measured Subjects
Most subjects were school-age children (average age
13.2): 135 males and 104 females. The total number
of subjects of different age with their gender distribu-
tion is shown in Figure 3.
3 GUESS THE NUMBER -
APPLICATION FOR ON-LINE
AND OFF-LINE BCI
CLASSIFICATION
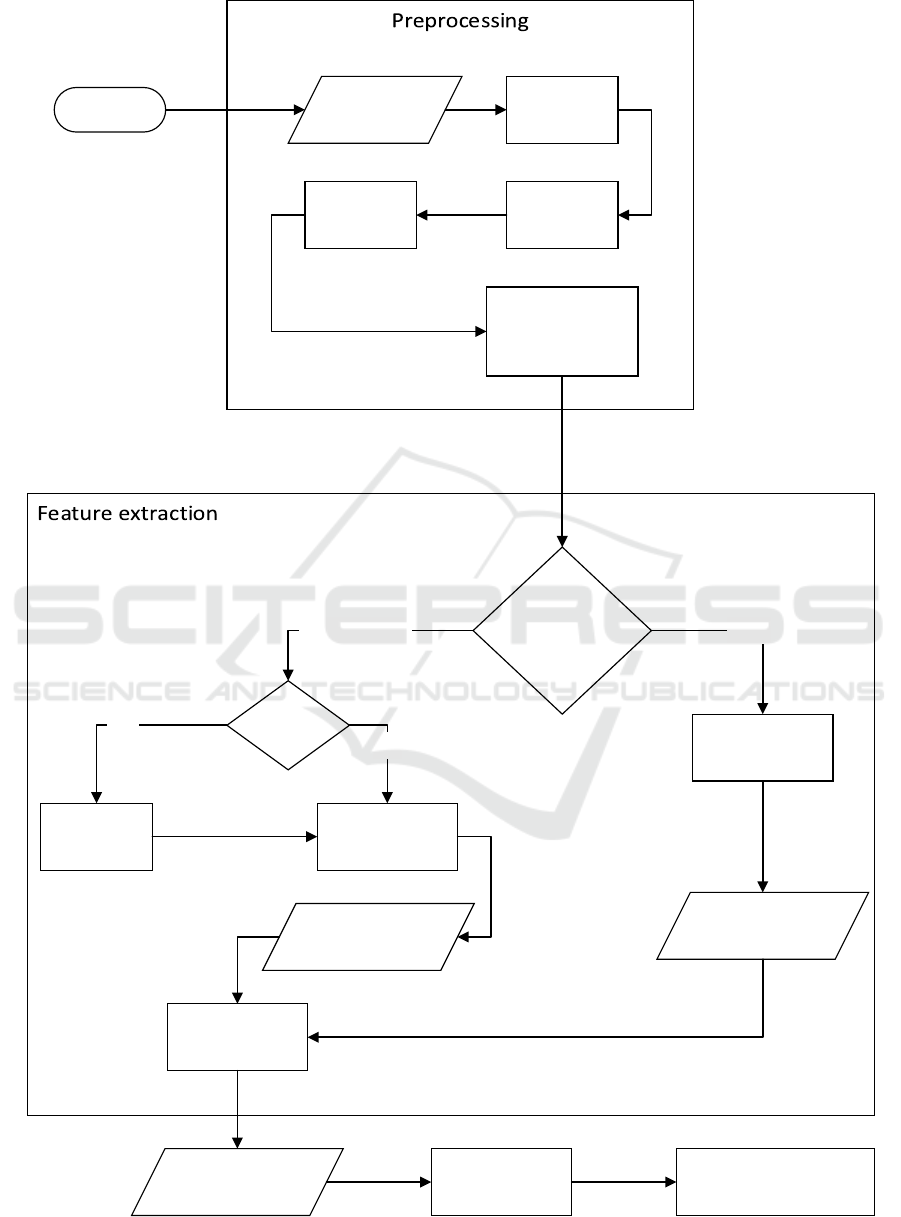
An application for analysis of the experiments previ-
ously described was developed. It is a desktop ap-
plication written in Java language using Swing for its
graphical user interface (a screenshot is shown in Fig-
ure 4). The purposeof this applicationis to enable off-
line (experimental data are collected and analyzed af-
ter an experiment is performed) and on-line (data are
streamed into the application during an experiment)
classification. Off-line classification allows users to
test preprocessing, feature extraction, and classifica-
tion algorithms. Subsequently, suitable combinations
can be selected for on-line classification.
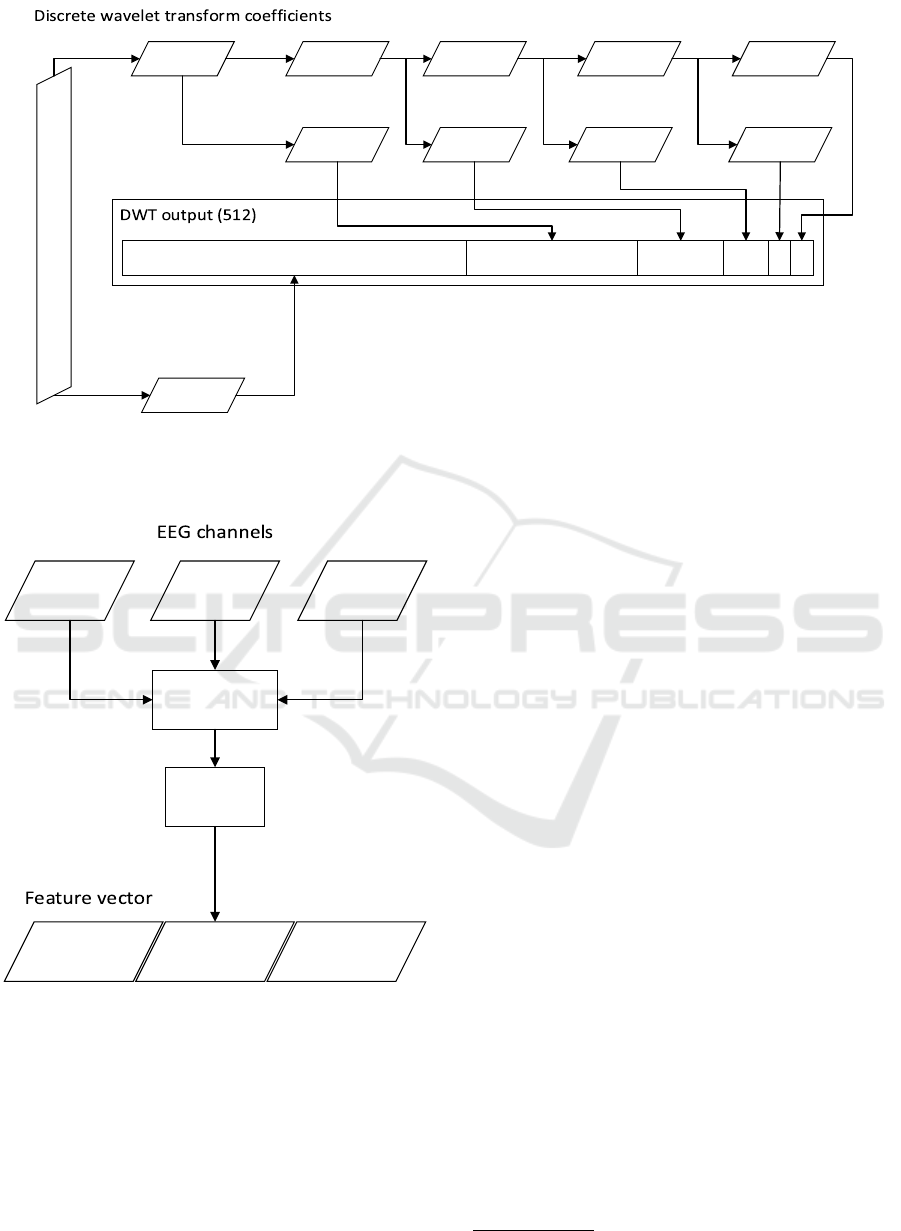
4 PATTERN RECOGNITION
Traditional pattern recognition was used: feature ex-
traction was followed by classification. Two com-
monly used methods for feature extraction, band-
pass filtering with subsampling of the feature vector
and discrete wavelet transform, were tested. In both
cases, data from three EEG channels were included.
A multi-layer perceptron was used for classification.
The workflow of pattern recognition is shown in Fig-
ure 5.
4.1 Preprocessing and Feature
Extraction
The raw input data were measured with the sampling
frequencyof 1 kHz. However, continuous EEG (with-
out synchronization marks) is not suitable for ERP
detection. Therefore, the data were split into epochs.
Each epoch started 100 ms before the stimulus and
ended 750 ms after the stimulus. The pre-stimulus
interval was used only to correct the baseline (by sub-
tracting the mean in the pre-stimulus interval from the
whole epoch). Subsequently, the reduction of dimen-
sionality was needed.
The input for further feature extraction methods
involves only a part of each epoch because the P300
component can occur only in a specific interval after a
stimulus. The number of samples in each epoch (see
Table 1) was skipped (refered to as Skip samples).
The next 512 samples (suitable for DWT and related
to the area of occurence of the P300 component) were
selected for feature extraction. Subsequently, sub-
sampling or discrete wavelet transform (DWT) was
used to reduce input data dimension and extract fea-
tures. The subsampling method reduces data dimen-
sion by a given subsampling factor; this was set to
32. Before skipping out samples, in half of the clas-
sification experiments, high (16 Hz and higher) and
low (0.4 Hz and lower) frequencies were filtered from
baseline corrected epochs using Chebyshev 1 IIR fil-
ter (Chebyshev filters minimize the error between the
idealized and the actual filter characteristic). Sub-
sampled epochs were stored into 1-dimensional fea-
ture vector f. The second method used for feature
extraction was DWT since the method was sucess-
fully used for P300 processing (Quiroga and Garcia,
2003). The basic idea of wavelet transform is to de-
compose the input signal into a set of basis functions
called wavelets (Letelier and Weber, 2000). This is
done by scaling and dilatation of a prototype wavelet
called the mother wavelet by the following equation:
ψ
a,b
(t) =
1
√
a
ψ(
t−b
a
)
where ψ is the analyzing wavelet, a is the scaling
factor, and b is the time shift. In DWT the dilated and
translated version of the wavelet function performs a
high-pass and low-pass filtering respectively. Hence
the convolution of the original signal with the high-
pass filter produces the Detail coefficients. Similarly,
approximation coefficients are computed by a con-
volution of the signal with a low-pass filter.(Markazi
et al., 2006)
Daubechies 8 mother wavelet was used to ex-
Guess the Number - Applying a Simple Brain-Computer Interface to School-age Children
265
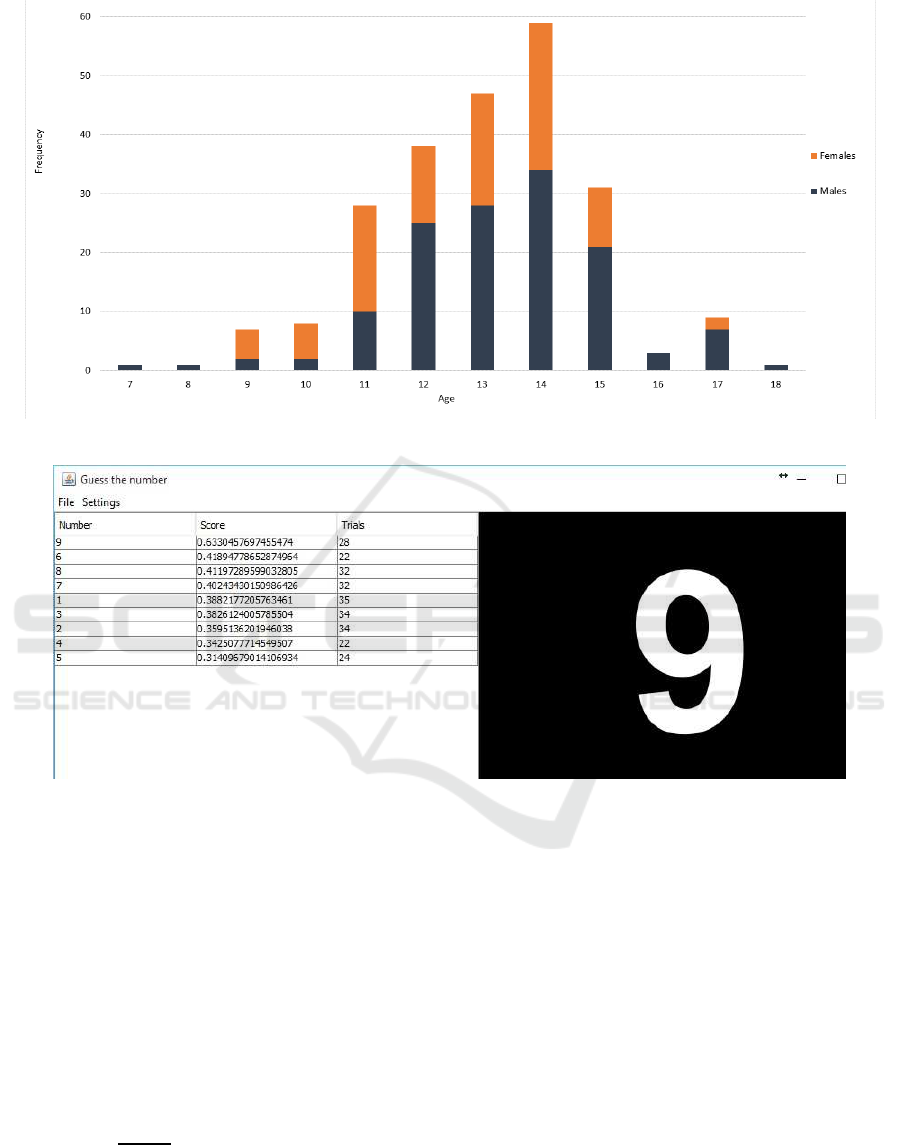
Figure 3: The total number of subjects of different age with their gender distribution.
Figure 4: Front end of the Guess the number application after successful classification. The left column represents the
stimulus, the stimulus average score is in the center column and the last column represents the number of epochs for each
stimulus. Rows are descendingly ordered by the stimulus score. The higher the score the more likely the stimulus number is
the number thought. The stimulus with the highest score is displayed in the right panel.
tract features from the input signal. The Daubechies
wavelets have been recently used for EEG signal pro-
cessing (Rafiee et al., 2011). After DWT is per-
formed, 16 approximation coefficients of level 5 for
each channel is stored in 1-dimensional array f and
used for classification. Figure 6 shows how DWT co-
efficients are obtained from input data.
Each DWT coefficient or output sample of the
subsampling method f
i
is then normalized by the fol-
lowing formula:
f
i
= f
i
∗
s
m−1
∑
i=0
f
2
i
where m is the size of the feature vector. Figure 7
shows the structure of the feature vector.
4.2 Classification
A multi-layer perceptron (MLP) was used for classi-
fication. The number of input neurons corresponded
to the dimension of the feature vector (it means 48).
The number of neurons in the middle layer was em-
pirically optimized to eight. One output neuron was
taughted to classify input patterns into two classes (0
- non-target, 1 - target).
4.2.1 Training
The first idea was to use the data from three-stimulus
pattern that is another odd-ball paradigm (Vareka
et al., 2014). Only the epochs containing a small per-
centage of artifacts and significant P300 components
BIOSIGNALS 2016 - 9th International Conference on Bio-inspired Systems and Signal Processing
266
Start
Channel
separation
Epoch
extraction
Baseline
correction
Selection of
epoch
subinterval
Bandpass
filtering
Feature
extraction
method
selection
Subsampling
DTW
computation
DWT
Vector
normalization
Feature
Vector
Classification
Raw EEG
data
Subsampled
data
DWT
coefficients
Score computation
and averaging
YES Filter data
NO
Subsampling
Figure 5: Diagram of EEG signal processing, feature extraction and classification.
Guess the Number - Applying a Simple Brain-Computer Interface to School-age Children
267
cA5
(16)
cD5
(16)
cD4
(32)
cD3 (64)cD2 (128)cD1 (256)
Epoch (512 samples)
cA1
cD1
cD2
cA5cA2
cD4
cA4cA3
cD3 cD5
Figure 6: Discrete wavelet transform coefficients. Input EEG signal has 512 samples. The number of coefficients obtained by
DWT is in brackets. 5-level DWT was performed. cA1 - cA5 represent approximation coefficients of different levels, cD1-
cD5 represent detail coefficients. Bold marked (cA5) coefficients form the feature vector.
Pz Cz Fz
Pz
features
Cz
features
Fz
features
Feature
extraction
Preprocessing
Figure 7: Feature vector.
were added to the training set. Surprisingly, the ac-
curacy on the testing set was below 50% with these
training data, the reasons requirefurther investigation.
It seems, however, that differences in the latencies be-
tween three-stimulus datasets and datasets described
in this paper may explain this to some extent.
Instead, the training set containing 13 datasets was
selected from the guess the number data (255 target
epochs and 255 non-target epochs were used in total)
according to the following procedure. First, the data
were split into several groups using visual inspec-
tion: high impedanceat scalp electrodes (8 datasets
1
),
severely distorted by high frequency (12 datasets),
moderately distorted by high frequency (30 datasets),
clean (107 datasets), damaged by biological artifacts
(82 datasets), and missing metadata (5 datasets - not
included in the statistics). From the group contain-
ing clean data, 13 datasets (more precisely all target
epochs and the same number of randomly selected
non-target epochs from 13 datasets) formed the train-
ing set.
Before the training phase, the weights of the neu-
ral network were randomized. The feature vectors
were shuffled to mix target and non-target patterns.
For training, backpropagation was used. 20% of the
training features (derived from epochs) were used as
a validation set. The training was stopped when the
accuracy peaked on the validation set.
4.2.2 Testing
The testing set was formed by excluding the datasets
with high impedance, severely distorted datasets, and
datasets with missing metadata. Then the testing set
contains 206 datasets in total. The testing set is used
for testing the multi-layer perceptron (MLP) when
the training phase is finished. The MLP receives
an epoch and its expected classification class (target,
non-target). The MLP calculates a score in range be-
tween 0 and 1. The higher score the more likely the
1
dataset means all the data from one measured subject
BIOSIGNALS 2016 - 9th International Conference on Bio-inspired Systems and Signal Processing
268

epoch belongs to the target number. Scores to each
number are summed. At the end of the classification
of each number, all scores are averaged. The number
with the highest averaged score is the winner.
5 RESULTS
Table 1 shows average and maximum classification
accuracy of Subsampling and DWT feature extraction
methods with different settings of preprocessing. The
classification accuracy of the MLP classifier highly
depends on the initial settings of weights and it may
differ in each trial (the whole testing set is used). Fur-
thermore, since 20% randomly selected epochs were
excluded from the training set for validation, the train-
ing set was different for each training phase. We aver-
aged at least 50 trials (classifications) for each feature
extraction settings to get average classification accu-
racy.
5.1 Comparison with Human Expert
Classification
All the data from the testing sample were evaluated
by a human expert with neuroinformatics background
- 67.61%accuracywas achieved. The expert observed
epochs as they were gradually averaged for each stim-
ulus (guessed number) in the BrainVision Recorder
(BrainProducts, 2012) software and searched for the
most likely target. Each experiment ended either
when the expert was convinced about the number
guessed or was unable to make the decision. As it can
be seen in Table 1, some of the developed classifica-
tion algorithms were able to outperform the expert.
6 DISCUSSION
The parameter settings affected the resulting accu-
racy. For example, the selected time intervals need to
be in the time domain in which the P300 component
is expected. The latency of the P300 varied greatly
- it was typically around 450 ms but for some sub-
jects, it was 700 ms. Consequently, increasing the
skipped samples was associated with higher accuracy.
As Table 1 shows, the best results were achieved for
skipped samples between 150 and 200.
Filtering does not seem to lead to higher classifi-
cation accuracy. This could be caused by a fact that
filtering distorts the signal and could damage some
significant features. Neural network seems to be able
to ignore irrelevant frequencies by itself.
In all cases, the empirically set dimensionality of
feature vectors was 48 (16 features for each channel).
Both higher and lower dimensionality did notimprove
classification accuracy.
7 CONCLUSION
We proposed a BCI system based on visual stimula-
tion; the system was adjusted to school-aged children.
The aim of this BCI is to detect the P300 component
in the EEG signal and decide which number the sub-
ject thinks on. The overall dataset consists of 239
measurements from different subjects with average
age 13.2. The training set is formed from 13 datasets
and testing set contains 206 datasets. The rest of the
collected data were excluded because the signal was
highly damaged. For feature extraction we used sub-
sampling and DWT feature extraction methods that
we tested with different settings. The selection of the
optimal epoch subinterval has a high effect on clas-
sification accuracy (increased by up to 13.8%) while
the band-pass filtering has not. Using the multi-layer
perceptron classifier and feature extraction method,
68.9% average and 77.2%maximumclassification ac-
curacy was achieved. The classification accuracy of
human expert is 67.6%. It means that in compari-
son with human we achieved approximately1.3% bet-
ter average and 9.6% maximum classification accu-
racy. Our next step will be implementation, testing
and comparison of more classifiers (e.g. SVM, LDA,
deep learning) and feature extraction methods (more
mother wavelets, HHT, matching pursuit). We want
to determine which combination of a feature extrac-
tion method and classifier is the best solution for BCI
systems based on P300 component detection having
school-aged children as measured subjects. We will
also test artifact rejection methods which can further
improve classification accuracy.
ACKNOWLEDGEMENTS
The work was supported by the UWB grant SGS-
2013-039 Methods and Applications of Bio- and
Medical Informatics and by the European Regional
Development Fund (ERDF), Project ”NTIS - New
Technologies for Information Society”, European
Centre of Excellence, CZ.1.05/1.1.00/02.0090.
Guess the Number - Applying a Simple Brain-Computer Interface to School-age Children
269

Table 1: Classification accuracy obtained for different parameter settings.
Feature Extraction method settings Classification
Name Skip samples
Band-pass
filter [Hz]
Average
classification
accuracy ±
standard
deviation [%]
Maximum
classification
accuracy ±
standard
deviation [%]
Human
- - - 67.61 ± 3.26
Subsampling (down sampling
factor 32)
0 0.4 - 16 56.69 ± 3.45 69.41 ± 3.21
Subsampling (down sampling
factor 32)
0 - 55.14 ± 3.46 66.5 ± 3.29
Subsampling (down sampling
factor 32)
100 0.4 - 16 63.4 ± 3.36 72.33 ± 3.12
Subsampling (down sampling
factor 32)
100 - 58.82 ± 3.43 74.27 ± 3.05
Subsampling (down sampling
factor 32)
150 0.4 - 16 67.66 ± 3.26 74.75 ± 3.03
Subsampling (down sampling
factor 32)
150 - 67.74 ± 3.26 75.72 ± 2.99
Subsampling (down sampling
factor 32)
175 0.4 - 16 64.59 ± 3.33 73.78 ± 3.06
Subsampling (down sampling
factor 32)
175 - 68.62 ± 3.23 73.78 ±3.06
Subsampling (down sampling
factor 32)
200 0.4 - 16 68.24 ± 3.24 75.72 ± 2.99
Subsampling (down sampling
factor 32)
200 - 68.89 ± 3.23 77.18 ± 2.92
DWT (Daubechies 8)
0 - 56.87 ± 3.45 70.39 ± 3.18
DWT (Daubechies 8) 100 - 63.46 ± 3.36 74.75 ± 3.03
DWT (Daubechies 8)
175 - 68.94 ± 3.22 76.7 ± 2.95
DWT (Daubechies 8) 200 - 66.82 ± 3.28 74.76 ± 3.03
REFERENCES
Blankertz, B., Muller, K., Curio, G., Vaughan, T., Schalk,
G., Wolpaw, J., Schlogl, A., Neuper, C., Pfurtscheller,
G., Hinterberger, T., Schroder, M., and Birbaumer, N.
(2004). The bci competition 2003: progress and per-
spectives in detection and discrimination of eeg single
trials. Biomedical Engineering, IEEE Transactions
on, 51(6):1044–1051.
BrainProducts (2012). Brain vision recorder.
www.brainproducts.com/productdetails.php?id=21.
Cashero, Z. (2012). Comparison of Eeg Preprocessing
Methods to Improve the Performance of the P300
Speller. Proquest, Umi Dissertation Publishing.
Letelier, J. C. and Weber, P. P. (2000). Spike sorting based
on discrete wavelet transform coefficients. Journal of
Neuroscience Methods, 101(2):93 – 106.
Luck, S. (2005). An introduction to the event-related poten-
tial technique. Cognitive neuroscience. MIT Press.
Markazi, S., Qazi, S., Stergioulas, L., Ramchurn, A., and
Bunce, D. (2006). Wavelet filtering of the p300 com-
ponent in event-related potentials. In Engineering in
Medicine and Biology Society, 2006. EMBS ’06. 28th
Annual International Conference of the IEEE, pages
1719–1722.
McFarland, D. J. and Wolpaw, J. R. (2011). Brain-computer
interfaces for communication and control. Commun.
ACM, 54(5):60–66.
Moucek, R. and Jezek, P. (2009). Eeg/erp portal.
http://eegdatabase.kiv.zcu.cz/home.html.
Quiroga, R. and Garcia, H. (2003). Single-trial event-
related potentials with wavelet denoising. Clinical
Neurophysiology, 114(2):376–390.
Rafiee, J., Rafiee, M., Prause, N., and Schoen, M. (2011).
Wavelet basis functions in biomedical signal process-
ing. Expert Systems with Applications, 38(5):6190 –
6201.
Vareka, L., Bruha, P., and Moucek, R. (2014). Event-related
potential datasets based on a three-stimulus paradigm.
GigaScience, 3(1):1–5.
BIOSIGNALS 2016 - 9th International Conference on Bio-inspired Systems and Signal Processing
270
