
Using a Predator-Prey Model to Explain Variations of Cloud
Spot Price
Zheng Li
1
, William Tärneberg
1
, Maria Kihl
1
and Anders Robertsson
2
1
Department of Electrical and Information Technology, Faculty of Engineering, Lund University, Lund, Sweden
2
Department of Automatic Control, Lund University, Lund, Sweden
Keywords: Cloud Computing, Cloud Spot Pricing, Cloud Spot Market, Predator-Prey Model.
Abstract: The spot pricing scheme has been considered to be resource-efficient for providers and cost-effective for
consumers in the Cloud market. Nevertheless, unlike the static and straightforward strategies of trading on-
demand and reserved Cloud services, the market-driven mechanism for trading spot service would be
complicated for both implementation and understanding. The largely invisible market activities and their
complex interactions could especially make Cloud consumers hesitate to enter the spot market. To reduce the
complexity in understanding the Cloud spot market, we decided to reveal the backend information behind
spot price variations. Inspired by the methodology of reverse engineering, we developed a Predator-Prey
model that can simulate the interactions between demand and resource based on the visible spot price traces.
The simulation results have shown some basic regular patterns of market activities with respect to Amazon’s
spot instance type m3.large. Although the findings of this study need further validation by using practical
data, our work essentially suggests a promising approach (i.e. using a Predator-Prey model) to investigate
spot market activities.
1 INTRODUCTION
The de facto Cloud market employs three types of
pricing schemes for trading on-demand service,
reserved service, and spot service respectively. With
the on-demand service pricing scheme, Cloud
consumers pay a fixed cost per service unit on an
hourly basis for necessary on-demand resources, and
an analogy of this pricing scheme is paying per view
from a video on demand (VOD) service. With the
reserved service pricing scheme, Cloud consumers
pay an upfront fixed fee to ensure discounted hourly
pricing for a long-term commitment of service
availability, and an analogy of this pricing scheme is
signing a two-year subscription of mobile service to
receive cheaper data plans with a free phone. These
two types of static pricing schemes both imply a
straightforward demand-resource relationship when
consuming Cloud services. In contrast, the spot
pricing scheme depends on potentially complicated
interactions between consumer demand and Cloud
resource. As specified by Amazon (Amazon, 2015a),
the price of Cloud spot service could frequently vary
driven by a market mechanism. An analogy of this
pricing scheme is the dynamic pricing in the
electricity distribution industry. Behind the price
variations, technically, a Cloud spot service
continuously evaluates its available resources and
monitors the coming demands, and then dynamically
sets spot prices to target predefined goals like revenue
maximization or utility efficiency.
Given the generally low utilization of Cloud
resources (Delimitrou and Kozyrakis, 2014),
although the two static pricing schemes are dominant
trading strategies in the current Cloud market (Al-
Roomi et al., 2013; Xu and Li, 2013), spot pricing has
been considered to be a significant supplement for
building a full-fledged market economy for the Cloud
ecosystem (Abhishek et al., 2012). However, it seems
that both providers and consumers are still hesitating
to enter the Cloud spot market. In fact, considering
the hard-to-predict and dynamic interactions between
demand and resource, the market-driven mechanism
for pricing spot service would require more effort and
managerial overheads for Cloud providers to
implement, and also result in psychological
difficulties for Cloud consumers to understand and
employ (Xu and Li, 2013). As can be seen, the
overwhelming majority of the existing Cloud
providers have not employed the spot pricing scheme
Li, Z., Tärneberg, W., Kihl, M. and Robertsson, A.
Using a Predator-Prey Model to Explain Variations of Cloud Spot Price.
In Proceedings of the 6th International Conference on Cloud Computing and Services Science (CLOSER 2016) - Volume 2, pages 51-58
ISBN: 978-989-758-182-3
Copyright
c
2016 by SCITEPRESS – Science and Technology Publications, Lda. All rights reserved
51

yet (Zaman and Grosu, 2011), and the only spot
service provider Amazon is still using contests to
encourage more spot applications (Amazon, 2015a).
Therefore, being aware of the dynamic demands
and resources would be significantly helpful and
useful for both Cloud providers and consumers to join
the spot market. Unfortunately, the backend details
behind changing spot prices are invisible for most of
the market participants, and little work has focused on
the interactions between demand and resource.
Following the methodology of reverse engineering,
we tried to reveal the invisible knowledge from the
tangible spot prices. By imaging the Cloud spot
demand and resource as two species, i.e. predator and
prey respectively, we developed a Predator-Prey
model to investigate the demand-resource
interactions. Based on Amazon’s historical spot
prices, the simulation shows that our Predator-Prey
model is conceptually functional, although the
revealed information needs further validation in
practice. This paper introduces our developed
Predator-Prey model and uses its simulation to try
explaining the variations of Cloud spot price.
The contribution of our work is mainly twofold.
Firstly, this work suggests a promising approach (i.e.
using a Predator-Prey model) to investigate spot
market activities. To our best knowledge, this is the
first study that tries to visualize the interactions
between demand and resource in the Cloud spot
market. Although the current version of this Predator-
Prey model might still suffer from simple
assumptions, the logic of the whole work can be
reused and refined by others. Secondly, by using this
Predator-Prey model, our simulation has identified
some basic regular patterns of market activities with
respect to Amazon’s spot instance type m3.large
1
. For
example, spot resources could be accumulated
relatively slowly, while being saturated quickly after
reaching particular amounts. Such a phenomenon of
sharp drops of spot resources might indicate “herd
behaviors” of spot demands. Although this simulation
finding could not be practically assured at this current
stage, it have provided us a hypothesis to be tested in
the future.
The remainder of this paper is organized as
follows. Section 2 summarizes relevant studies that
have modeled demand and resource of Cloud spot
services by roughly classifying them into two types.
Section 3 elaborates our development details of the
Predator-Prey model of Cloud spot demands and
resources. By using Amazon’s spot price trace,
Section 4 describes our simulation work that reveals
________________________________
1
http://aws.amazon.com/ec2/instance-types/
basic information behind the changing spot prices.
Conclusions and some future work are discussed in
Section 5.
2 RELATED WORK
Although the backend details behind spot prices are
usually uncertain and even unknown, the demand
information and resource information are
fundamentally crucial for investigating various
problems ranging from service fault tolerance (from
the consumer’s perspective) to revenue maximization
(from the provider’s perspective). Therefore,
researchers and practitioners have employed different
techniques/assumptions to model the spot service
demand and resource to facilitate their studies. The
existing study approaches can be roughly classified
into three categories, as specified below.
(1) The first type of studies focuses on Cloud
demand and resource separately.
Demand Model-relevant Studies
When it comes to modeling demands, a common
practice was to replay recorded workload traces (e.g.,
(Shi et al., 2014)) or to run particular applications
(e.g., (Chohan et al., 2010)). However, this type of
practices would fail in emulating highly variable and
dynamic workload profiles and demand scenarios (v.
Kistowski et al., 2014). To address this limit, a simple
case was to treat demand as an independent
uncertainty parameter that contains the possible
amounts of server-hours required by an application
(Chaisiri et al., 2011). In sophisticated cases, demand
was imagined as job arrivals. For example, Abhishek
et al. (Abhishek et al., 2012) assumed that jobs
arrived sequentially according to a stationary
stochastic process with independent inter-arrival
time, while Mazzucco and Dumas (Mazzucco and
Dumas, 2011) assumed that jobs entered the spot
service according to an independent Poisson process
with a particular rate λ. Nevertheless, it is notable that
these studies did not consider the influence of
dynamic demands on spot prices in their modeling
work.
Resource Model-relevant Studies
As for modeling resource, some authors simply
assumed that the Cloud infrastructure could provide
infinite/unbounded spot resource (Chaisiri et al.,
2011; Kantere et al., 2011). However, a spot service
would only offer limited spare resources in practice.
As such, a predefined number of homogeneous
CLOSER 2016 - 6th International Conference on Cloud Computing and Services Science
52

processors/cores or virtual machines have been
widely used to constrain the amount of spot resources
(Mazzucco and Dumas, 2011; Xu and Li, 2013). Even
without specification, the spot service models like k
parallel M/M/1 queues (Abhishek et al., 2012) have
also implied limited resources (k VM instances in this
case) in the Cloud spot market. Similarly, this type of
studies did not consider the influence of available
resources on spot prices in their modeling work.
(2) The second type of studies focuses on the
relationship between spot price and demand/resource.
Price-demand Model-relevant Studies
Kantere et al. (Kantere et al., 2011) modeled the
price-demand dependency as second order
differential equations with constant parameters, and
they claimed that the involved constant parameters
could be estimated by using price-demand data sets to
perform curve fitting. As an important economics
concept, the stair-shape demand curve has also been
used to represent the relationship between spot price
and quantitative demand. For example, Wang et al.
(Wang et al., 2013) employed a demand curve to
facilitate their time-average revenue maximization
study. The demand curve was supposed to be
maintained by sorting the requests according to their
bids in a descending order, as shown in Figure 1. An
interesting feature of this work is that the supply S is
defined as the accepted demand D at a particular time
slot, which partially emphasizes the relationship
between demand and resource of a spot service.
Figure 1: Sample demand curve (an adapted version from
(Wang et al., 2013)). The horizontal axis essentially scales
accepted demands in the original study.
Price-resource Model-relevant Studies
The connection between spot price and resource has
usually been reflected and/or modeled by using
service availability. For example, the lifetimes of spot
resources were modeled by building a Markov Chain
with edges being the probability of hourly-interval
price transitions (Chohan et al., 2010), which is
essentially an availability model; on the other hand,
the rate of events that terminate application runs due
to resource unavailability was considered to follow an
exponential distribution (Jangjaimon and Tzeng,
2015), which essentially indicates an unavailability
model.
(3) The third type of studies considers the
competitions among market participants from the
perspective of economics.
In these studies, Cloud spot pricing was treated as
various auctions and games to reach some
equilibrium. For example, the Prisoner Dilemma
game and the Generalized Nash Equilibrium (GNE)
game was employed to formulate the conflicts
between a provider and its consumers (Di Valerio et
al., 2013; Karunakaran and Sundarraj, 2013). The
games and auctions can intuitively explain the
influences of spot price and demand/resource on each
other, as shown in Figure 2. However, the equilibrium
tends to show a static relationship between demand
and resource instead of reflecting their dynamic
interactions along the time goes by.
Figure 2: Cloud spot pricing from the perspective of
economics (originally appears in (Li et al., 2015)).
Overall, despite the discussions in common sense,
to the best of our knowledge, little work has focused
on the interactions between demand and resource in
the Cloud spot market. Our work tries to reveal the
invisible demand-resource information through a
Predator-Prey model.
3 USING THE PREDATOR-PREY
MODEL TO EXPLAIN SPOT
PRICE VARIATION
Recall that spot price may fluctuate in real time driven
by the wax and wane of demands and resources. Given
the de facto Cloud spot market, however, we have little
knowledge about the changes in demands and
resources except for the most recent 90-day price trace
Spot Service Price
Spot
Resource
Demand
Spo
t
Resource
Supply
Quantity
Equilibrium
Demand
Price
P
max
P
S
supply S =
accepted demand D
at price P
S
S
D
Using a Predator-Prey Model to Explain Variations of Cloud Spot Price
53
disclosed by Amazon (Amazon, 2015a). To better
understand the market-driven mechanism for Cloud
spot service, it would be significantly helpful if the
backend information behind spot prices is also visible.
Since it is impossible for us to capture the real-
time demands and resources in the market, we
decided to use simulation to visualize their changes.
Considering that Amazon tends to hold a period of
time between different price points (Wee, 2011), we
regard Cloud spot service as a discrete-time system
(Åström and Murray, 2008). As such, if viewing the
interaction between demand and resource as the
relationship between predator and prey by analogy
with the two-species ecological system, then it would
be natural to employ a Predator-Prey model to realize
the simulation.
It is notable that, for investigating ecological
systems, the birth and/or death rates are key
components in any form of Predator-Prey model
(Berryman, 1992). Therefore, we start from
determining the birth and death rates of spot service
demand and resource before building the model.
3.1 Birth Rates of Demand and
Resource
Inspired by the explanations in (Xu and Li, 2013), we
define the “birth” of demands as new request arrivals,
which is expressed as a Poisson process with rate f(p),
and the birth rate f(p) represents the amount of spot
resources requested per unit time; while defining the
“birth” of resources as the leave of satisfied requests
and the release of available resources, which also
follows a Poisson process with rate g(p), and the birth
rate g(p) represents the amount of spot resources
released per unit time.
Mainly following the assumptions in the previous
work (Xu and Li, 2013), we treat the assumed demand
arrival and departure rate functions as demand and
resource birth rate functions respectively for the
potential Predator-Prey model, as shown in Equation
(1) and (2).
(
)
=
1−
(>0,>1,>1)
(1)
(
)
=1−
1−
(>0,>0,>0)
(2)
When it comes to setting values of the parameters,
we reuse the example value 5 for k (Xu and Li, 2013)
while resetting a and b to be 3. In particular, the value
of k constrains the ceiling amount of new-born
demands or resources, while setting a and b to be 3
can relax the transformed spot price p over an interval
wider than [0, 1] if necessary. Note that, to match the
birth rate functions, we transform original spot prices
by dividing them by their corresponding fixed (on-
demand) price. Take Amazon’s spot service for
example, since spot prices of a particular instance
type could be unexpectedly higher than the fixed
price (Wee, 2011), some high spot prices would be
greater than 1 after transformation, as demonstrated
in the middle column of Table 1. In this case, the
greater-than-one prices imply a clear discouragement
to spot resource employment. In addition, without
loss of generality, the bigger value of a and b can
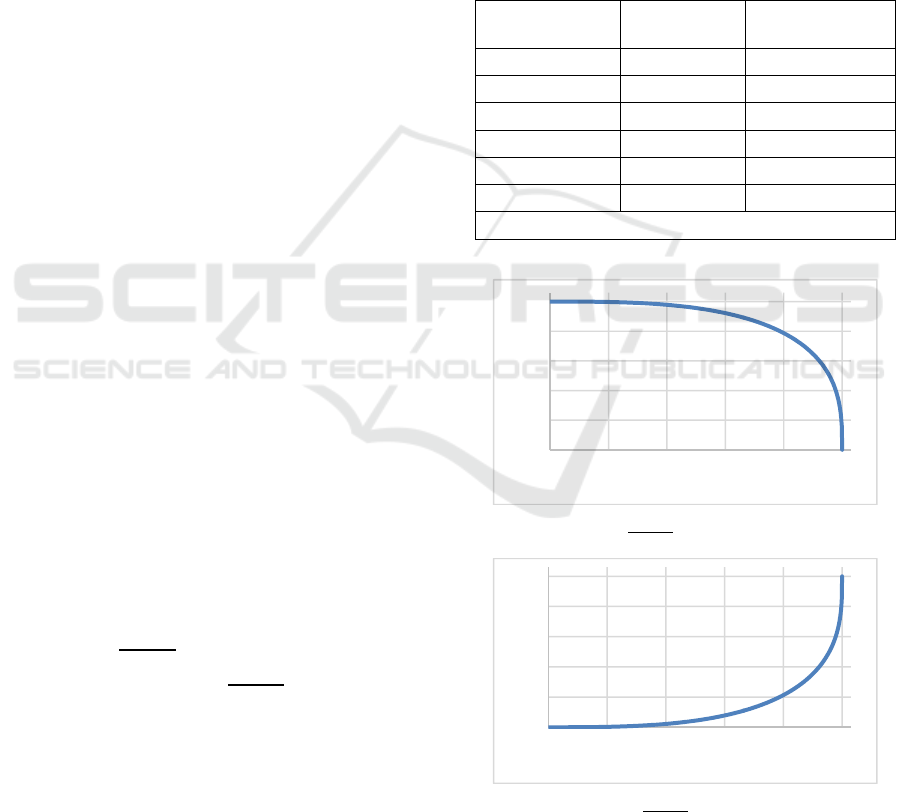
Table 1: Transforming spot prices of Amazon’s Instance
type m3.large.
Original Spot
Price p
o
(USD $)*
Transformed
Spot Price p
Rounded p
0.043 0.279 0.279
0.1 0.649 0.649
0.14 0.909 0.909
0.15 0.974 0.974
0.228 1.481 1
0.5 3.247 1
The fixed price of instance type m3.large is $0.154.
*The data are from the same price trace as illustrated in Figure 5.
(a) Demand birth rate function:
(
)
=
1−
,=5,=3,=3).
(b) Resource birth rate function:
(
)
=(1−
1−
),=5,=3,=3).
Figure 3: Demand and Resource birth rate functions in the
Cloud spot market (an adapted version from (Xu and Li,
2013)).
0
1
2
3
4
5
0 0,2 0,4 0,6 0,8 1
Demand Birth Rate f(p)
Transformed Spot Price p
0
1
2
3
4
5
0 0,2 0,4 0,6 0,8 1
Resource Birth Rate g(p)
Transformed Spot Price p
CLOSER 2016 - 6th International Conference on Cloud Computing and Services Science
54

make the birth rate functions better align with “the
common psychology” emphasized in (Xu and Li,
2013), as shown in Figure 3: consumers would
quickly lose financial incentives to use spot service
when its price is approaching the fixed price, while
their demands may not be sensitive to the price
variation when spot service is far cheaper than the on-
demand option.
Furthermore, this transformation is more rational
than standardizing spot prices into the interval [0, 1],
because the standardization will lose the comparability
between spot prices and their corresponding fixed
price. To reduce the noise of the birth rate functions
when the transformed price p is higher than 1, we
further round p to 1 if p > 1 (cf. Table 1).
3.2 Death Rates of Demand and
Resource
The “death” of both demand and resource reflects the
consumption of Cloud spot service. We define that
resources are “dead” as soon as they are being
consumed; and demands are “dead” as soon as they
are being serviced, without waiting for their satisfied
moment.
To determine the demand death rate α and
resource death rate β, we resort to three intuitive
assumptions.
(1) We consider 80% as the death rate for resource
if there are more than acceptable amount of
demands, i.e. β = 0.8. In fact, due to the possible
risks of SLA violation and the inevitable
maintenance, Cloud providers would not be
interested in a resource utilization that approaches
100% (Puschel et al., 2007). On the contrary, an
average resource utilization of 80% has been
widely considered to be optimal (Puschel et al.,
2007; Wescott, 2013).
(2) If the demands are not enough to saturate the
optimal service capacity, the amount of dead
resource would be equal to the amount of dead
demand. In other words, the resource death rate
would be less than 80% in this case.
(3) Inspired by the Pareto distributions (80-20
rule) (Newman, 2005), we also set 80% as the
death rate for demand no matter whether or not the
demands are beyond the optimal service capacity,
i.e. α = 0.8. To unify both situations, we suppose
that some out-of-capacity demands would
eventually give up employing the spot service, and
thus they can also be considered to be dead
although without being serviced. In this case, it is
still possible to assume only 20% of demands left
for rebidding for the spot service in the next round.
In summary, we set the death rate to be 80% for both
spot demand and resource.
3.3 Predator-Prey Model of Demand
and Resource
Figure 4: Using a timeline to design the logic behind a
Predator-Prey model for spot demand and resource.
Based on a timeline of spot price variations, we
design the intuitive logic behind a Predator-Prey
model for recursively exhibiting the amount of
demand and resource, as shown in Figure 4. In detail,
we use D(t) and R(t) to refer to the amounts of
residual demand and residual resource respectively at
time t; while D(t+∆t) and R(t+∆t) respectively
represent the amounts of new demand and resource
after a period of time ∆t since t. In particular, ∆t
indicates the time span between two price-adjustment
points. Taking Amazon as an example, interestingly,
its spot service’s prices used to be adjusted hourly
(i.e. ∆t = 1 hour) (Wee, 2011), while the spot price
change frequency becomes multiple times per hour
recently (i.e. ∆t < 1 hour) (Guo et al., 2015). Note that
here we consider the Predator-Prey model by
following the logistic thinking of “principle of
population” (Berryman, 1992) instead of reusing the
difference equations that require interaction terms
(Åström and Murray, 2008). In other words, we claim
that the interaction between demand and resource has
been reflected by using their both birth and death
rates.
By further specifying the logic items with the
predefined birth and death rates, we define the
Predator-Prey Model of demand and resource in the
Cloud spot market, as shown in Equation (3).
(
+∆
)
=
(
)
+
(
)
×∆
−
(
)
×∆
(
+∆
)
=
(
)
+
(
)
×∆
−min(()×∆,()×∆)
(3)
To keep a consistent order of magnitude with the
predefined values for those birth rate functions (cf.
Figure 3), we set the initial amounts of spot demand
t t+∆t
Demand
at time t,
i.e. D(t)
Resource
at time t,
i.e. R(t)
Born demand
during ∆t
Dead demand
during ∆t
+
–
Demand at
time t+∆t,
i.e. D(t+∆t)
=
Born resource
during ∆t
Dead resource
during ∆t
+
–
Resource at
time t+∆t,
i.e. R(t+∆t)
=
Using a Predator-Prey Model to Explain Variations of Cloud Spot Price
55

and resource both to 5 at the starting point, i.e. D(0)
= 5 and R(0) = 5. Furthermore, we assume that the
price adjustment happens every unit time interval,
and the unit time intervals have uniformly regular
sizes, i.e. ∆t = 1 without necessarily considering the
unit representation. As such, the impact of time
interval ∆t can be ignored when calculating both the
birth and the death of spot demands and resources.
Overall, an example setting for initializing the
parameters of this model is specified in Equation (4).
(
)
=5×
1−
(
)
=5×1−
1−
(
0
)
=
(
0
)
=5,=
=0.8,∆=1
(4)
4 SIMULATION USING
AMAZON’S SPOT PRICE
TRACE
Given particular initialization settings (e.g., Equation
(4)), this Predator-Prey model can generate demand
and resource simulations corresponding to spot price
traces. To facilitate simulation, we implement the
Predator-Prey model into executable codes, as
specified in Algorithm 1. This straightforward
algorithm also shows that replicating our study would
not be difficult. When it comes to the spot price trace,
we use Amazon’s Command Line Interface (CLI)
tool ec2-describe-spot-price-history (Amazon,
2015b) to collect historical spot prices of the instance
type m3.large whose price has relatively frequent
fluctuations at the time of writing. For the purpose of
conciseness, we only select a typical piece of data
(spot price records between 2015-03-12 00:01:10 and
2015-03-16 09:23:56) in the collected full trace
2
as
illustrated in Figure 5. Note that not all the historical
spot prices can be used to generate reasonable
simulations. Only frequently oscillating price traces
can fit in our Predator-Prey model. In fact, a piece of
flat price trajectory might indicate a lack of demands
during that time period, and therefore leading to few
demand-resource interactions. Such a scenario cannot
employ any Predator-Prey model, because it deviates
from the natural Predator-Prey rules.
Following the consecutive time series in the
selected price trace, the sequential amounts of
demand and resource can be calculated along with the
changing spot prices, as plotted in Figure 6. As
mentioned previously, we use the rounded
transformed prices for the calculations (cf. Table 1).
It is clear that, although we have made simplifying
assumptions for building this Predator-Prey model,
the simulation here can still help reveal basic
information behind spot prices. For example:
Figure 5: Amazon’s spot price variation trace between
2015-03-12 00:01:10 and 2015-03-16 09:23:56 (instance
type: m3.large, OS type: Linux/UNIX, zone: us-east-1b).
• Consumer demands remain at a low level when
the spot service is generally expensive.
• Spare resources remain at a low level when the
spot service is generally cheap.
• Spot resources would gradually be released
rather than a burst when the spot service is
becoming expensive.
0
0,1
0,2
0,3
0,4
0,5
1 51 101 151 201 251 301 351
Original Spot Price (USD)
Price Variation Points
Algorithm 1: Demand-Resource Interaction Simulation.
Input: Array of historical spot prices P = (p
1
, p
2
, p
3
, …, p
t
),
initial demand amount d
0
, initial resource amount r
0
, birth rate
factors a, b, k, demand death rate α, resource death rate β.
Output: Array of demand amount D = (d
1
, d
2
, …, d
t
), array of
resource amount R = (r
1
, r
2
, …, r
t
).
1: function D
BR
(p) //Demand birth rate at price p
2: ←×(1−
)
/
3: return f
4: end function
5: function R
BR
(p) //Resource birth rate at price p
6: ←×[1−(1−
)
/
]
7: return g
8: end function
9:
←
//Initial current demand amount at time t
10:
←
//Initial current resource amount at time t
11:
←0 //Initial new demand amount at time t+1
12:
←0 //Initial new resource amount at time t+1
13: ←∅∪
//Initial array of demand amount
14: ←∅∪
//Initial array of resource amount
15: for j = 1, 2, 3, …, t do
16:
←
+
−×
17:
←
+
−min{×
,×
}
18: ←∪
19: ←∪
20:
←
21:
←
22: end for
23: return D, R
2
The complete spot price trace with 24000 records of spo
t
instance type m3.large has been shared online:
https://docs.google.com/spreadsheets/d/1mBUItaGwsa44J5
DHLS0H mh9
Q
LK
j
O
Q
PTl7O
q
7aiuAc/
CLOSER 2016 - 6th International Conference on Cloud Computing and Services Science
56
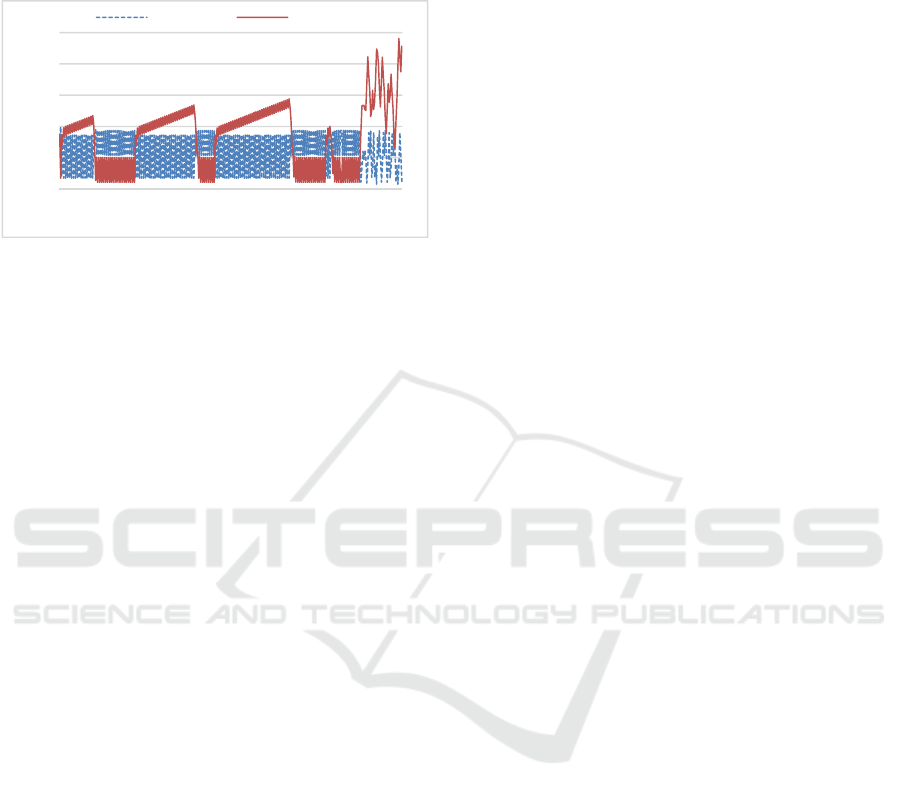
• In contrast, the spot service capacity could
quickly be saturated by attracting demands at
low spot prices.
Figure 6: Demand and Resource simulation corresponding
to Amazon’s spot price variation trace between 2015-03-12
00:01:10 and 2015-03-16 09:23:56 (instance type:
m3.large, OS type: Linux/UNIX, zone: us-east-1b).
The first two simulation findings are aligned with
our common sense, while the others require further
validation in practice. In particular, the frequent sharp
drops of resources revealed by the fourth finding
might indicate the regular herd behaviours of spot
demands. Originally, herd behaviour refers to a
typical phenomenon when a group of individuals act
collectively without centralized direction, and it could
happen among animals as well as humans (Braha,
2012). By analogy, the herd behaviour of spot
demands could result from the same behaviour of
users when bidding for cheap Cloud spot resources.
Although it is difficult to make validation at this
current stage due to the lack of practical data, we can
treat this explanation as a hypothesis to be tested in
the future.
5 CONCLUSIONS AND FUTURE
WORK
Among the three typical pricing schemes in the de
facto Cloud market, spot pricing has been widely
accepted as the most resource-efficient strategy for
Cloud providers and the most cost-effective option
for Cloud consumers. Nevertheless, the spot pricing
scheme seems not to be popular yet for trading Cloud
resources, because the market-driven mechanism for
pricing spot service would be complicated both for
providers to implement and for consumers to
understand. Despite limited historical spot prices
disclosed by Amazon, the existing spot market
activities are generally invisible especially for Cloud
consumers.
To help better understand the operations in the
Cloud spot market, we developed a Predator-Prey
model to visualize the potential demand-resource
interactions based on the available spot price traces.
The simulation study has revealed some basic
information behind spot price variations, and also
proposed a hypothesis guiding us in future validation.
Overall, our work essentially shows that utilizing a
Predator-Prey model could be a promising approach
to reversely engineer spot market activities.
However, there is still a lack of practical data to
validate our simulation findings. Such a limitation
drives our future work along two directions. On the
one hand, we will gradually improve our Predator-
Prey model by employing relatively solid
assumptions. For example, more sophisticated
mathematical models can be used to represent the
death rates of demand and resource. On the other
hand, we will try to extract useful demand and
resource data from workload traces, and conduct
workload characterization to verify the findings of
this study.
ACKNOWLEDGEMENTS
This work is supported by the Swedish Research
Council (VR) for the project “Cloud Control”, and
through the LCCC Linnaeus and ELLIIT Excellence
Centers.
REFERENCES
Abhishek, V., Kash, I. A., and Key, P. (2012). Fixed and
market pricing for Cloud services. In Proc. 7th
Workshop on the Economics of Networks, Systems, and
Computation (NetEcon 2012), pages 157–162,
Orlando, FL, USA. IEEE Computer Society.
Al-Roomi, M., Al-Ebrahim, S., Buqrais, S., and Ahmad, I.
(2013). Cloud computing pricing models: A survey.
International Journal of Grid and Distributed
Computing, 6(5):93–106.
Amazon (2015a). Amazon EC2 spot instances.
https://aws.amazon.com/ec2/purchasing-options/spot-
instances/.
Amazon (2015b). ec2-describe-spot-pricehistory. http://
docs.aws.amazon.com/AWSEC2/latest/CommandLine
Reference/ApiReference-cmd-DescribeSpotPrice
History.html.
Åström, K. J. and Murray, R. M. (2008). Feedback Systems:
An Introduction for Scientists and Engineers. Princeton
University Press, Princeton, New Jersey.
Berryman, A. A. (1992). The origins and evolution of
predator-prey theory. Ecology, 73(5):1530–1535.
0
3
6
9
12
15
1 51 101 151 201 251 301 351
Amount
Price Variation Points
Demand Resource
Using a Predator-Prey Model to Explain Variations of Cloud Spot Price
57

Braha, D. (2012). Global civil unrest: Contagion, self-
organization, and prediction. PLoS ONE, 7(12):1–9.
Chaisiri, S., Kaewpuang, R., Lee, B.-S., and Niyato, D.
(2011). Cost minimization for provisioning virtual
servers in Amazon elastic compute Cloud. In Proc. 19th
Ann. IEEE Int. Symp. Modelling, Analysis, and
Simulation of Computer and Telecommunication
Systems (MASCOTS 2011), pages 85–95, Singapore.
IEEE Computer Society.
Chohan, N., Castillo, C., Spreitzer, M., Steinder, M.,
Tantawi, A., and Krintz, C. (2010). See spot run: Using
spot instances for MapReduce workflows. In Proc. 2nd
USENIX conf. Hot topics in cloud computing
(HotCloud 2010), pages 1–7, Boston, MA, USA.
USENIX Association.
Delimitrou, C. and Kozyrakis, C. (2014). Quasar:
Resource-efficient and QoS-aware cluster
management. In Proc. 19th Int. Conf. Architectural
Support for Programming Languages and Operating
Systems (ASPLOS 2014), pages 127–144, Salt Lake
City, Utah, USA. ACM Press.
Di Valerio, V., Cardellini, V., and Lo Presti, F. (2013).
Optimal pricing and service provisioning strategies in
Cloud systems: A Stackelberg game approach. In Proc.
6th IEEE Int. Conf. Cloud Computing (CLOUD 2013),
pages 115–122, Santa Clara, CA, USA. IEEE Computer
Society.
Guo, W., Chen, K., Wu, Y., and Zheng, W. (2015). Bidding
for highly available services with low price in spot
instance market. In Proc. 24th Int. ACM Symp. High-
Performance Parallel and Distributed Computing
(HPDC 2015), pages 191–202, Portland, Oregon, USA.
ACM Press.
Jangjaimon, I. and Tzeng, N.-F. (2015). Effective cost
reduction for elastic Clouds under spot instance pricing
through adaptive checkpointing. IEEE Transactions on
Computers, 64(2): 396–409.
Kantere, V., Dash, D., Franc¸ois, G., Kyriakopoulou, S.,
and Ailamaki, A. (2011). Optimal service pricing for a
Cloud cache. IEEE Transactions on Knowledge and
Data Engineering, 23(9):1345–1358.
Karunakaran, S. and Sundarraj, R. P. (2013). On using
prisoner dilemma model to explain bidding decision for
computing resources on the Cloud. In Proc. 13th Int.
Conf. Group Decision and Negotiation (GDN 2013),
pages 206–215, Stockholm, Sweden.
Li, Z., Zhang, H., O’Brien, L., Jiang, S., Zhou, Y., Kihl, M.,
and Ranjan, R. (2016). Spot pricing in the Cloud
ecosystem: A comparative investigation. Journal of
Systems and Software, 114: 1–19.
Mazzucco, M. and Dumas, M. (2011). Achieving
performance and availability guarantees with spot
instances. In Proc. 13th IEEE Int. Conf. High
Performance Computing and Communications (HPCC
2011), pages 296–303, Banff, Canada. IEEE Computer
Society.
Newman, M. E. J. (2005). Power laws, Pareto distributions
and Zipf’s law. Contemporary Physics, 46(5):323–351.
Puschel, T., Borissov, N., Mac´ıas, M., Neumann, D.,
Guitart, J., and Torres, J. (2007). Economically
enhanced resource management for Internet service
utilities. In Proc. 8th Int. Conf. Web Information
Systems Engineering (WISE 2007), pages 335–348,
Nancy, France. Springer-Verlag.
Shi, W., Zhang, L., Wu, C., Li, Z., and Lau, F. C. (2014).
An online auction framework for dynamic resource
provisioning in Cloud computing. In Proc. 2014 ACM
Int. Conf. Measurement and Modeling of Computer
Systems (SIGMETRICS 2014), pages 71–83, Austin,
Texas, USA. ACM Press.
v. Kistowski, J., Herbst, N., and Kounev, S. (2014).
Modeling variations in load intensity over time. In
Proc. 3rd Int. Workshop on Large Scale Testing (LT
2014), pages 1–4, Dublin Ireland. ACM Press.
Wang, P., Qi, Y., Hui, D., Rao, L., and Lin, X. (2013).
Present or future: Optimal pricing for spot instances. In
Proc. 33rd Int. Conf. Distributed Computing Systems
(ICDCS 2013), pages 410–419, Philadelphia, USA.
IEEE Computer Society.
Wee, S. (2011). Debunking real-time pricing in Cloud
computing. In Proc. 11th IEEE/ACM Int. Symp.
Cluster, Cloud and Grid Computing (CCGrid 2011),
pages 585–590, Newport Beach, CA, USA. IEEE
Computer Society.
Wescott, B. (2013). Every Computer Performance Book:
How to Avoid and Solve Performance Problems on The
Computers You Work With. CreateSpace Independent
Publishing Platform.
Xu, H. and Li, B. (2013). Dynamic Cloud pricing for
revenue maximization. IEEE Transactions on Cloud
Computing, 1(2):158–171.
Zaman, S. and Grosu, D. (2011). Efficient bidding for
virtual machine instances in Clouds. In Proc. 4th IEEE
Int. Conf. Cloud Computing (CLOUD 2011), pages 41–
48, Washington, DC, USA. IEEE Computer Society.
CLOSER 2016 - 6th International Conference on Cloud Computing and Services Science
58
