
Human Activity Recognition
Using Sensor Data of Smartphones and Smartwatches
Bishoy Sefen
1
, Sebastian Baumbach
2,3
, Andreas Dengel
2,3
and Slim Abdennadher
1
1
German University in Cairo, Cairo, Egypt
2
University of Kaiserslautern, Kaiserslautern, Germany
3
German Research Center for Artificial Intelligence (DFKI), Kaiserslautern, Germany
Keywords:
Activity Recognition, Fitness Games, Sensors, Smartphones, Smartwatches, Machine Learning, Data Mining.
Abstract:
Unobtrusive and mobile activity monitoring using ubiquitous, cheap and widely available technology is the
key requirement for human activity recognition supporting novel applications, such as health monitoring. With
the recent progress in wearable technology, pervasive sensing and computing has become feasible. However,
recognizing complex activities on light-weight devices is a challenging task. In this work, a platform to com-
bine off-the-shelf sensors of smartphones and smartwatches for recognizing human activities in real-time is
proposed. In order to achieve the best tradeoff between the system’s computational complexity and recogni-
tion accuracy, several evaluations were carried out to determine which classification algorithm and features
to be used. Therefore, a data set from 16 participants was collected that includes normal daily activities and
several fitness exercises. The analysis results showed that naive Bayes performs best in our experiment in both
the accuracy and efficiency of classification, while the overall classification accuracy is 87% ± 2.4.
1 INTRODUCTION
Physical activity is well-known by the general pub-
lic to be crucial for leading a healthy life. Thus, re-
searchers are seeking a better understanding of the re-
lationship between physical activity and health. Pre-
cise recording of the conducted activities is an essen-
tial requirement of their research. (Bauman et al.,
2006)
This data can be used to design and con-
struct activity recognition systems. These systems
allow physicians to check the recovery develop-
ment of their patients automatically and constantly
(da Costa Cachucho et al., 2011). Another rising con-
cern is the sedentary life many people live, due to the
shift in lifestyle occurring in the modern world, where
work and leisure tend to be less physically demand-
ing (Gyllensten, 2010). Several reports have already
found links between common diseases and physical
inactivity (Preece et al., 2009). Thus, activity recog-
nition can be used by recommender systems to help
the users track their daily physical activity and pro-
mote them to increase their activity level.
With the recent progress in wearable technology,
unobtrusive and mobile activity recognition has be-
come reasonable. With this technology, devices like
smartphones and smartwatches are widely available,
hosting a wide range of built-in sensors, at the same
time, providing a large amount of computation power.
Overall, the technological tools exist to develop a mo-
bile, unobtrusive and accurate physical activity recog-
nition system. Therefore, the realization of recogniz-
ing the individuals’ physical activities while perform-
ing their daily routine has become feasible. So far,
no-one has investigated the usage of light-weight de-
vices for recognizing human activities.
An activity recognition system poses several main
requirements. First, it should recognize activities in
real-time. This demands that the features used for
classification are computable in real-time. Moreover,
short window durations must be employed to avoid
delayed response. Finally, the classification schemes
should be simple, light-weight and computationally
inexpensive to be able to run on hand-held devices.
In this work, a method for recognizing human
activities using the acceleration sensors incorporated
in smartphones and smartwatches is proposed, while
fulfilling the requirements stated above (Section 3).
Therefore, an experiment is done to collect data from
16 participants (Section 4). Different classification al-
gorithms are evaluated in order to find the best trade-
off between computational complexity and recogni-
488
Sefen, B., Baumbach, S., Dengel, A. and Abdennadher, S.
Human Activity Recognition - Using Sensor Data of Smartphones and Smartwatches.
DOI: 10.5220/0005816004880493
In Proceedings of the 8th International Conference on Agents and Artificial Intelligence (ICAART 2016) - Volume 2, pages 488-493
ISBN: 978-989-758-172-4
Copyright
c
2016 by SCITEPRESS – Science and Technology Publications, Lda. All rights reserved

tion accuracy, in addition to, evaluating the best fea-
tures to be used with them (Section 5). Finally, the
results show that this platform is able to recognize
various human activies and using a smartwatch com-
bined with a smartphone improves the accuracy of the
recognition process (Section 6).
2 RELATED WORK
Past work focused on the use of multiple accelerom-
eters placed on several parts of the user’s body.
Bao and Intille used five bi-axial accelerometers dis-
tributed across the user’s body. They tested their ap-
proach with data of twenty users. (Bao and Intille,
2004). Krishnan et al. used two accelerometers to
recognize five activities (Krishnan et al., 2008). They
collected data from only three users. Parkka et. al.
created a system using twenty different types of sen-
sors in order to recognize activities such as football,
croquet, and using the toilet (Parkka et al., 2006).
Subramayana et. al. addressed normal daily ac-
tivities by using data not only from a tri-axial ac-
celerometer, but from micro-phones, temperature sen-
sors and barometric pressure sensors as well (Subra-
manya et al., 2012). These systems using multiple ac-
celerometers and other sensors were capable of iden-
tifying a wide range of activities. However, they are
not practical as they involve the user wearing multiple
sensors distributed across his body.
Other studies focused on the use of a single ac-
celerometer for activity recognition. Long et al.
placed a tri-axial accelerometer worn at the user’s
waist, recognizing walking, jogging, running, cy-
cling, and sports of twenty four users (Long et al.,
2009). Lee et. al. used a single accelerometer at-
tached to the left waists of only five users (Lee, 2009).
However, all of these studies used devices specifically
made for research purposes.
Several investigations have considered the use of
widely available mobile devices. Ravi et. al. col-
lected data from only two users wearing a single
accelerometer-based device and then transmitted this
data to the phone carried by the user (Ravi et al.,
2005). Lester et. al. used accelerometer data from
a small set of users along with audio and barometric
sensor data to recognize eight daily activities (Lester
et al., 2006). However, the data was generated using
distinct accelerometer-based devices worn by the user
and then sent to the phone for storage.
Some studies took advantage of the sensors incor-
porated into the phones themselves. Yang developed
an activity recognition system using a smartphone to
distinguish between various activities (Yang, 2009).
However, stair climbing was not considered and their
system was trained and tested using data from only
four users. Brezmes et. al. developed a real-time
system for recognizing six user activities (Brezmes
et al., 2009). In their system, an activity recognition
model is trained for each user, i.e., there is no univer-
sal model that can be applied to new users for whom
no training data exists. Bayat et al. gathered acceler-
ation data from only four participants, performing six
activities. (Bayat et al., 2014) Shoaib et al. evaluated
different classifiers by collecting data of smartphone
accelerometer, gyroscope, and magnetometer for four
subjects, perfoming six actvities. (Shoaib et al., 2013)
3 METHODOLOGY
In this section, the activity recognition process is de-
scribed, containing four main stages.
3.1 Data Collection
The first step is to collect multivariate time series data
from the phone’s and the watch’s sensors. The sensors
are sampled with a constant frequency of 30 Hz. Af-
ter that, the sliding window approach is utilized for
segmentation, where the time series is divided into
subsequent windows of fixed duration without inter-
window gaps (Banos et al., 2014). The sliding win-
dow approach does not require preprocessing of the
time series, and is therefore ideally suited to real-time
applications.
3.2 Preprocessing
Filtering is performed afterwards to remove noisy val-
ues and outliers from the accelerometer time series
data, so that it will be appropriate for the feature
extraction stage. There are two basic types of fil-
ters that are usually used in this step: average filter
(Sharma et al., 2008) or median filter (Thiemjarus,
2010). Since the type of noise dealt with here is sim-
ilar to the salt and pepper noise found in images, that
is, extreme acceleration values that occur in single
snapshots scattered throughout the time series. There-
fore, a median filter of order 3 (window size) is ap-
plied to remove this kind of noise.
3.3 Feature Extraction
Here, each resulting segment will be summarized by
a fixed number of features, i.e., one feature vector
per segment. The used features are extracted from
Human Activity Recognition - Using Sensor Data of Smartphones and Smartwatches
489
both time and frequency domains. Moreover, all fea-
tures are going to be computed from the 3 acceleration
components A
x
, A
y
, A
z
, in addition to, a 4
th
compo-
nent derived as
q
A
x
2
+ A
y
2
+ A
z
2
, which is known as
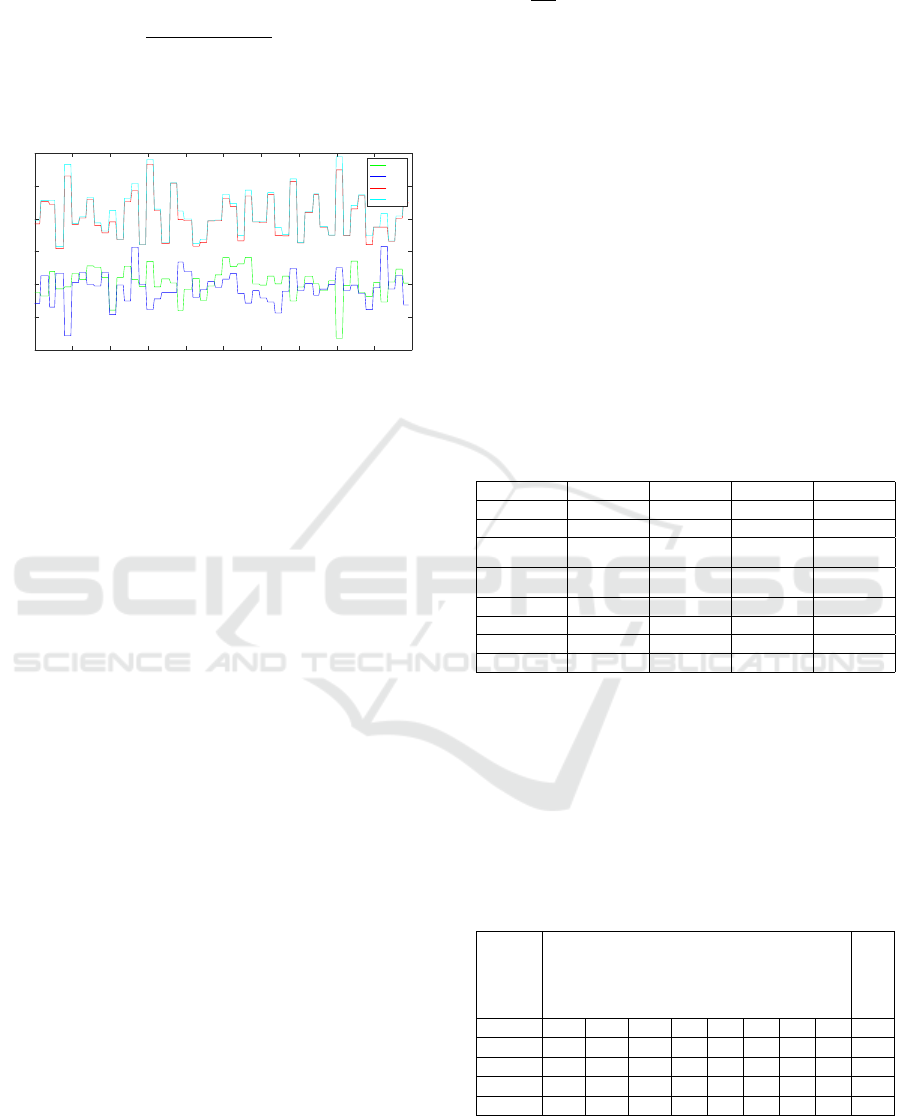
the magnitude component (see Figure 1). Therefore
for each device (phone and watch), there are going to
be 4 values per feature type, i.e., 8 values combined
per feature type.
Time (s)
0 1 2 3 4 5 6 7 8 9 10
Acceleration (m/s
2
)
-10
-5
0
5
10
15
20
x
y
z
mag
Figure 1: The accelerometer time series data of ascending
the stairs, consisting of the three axial components plus the
derived magnitude component (mag).
In the time domain, the following statistical fea-
tures are computed: Mean, Minimum, Maximum,
Range, Standard Deviation, and Root-Mean-Square.
Since, many activities have a repetitive nature, i.e.,
they consist of a set of movements that are done pe-
riodically like walking and running. This frequency
of repetition, also known as dominant frequency, is
a descriptive feature and thus, it has been taken into
consideration. (Telgarsky, 2013). Consequently, fast
Fourier transform (FFT) is performed on the time se-
ries outputting a list of frequencies along with their re-
spective magnitudes (Sharma et al., 2008). Then, the
frequency with the highest magnitude will be selected
as the dominant frequency. Moreover, to increase the
descriptiveness of the features, the 2
nd
dominant fre-
quency will also be selected.
To sum up, 8 different types of features will be
computed, 6 from the time domain, while 2 from the
frequency domain. Since each feature type is ex-
tracted from 4 components, therefore, 32 features will
be used to summarize the accelerometer time series.
Finally, the features computed from both the phone’s
and the watch’s sensors will be combined, producing
a 64 value feature vector.
3.4 Standardization
Since, the time domain features are measured in
(
m
/s
2
), while the frequency ones in (Hz), therefore, all
features should have the same scale for a fair compar-
ison between them, as some classification algorithms
use distance metrics. In this step, Z-Score standard-
ization is used, which will transform the attributes to
have zero mean and unit variance, and is defined as
x
new
=
x−µ
σ
, where µ and σ are the attribute’s mean and
standard deviation respectively (Gyllensten, 2010).
4 EXPERIMENT
An experiment was conducted, where the participants
wore the watch on the left hand and placed the phone
in the front right pocket of the pants while performing
diverse activities. A total of 16 participants (8 males
and 8 females) performed the complete set of the se-
lected activities (see table 1). This activities can be
grouped under normal everyday activities, or fitness
exercises. The four everyday activities are walking,
jogging, idle (both standing and sitting), and using
the stairs (both ascending and descending). While the
selected fitness exercises are rope jumping, pushups,
crunches, and squats.
Table 1: The details of the collected recordings for each
activity type.
Activity Recording 1 Recording 2 Recording 3 Recording 4
Walking 100 meters 100 meters 100 meters ˜
Jogging 100 meters 100 meters 100 meters ˜
Idle
Standing
20 seconds
Sitting
20 seconds
Standing
20 seconds
Sitting
20 seconds
Stair Climbing
Ascending
16 stair steps
Descending
16 stair steps
Ascending
16 stair steps
Descending
16 stair steps
Rope jumping 20 seconds 20 seconds 20 seconds ˜
Pushups 5 repetitions 5 repetitions 5 repetitions ˜
Crunches 5 repetitions 5 repetitions 5 repetitions ˜
Squats 5 repetitions 5 repetitions 5 repetitions ˜
The datasets used later in the evaluations were de-
rived afterwards. The window durations used for seg-
menting the recordings are 1, 2, 3, 4, and 5 seconds.
Therefore, 5 different datasets resulted. Information
about the composition of these datasets is shown in
Table 2, where the samples number for each activity,
and the total number of samples are shown for each
dataset. Finally, dataset x is the one resulting from
segmenting the recordings using a x seconds window.
Table 2: The composition of the used datasets.
Dataset
Idle
Walking
Jogging
Stairs
Rope jumping
Pushups
Crunches
Squats
Total
Dataset 1 1228 3190 1334 531 817 430 449 448 8427
Dataset 2 605 1581 655 248 402 204 211 210 4116
Dataset 3 397 1048 429 158 262 126 134 137 2691
Dataset 4 277 778 317 107 184 91 89 95 1938
Dataset 5 213 620 245 82 140 64 74 67 1505
ICAART 2016 - 8th International Conference on Agents and Artificial Intelligence
490
5 EVALUATION
Several evaluations were conducted in order to find
the optimal parameters and configurations to be used,
taking into consideration mainly the recognition ac-
curacy, speed of execution, and their applicability to
real-time recognition.
To obtain reliable user-independent results, leave-
one-participant-out cross validation (LOPOCV) is
used, where the left out part in each iteration is the
entire collection of samples from a single participant.
Since the collected data consists of 16 participants,
therefore, 16 iterations of train-test will be performed.
A common greedy feature selection algorithm
known as forward selection is used to find the best
scoring feature subset for each classification algo-
rithm candidate. However, the search of possible fea-
ture subsets is likely to find a misleadingly well scor-
ing one by chance. To prevent this, a complex scor-
ing function that evaluates feature subsets against sev-
eral datasets is used. At first, it uses the leave-one-
participant-out cross validation (LOPOCV) to com-
pute the accuracies for the five datasets, then, it com-
putes the final score as the average of the resulting
accuracies.
In this work, the following classification algo-
rithms are evaluated: Support Vector Machine: linear
and polynomial kernels, One-Vs-All method, Deci-
sion Tree: Gini index as a split criteria, Naive Bayes:
Gaussian distribution, Discriminant Analysis: linear
and quadratic, K-Nearest Neighbors: Euclidean dis-
tance metric, K from 1 till 10.
5.1 Classification Accuracy
The first evaluation aims at comparing the perfor-
mance of different classification algorithms, in addi-
tion to, determining the best feature subset for each
one. However, one of the variables that can affect the
results is the window duration. At the same time, per-
forming this evaluation while fixing the window dura-
tion, would lead to the argument that the findings are
dependent on the used window duration and dataset,
i.e., they can not be generalized to other window du-
rations.
The results of the forward feature selection shows
that naive Bayes reached the highest average accu-
racy, which is 89.4% for the subset consisting of 18
features. Moreover, this 89.4% accuracy is derived
from averaging the individual LOPOCV accuracies
of each dataset, which are 85.5%, 88.6%, 90.5%,
90.9%, and 91.5% respectively. Finally, the best
performing feature subset for naive Bayes consists
of 18 features, which are: PMinZ, WStdM, PStdM,
WMinM, WFq1M, PFq1Z, PStdY, WAvgZ, WStdY,
PFq2Z, PMinM, PFq2M, WFq2M, WFq1Y, WAvgX,
PFq1X, WFq2Z, and PFq2Y.
P: phone, W: watch; Avg: average, Min: minimum,
Std: standard Deviation, Fq1: most dominant fre-
quency, Fq2: second most dominant frequency; X:
x-component, Y: y-component, Z: z-component, M:
magnitude component.
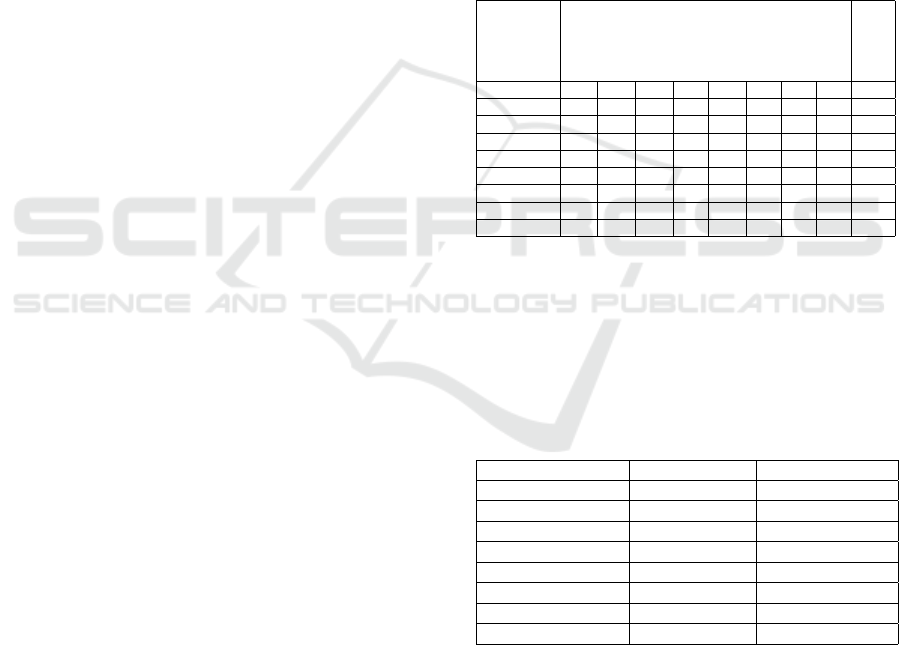
The confusion matrix for the highest scoring fea-
ture subset is presented in Table 3, where the rows
correspond to the actual performed activities, while
the columns correspond to the predicated activity la-
bels. This matrix is derived from the classification re-
sults of the 5 datasets, which means it is the accumu-
lation of 5 confusion matrices (one for each dataset).
Table 3: The confusion matrix for the naive Bayes classifier.
Activity
Idle
Walking
Jogging
Stair Climbing
Rope jumping
Pushups
Crunches
Squats
Recall
Idle 2589 0 0 0 0 94 36 1 95.2
Walking 0 6620 15 424 0 1 0 157 91.7
Jogging 0 2 2769 0 209 0 0 0 92.9
Stair Climbing 6 528 14 522 3 9 3 41 46.4
Rope jumping 0 0 220 0 1585 0 0 0 87.8
Pushups 8 6 2 4 0 826 38 31 90.3
Crunches 34 7 23 5 0 71 735 82 76.8
Squats 0 28 16 44 0 14 75 780 81.5
Precision 98.2 92.1 90.5 52.3 88.2 81.4 82.9 71.4
The results in Table 4 shows that naive Bayes is
the most accurate classifier, scoring an average accu-
racy of 89.4% using 18 features subset. However,
the classification accuracy lies between 84.6% and
89.4%, at which the differences in performance are
negligible.
Table 4: The highest accuracies obtained for each classifi-
cation algorithm along with the size of their feature subsets.
Algorithm Number of Features Average Accuracy (%)
SVM (Linear) 40 84.6
SVM (Polynomial) 20 87.9
Decision Tree 17 86.3
Naive Bayes 18 89.4
LDA 45 87.9
QDA 15 89.1
K-NN (K = 6) 13 89.3
Weighted K-NN (K = 5) 14 89.3
5.2 Classification Speed
The aim for the computational efficiency is to com-
pare the candidate classification algorithms from the
previous evaluation based on their efficiencies. More-
over, each algorithm will be tested with it’s best per-
forming feature subset.
The algorithms’ efficiencies was compared by
Human Activity Recognition - Using Sensor Data of Smartphones and Smartwatches
491
measuring the time they take to complete on a spe-
cific machine. This run-time evaluation is performed
while computing the LOPOCV using Dataset 5, i.e., it
measures the amount of time spent in the training and
the classification phases of this validation algorithm.
As described earlier, the LOPOCV splits the dataset
16 times, and in each time, it trains using the data of
15 participants and tests the classifier using the data
of the left participant.
Table 5: Training and testing times for the candidate classi-
fication algorithms.
Algorithm Training Time (sec) Classification Time (sec)
SVM (Linear) 15.8 13.3
SVM (Polynomial) 15.3 12.7
Decision Tree 0.9 2.9
Naive Bayes 0.1 3.0
LDA 2.0 5.8
QDA 0.4 6.2
KNN (K = 6) 0.4 6.1
WKNN (K = 5) 0.4 6.0
Table 5 shows the accumulative time spent in
both the training and classification phases. The re-
sults show that naive Bayes has the best training time
among all of them. While for classification, it is the
second fastest algorithm after decision trees, however,
the time difference between them is almost negligible.
Given the accuracy results stated in Table 4, naive
Bayes outperforms all other candidates in terms of
both recognition accuracy and efficiency.
5.3 Sampling Frequency
The sampling frequency has a direct impact on the
system’s resources. This means lowering the sam-
pling frequency reduces the amount of operations and
computations done in the feature extraction stage, and
decreases the memory usage of the system. The data
collected throughout the experiment was sampled at
30 Hz which is relatively high. Thus, lower frequen-
cies, achieved by downsampling the collected data,
can be evaluated to determine their recognition accu-
racies.
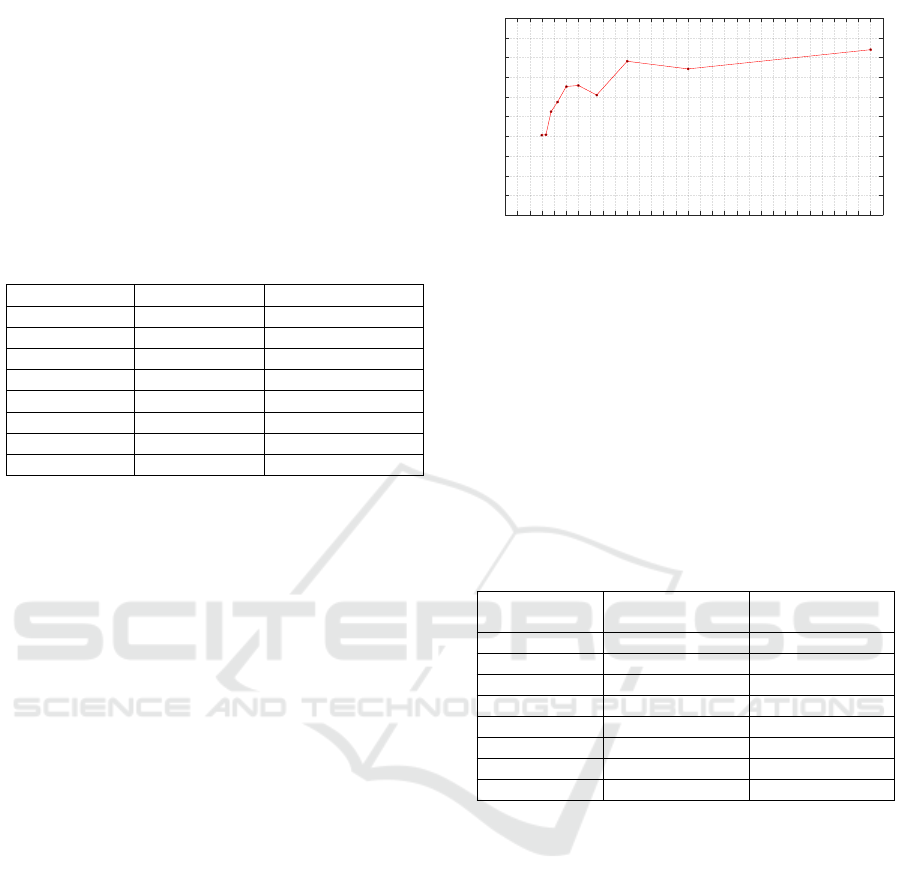
Figure 2 presents the obtained results, showing the
average accuracies resulting from using naive Bayes
on the downsampled datasets (recomputed for each
frequency). Moreover, it shows that the best fre-
quency is in the field of 10 Hz, scoring an average
accuracy of 88.8%, i.e., 0.6 percentage point decrease
when compared to the accuracy obtained using 30 Hz.
5.4 Watch Accuracy
In order to determine the improvement the watch
brings to the recognition system, the system’s accu-
Frequency (Hz)
0 1 2 3 4 5 6 7 8 9 10 11 12 13 14 15 16 17 18 19 20 21 22 23 24 25 26 27 28 29 30 31
Average Accuracy (%)
81
82
83
84
85
86
87
88
89
90
91
Figure 2: The impact of varying the sampling frequency on
the average accuracy (using naive Bayes).
racy is evaluated using the phone only, and compared
to the one obtained with both. Here, the same pro-
cedure used in the first evaluation will be reapplied,
where the forward feature selection will be used to
compute the best performing subset using only the
phone’s features. Table 6 compares the resulting av-
erage accuracies to the ones obtained in the first eval-
uation, showing the obtained improvements in the av-
erage recognition accuracy.
Table 6: The average accuracies of the classification algo-
rithms with and without using the smartwatch.
Algorithm
Average Accuracy (%)
Phone & Watch
Average Accuracy (%)
Phone Only
SVM (Linear) 84.6 74.8
SVM (Polynomial) 87.9 81.1
Decision Tree 86.3 78.4
Naive Bayes 89.4 82.1
LDA 87.9 82.7
QDA 89.1 85.6
KNN (K = 6) 89.3 85.4
WKNN (K = 5) 89.3 85.4
The highest average accuracy (82.1%) is achieved
by using naive Bayes, where the individual LOPOCV
accuracies are 75.7%, 81.3%, 82.8%, 85.1%, and
85.5% for each dataset respectively. Comparing these
dataset accuracies with the ones obtained using naive
Bayes from the first evaluation, it is clear that the
adding the watch to the recognition system improves
the accuracy with at least six percentage point.
6 CONCLUSION
In this paper, a platform to combine sensors of smart-
phones and smartwatches to classify various human
activities was proposed. It recognizes activities in
real-time Moreover, this approach is light-weight,
computationally inexpensive, and able to run on hand-
held devices.
The results showed that there is no clear winner,
ICAART 2016 - 8th International Conference on Agents and Artificial Intelligence
492

but naive Bayes performs best in our experiment in
both the classification accuracy and efficiency. The
overall accuracy lies between 84.6% and 89.4%, at
which the differences are negligible. Thus, this plat-
form is able to recognize various human activities.
However, all of the tested classifiers confused walk-
ing and using the stairs activities.
The second conclusion is that adding the smart-
watch’s sensor data to the recognition system im-
proves it’s accuracy with at least six percentage point.
Finally, it is computations that the best sampling
frequency is in the field of 10 Hz.
Some questions still require to be answered. Most
important is the conducting of larger experiments
with more people in order to perform more robust
evaluation to clearify if indeed one method is better
than the other, or whether, any off-the-shelf method
can do well in this classification task. This work
could be furhter extended by incorporating more sen-
sors (e.g. heart rate sensor), recognizing high-level
activities (e.g. shopping or eating dinner) or extrapo-
lating these trained classifiers to other people.
ACKNOWLEDGEMENTS
This work was sponsored by Federal Ministry of Ed-
ucation and Research (grant 01IS12050).
REFERENCES
Banos, O., Galvez, J.-M., Damas, M., Pomares, H., and Ro-
jas, I. (2014). Window size impact in human activity
recognition. Sensors, 14(4):6474–6499.
Bao, L. and Intille, S. S. (2004). Activity recognition from
user-annotated acceleration data. In Pervasive com-
puting, pages 1–17. Springer.
Bauman, A., Phongsavan, P., Schoeppe, S., and Owen, N.
(2006). Physical activity measurement-a primer for
health promotion. Promotion & Education, 13(2):92–
103.
Bayat, A., Pomplun, M., and Tran, D. A. (2014). A study
on human activity recognition using accelerometer
data from smartphones. Procedia Computer Science,
34:450–457.
Brezmes, T., Gorricho, J.-L., and Cotrina, J. (2009). Ac-
tivity recognition from accelerometer data on a mo-
bile phone. In Distributed computing, artificial intel-
ligence, bioinformatics, soft computing, and ambient
assisted living, pages 796–799. Springer.
da Costa Cachucho, R. E. G., Moreira, J. M., and Gama, J.
(2011). Activity recognition using, smartphone based,
accelerometer sensors.
Gyllensten, I. C. (2010). Physical activity recognition in
daily life using a triaxial accelerometer. PhD thesis,
KTH Royal Institute of Technology.
Krishnan, N. C., Colbry, D., Juillard, C., and Panchanathan,
S. (2008). Real time human activity recognition us-
ing tri-axial accelerometers. In Sensors, signals and
information processing workshop.
Lee, M. (2009). Physical activity recognition using a single
tri-axis accelerometer. In Proceedings of the world
congress on engineering and computer science, vol-
ume 1.
Lester, J., Choudhury, T., and Borriello, G. (2006). A prac-
tical approach to recognizing physical activities. In
Pervasive Computing, pages 1–16. Springer.
Long, X., Yin, B., and Aarts, R. M. (2009). Single-
accelerometer-based daily physical activity classifica-
tion. In Engineering in Medicine and Biology Society,
2009. EMBC 2009. Annual International Conference
of the IEEE, pages 6107–6110. IEEE.
Parkka, J., Ermes, M., Korpipaa, P., Mantyjarvi, J., Peltola,
J., and Korhonen, I. (2006). Activity classification
using realistic data from wearable sensors. Informa-
tion Technology in Biomedicine, IEEE Transactions
on, 10(1):119–128.
Preece, S. J., Goulermas, J. Y., Kenney, L. P., Howard, D.,
Meijer, K., and Crompton, R. (2009). Activity iden-
tification using body-mounted sensors - a review of
classification techniques. Physiological measurement.
Ravi, N., Dandekar, N., Mysore, P., and Littman, M. L.
(2005). Activity recognition from accelerometer data.
In AAAI, volume 5, pages 1541–1546.
Sharma, A., Purwar, A., Lee, Y.-D., Lee, Y.-S., and Chung,
W.-Y. (2008). Frequency based classification of activ-
ities using accelerometer data. In Multisensor Fusion
and Integration for Intelligent Systems, 2008. MFI
2008. IEEE International Conference on, pages 150–
153. IEEE.
Shoaib, M., Scholten, H., and Havinga, P. J. (2013). To-
wards physical activity recognition using smartphone
sensors. In Ubiquitous Intelligence and Computing,
2013 IEEE 10th International Conference on and 10th
International Conference on Autonomic and Trusted
Computing (UIC/ATC), pages 80–87. IEEE.
Subramanya, A., Raj, A., Bilmes, J. A., and Fox, D. (2012).
Recognizing activities and spatial context using wear-
able sensors. arXiv preprint arXiv:1206.6869.
Telgarsky, R. (2013). Dominant frequency extraction. arXiv
preprint arXiv:1306.0103.
Thiemjarus, S. (2010). A device-orientation independent
method for activity recognition. In Body Sensor
Networks (BSN), 2010 International Conference on,
pages 19–23. IEEE.
Yang, J. (2009). Toward physical activity diary: motion
recognition using simple acceleration features with
mobile phones. In Proceedings of the 1st interna-
tional workshop on Interactive multimedia for con-
sumer electronics, pages 1–10. ACM.
Human Activity Recognition - Using Sensor Data of Smartphones and Smartwatches
493
