
Radiation Exposure Analysis in 3D Cancer Treatment
Dmitriy Dubovitskiy and Valeri Kouznetsov
Oxford Recognition Ltd, Cambridge, U.K.
Keywords:
Cancer Treatment, In Vivo Dosimetry, Radiation Sensors, Pattern Analysis, Decision Making, Object
Recognition, Image Morphology, Computational Geometry.
Abstract:
Dosimetry in the process of treatment of cancer tumour by ionising radiation. It is important and sometimes
very challenging due to the fact that it is necessary to measure the radiation dose in vivo on small areas on the
surface of the composite relief. Recently, in order to reduce the radiation dose to healthy tissues and concen-
tration of the therapeutic effect of radiation directly on the tumour application method of three-dimensional
(3D) irradiation started, in which radiation beams enter the body from different directions concentrating on
the tumour. New methods of treatment correspondingly require more precise and sophisticated methods of
dosimetry. Existing methods of 3D dose measurement are highly labor-intensive and generally suffer from
low accuracy. In this paper, we propose the technical method of 3D measurement of the dose in real-time and
approaches to build volume model of the dose distribution inside the patient’s body using object recognition
technique.
1 INTRODUCTION
For dosimetry of small areas in radiotherapy, common
equipment used includes traditional micro ionisation
chambers, semiconductor diode dosimeters, and in-
creasingly in recent years the very useful MOSFET
transistors. MOSFET transistors provide good accu-
racy and repeatability of results with dimensions of
a few millimetres. In addition they are joined har-
moniously with scanning and information process-
ing systems (Soubra, M., Cygler, J. and Mackay,
G.F.),(Thomson I., Reece M.H.). For 3D dosime-
try, Gel Dosimeters (first proposed in the mid 80s)
are the most widely used tools (Yves De Deene, An-
drew Jirasek). These are models to replace the human
body during irradiation (referred to as ’phantoms’ by
radiologists), composed of a gel-like material which
changes its optical properties under the influence of
ionising irradiation. Once irradiated, optical scanning
reveals radiation focus through altered transparency
of the gel. This method it allows the technician to
customise parameters and 3D geometry of irradia-
tion. However, due to the requirement of fabricat-
ing custom ’phantoms’ for each use, gel dosimeters
are very costly, time consuming, and inconvenient,
while providing only moderately precise targeting and
dosage information. (Yves De Deene, Andrew Ji-
rasek). There are also methods of extrapolating 2D
measurements to 3D models. The most modern meth-
ods (Karthikeyan Nithiyanantham, Ganesh K. Mani,
Vikraman Subramani, Lutz Mueller, Karrthick K.
Palaniappan, Tejinder Kataria) of measurement sug-
gest to use of linear array diodes with 98 measure-
ment points for scanning space inside ’water phan-
tom’ (essentially an aquarium of water which closely
approximate the radiation absorption and scattering of
the muscle and other parts of human body). The data
is then linked to the patient CT image and the Monte
Carlo method used to extrapolate dose distributions
inside the patient’s body. Measurements are con-
trolled during irradiation by single point dosimiters
(diodes), which allows monitoring and adjustment of
treatment in vivo.
Impact of ionising irradiation at different MOS
(metal oxide semiconductor) structure have been
studied for quite a long time, at least since the mid 70-
s due to the start using of electronics based on MOS
technology in space systems (Ma T. P., Dressendorfer
P. V.). The processes occurring in such structures un-
der the influence of various types and intensity of ra-
diation is very well studied and described in numerous
articles associated with radiation hardness of MOS
IS (Kohler, Ross A., Kushner, R.A.),(S. Kaschieva),
(Claeys, C.,Simoen, Eddy), (G Meurant). For the pur-
poses of measuring the accumulated radiation dose in
medicine, such a structure, is still relatively new and
as an indication of the accumulated dose is used the
102
Dubovitskiy, D. and Kouznetsov, V.
Radiation Exposure Analysis in 3D Cancer Treatment.
DOI: 10.5220/0005818401020107
In Proceedings of the 9th International Joint Conference on Biomedical Engineering Systems and Technologies (BIOSTEC 2016) - Volume 1: BIODEVICES, pages 102-107
ISBN: 978-989-758-170-0
Copyright
c
2016 by SCITEPRESS – Science and Technology Publications, Lda. All rights reserved
effect of degradation of MOS structure, particularly
the under-gate dielectric (SiO2). Without going deep
into the details of physical processes, we mention
only the main effect that is used for dosimetry. Un-
der irradiation, gate dielectric accumulates a positive
charge which leads for example to the shift of thresh-
old voltage in a MOSFET transistor or to the shift
volt-farad characteristics of the MOS capacitor. If ap-
ply a positive voltage to the Gate of transistor (MOS
capacitor) in the process of irradiation, the amount
of accumulated charge increases. In the case if no
voltage was applied, it makes possible to irradiate the
passive MOS structure, and then measure the charge
that is equivalent to the dose. Other effects occurring
in the dielectric during irradiation can be ignored in
this case. In the range of doses used in medicine, the
charge accumulation is linear and proportional to the
dose and only at high doses about 6-8 Gy (depends
on technology of production) tends to saturation and
loses linearity. In addition to all of this characteris-
tics, dosimeters on MOS structures are small in size
(around 1 sq. mm ) and very simple in production.
The particular concern of this paper is the use of
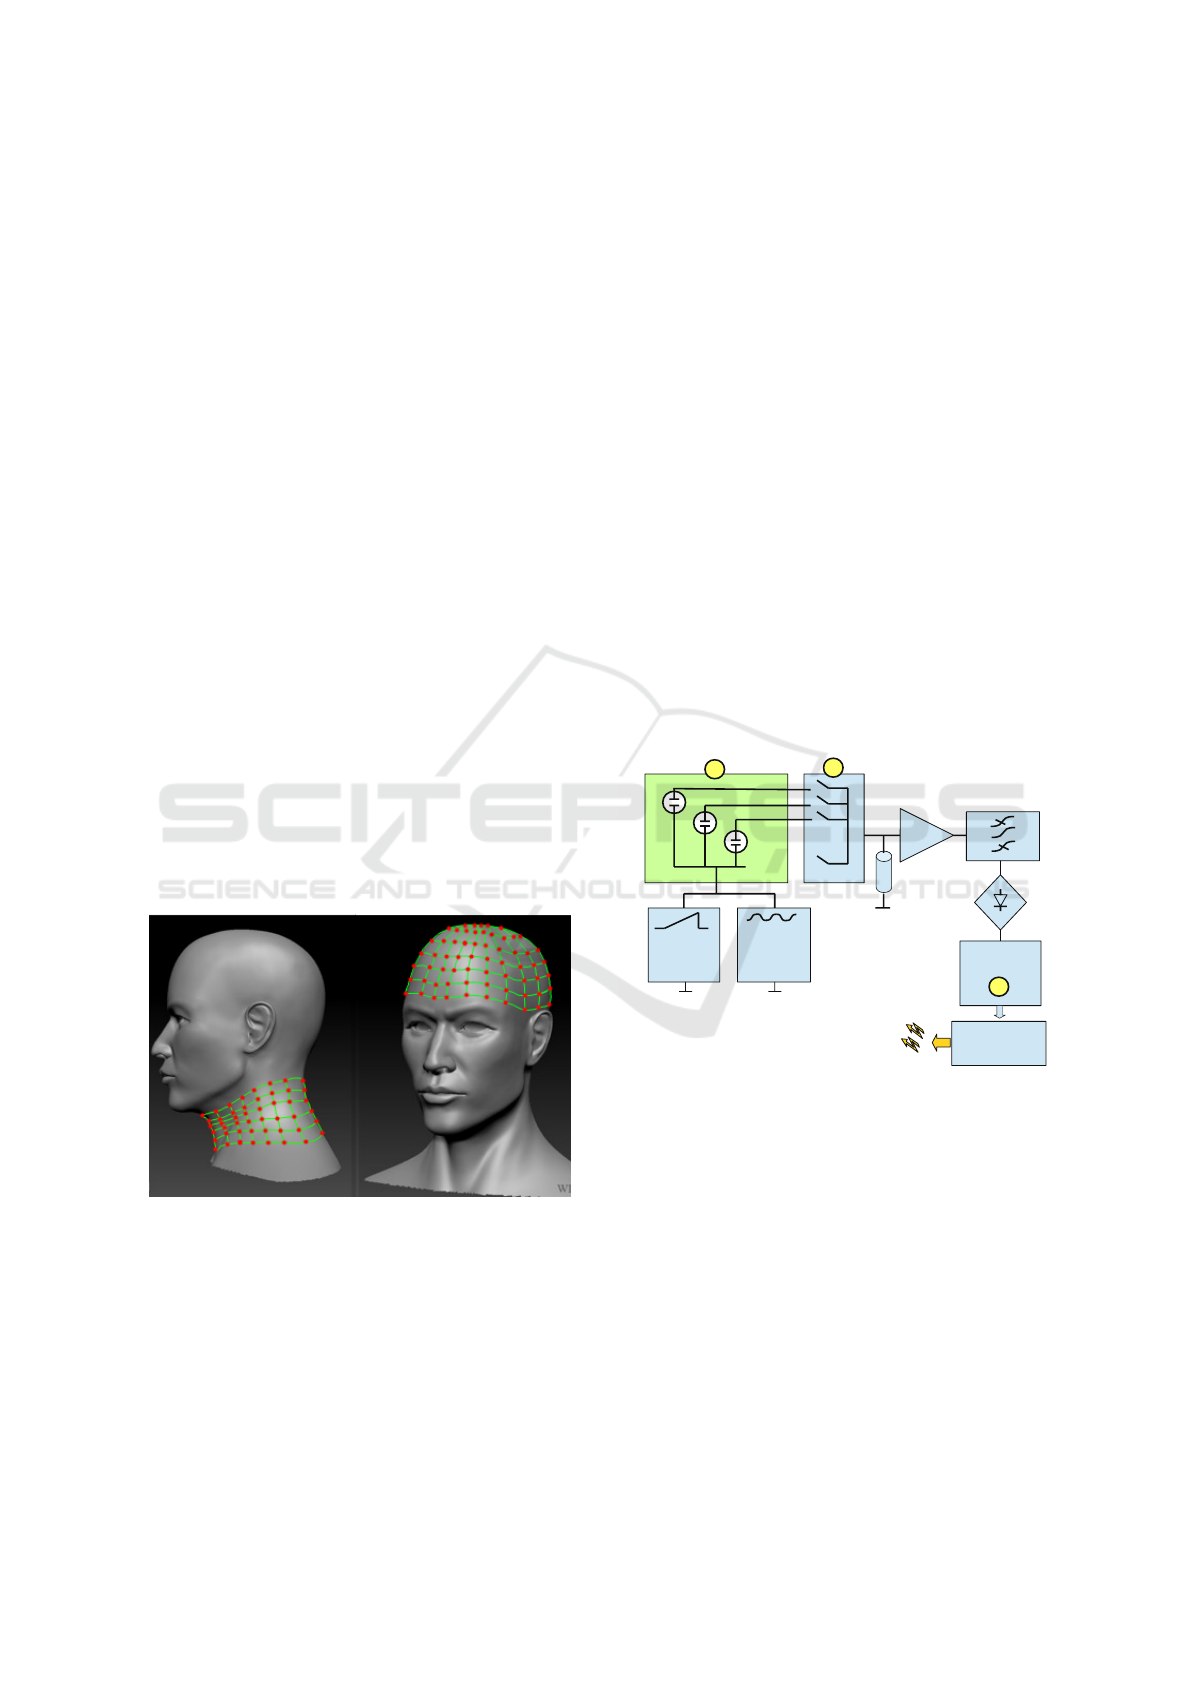
such sensors for creation of net bandage dosimetry
system Figure 1, with a MOS capacitor sensor in ev-
ery node of the grid. Such dosimetry net can be placed
(dressed) around any part of the body (or fantom) and
will allow to control the dose of radiation for the in-
coming and outgoing flow of irradiation and from any
side. This will allow to build a 3D model of the ab-
sorbed dose inside the patient’s body.
Figure 1: Net bandage.
2 STRUCTURAL SCHEME OF
DOSIMETRY SYSTEM
The proposed dosimetric net, can be a convenient and
inexpensive tool to verify the dose distribution inside
the body as well as building three-dimensional mod-
els of absorbed dose. Since the MOSFET was well
proven recently (A. Sathish Kumar, S. D. Sharma, and
B. Paul Ravindran),(A. Gopidaj, Ramesh S. Billima
GGA, Velayudham Ramasubramanian), (Bo-Young
Choe), (Briere TM, et al.), (Scalchi P, Francescon
P, Rajaguru P) as an in vivo dosimeter for absorbed
dose, we have decided to focus our attention to even
more simple structures such as the MOS capacitors
since the effects of charge accumulation in under-gate
dielectric of MOSFET (in fact under-gate MOS ca-
pacitor) determines its ability to function as a dosime-
ter. MOS sensors in our case have a number of ben-
efits, MOS capacitors are extremely simple and inex-
pensive in production, we can select and vary any of
the parameters of this structure (thickness and type of
gate dielectric, the area of the structure) to improve its
operation as a dosimeter, because it’s a capacitor and
in this structure there is no need to consider the pa-
rameters necessary for the operation of the transistor.
The scheme of measurement of accumulated charge
which corresponds to the absorbed dose requires less
number of contacts (only 2 and one of them is com-
mon for all sensors) that facilitates the creation of ma-
trix or grid with a large number of sensors.
SWEEP
ADC
.....
.
.
.
.
.
N
N
MOS
MOS
2
1
2
R
n
3
G
G
1 2
sin
TEST SIGNAL
FILTER
DATA
TRANSMIT
UNIT
AMPLIFIER
WIRLESS
CONNECTION
U
R
Figure 2: The measuring system for collecting data from
sensors. 1- matrix of sensors, 2-multiplexer, 3-analog to
digital converter.
The block diagram of such a system is shown in
Figure 2. The accumulated charge in the oxide (equiv-
alent dose) offered to determine by measuring voltage
- farad characteristics. This method has long been
known as a main and classical method for measure-
ment of MOS structures properties (S. M. Sze), (E.
H. Nicollian, J. R. Brews), (Jay N. Zemel) and well
tested. A typical view of this characteristic for the
silicon substrate n-type is shown on the Figure 3.
The figure shows the shift of C-V characteristics
which occurs in the case of accumulating charge in
the gate oxide, the measurement of this shift is our
Radiation Exposure Analysis in 3D Cancer Treatment
103
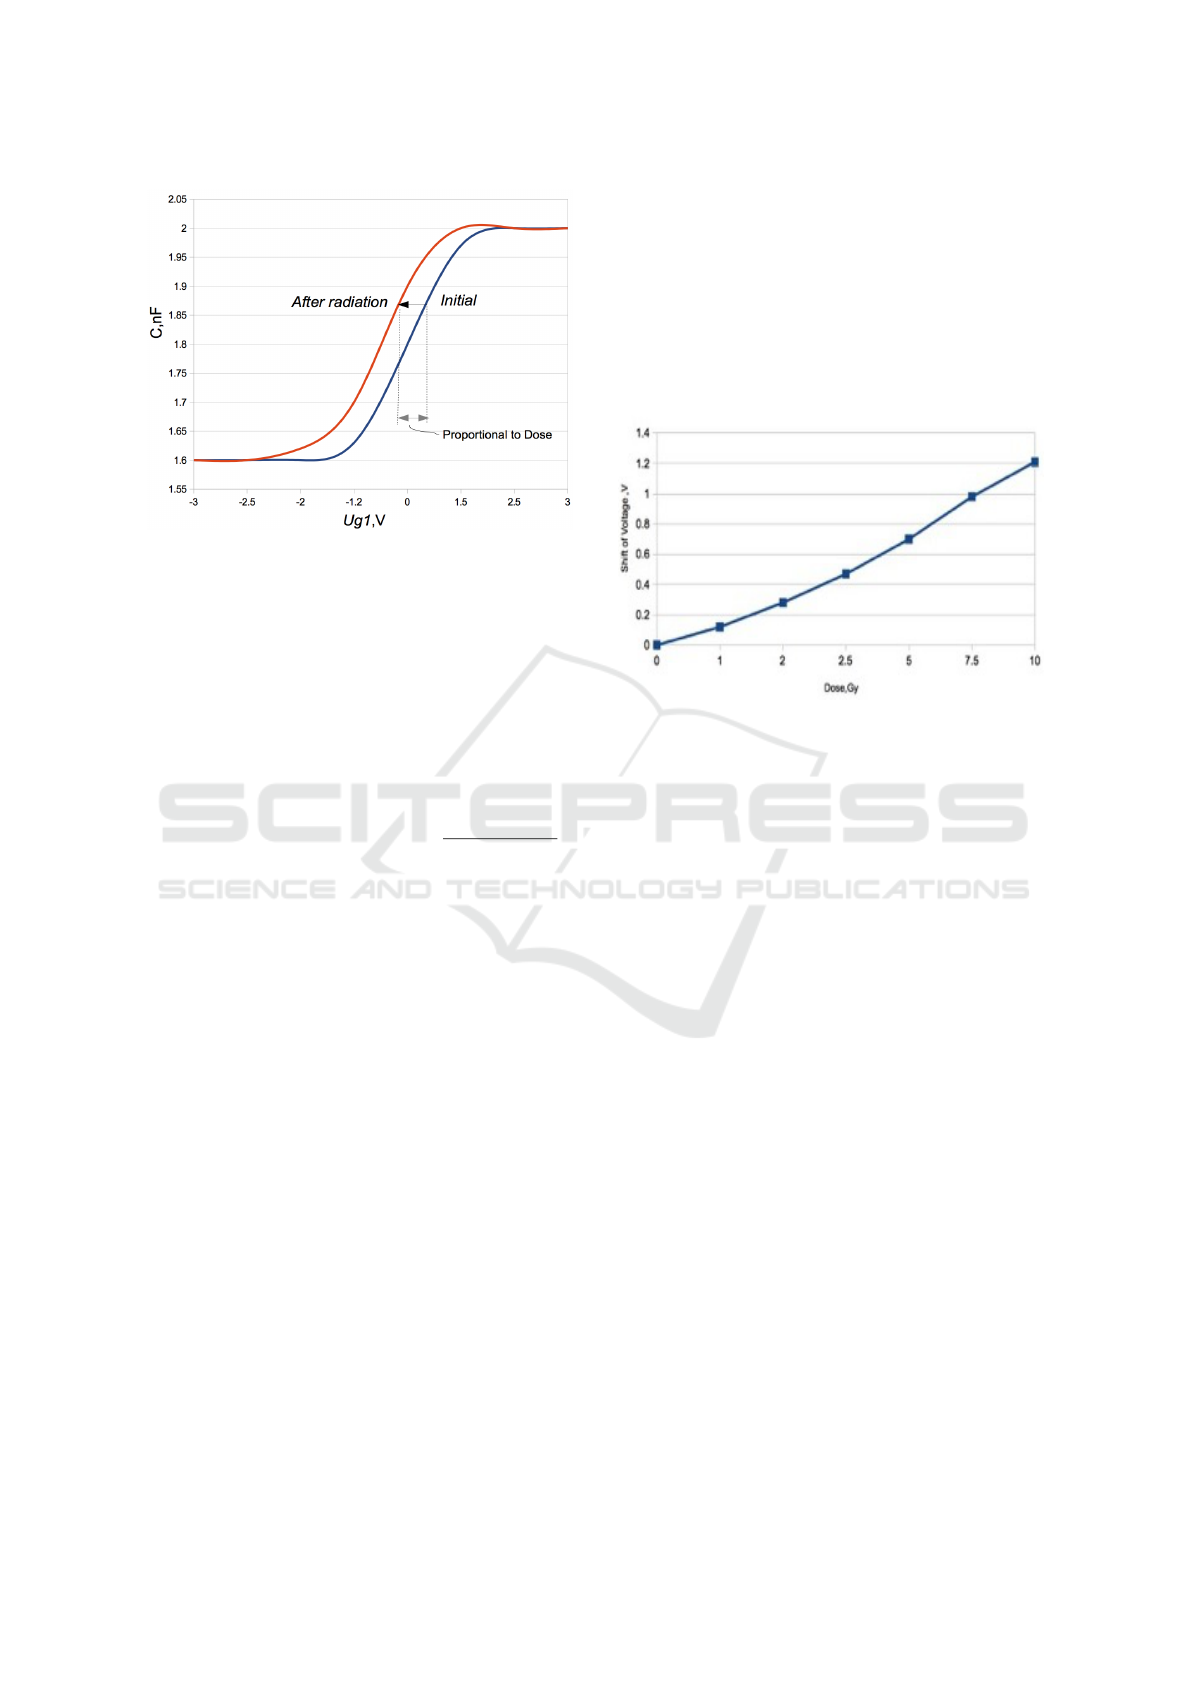
Figure 3: Volt-Farad characteristic of typical MOS conden-
sator.
task in this case. Capacitive Sensors - dosimeters are
connected in matrix (1). The reading of the sensors
parameters is carried out consistently, analog mul-
tiplexer (2) switches from one structure to another.
Sweep generator G1 provides a slow shift in a range
of of a few volts on MOS and G2 provides a test sig-
nal with a frequency of 1 MHz and amplitude 10 mV.
The amplitude of the alternate voltage on resistor Rn
will be proportional to the capacity of MOS sensor, as
can be seen from the formulas below.
Rc = 1/wC, i = Ug
2
/Z = Ug
2
/
q
Rn
2
+ 1/w
2
C
2
i f R
c
= 1/wC >> R
n
, then i ≈ wC(Ug
1
)Ug
2
U
R
= iR
n
= U g
2
R
n
wC (Ug
1
) where w = 2π f
The measurement process for each sensor will
take approximately no more than 5-10 ms. It means
that the matrix of sensor with dimension 256 sensors
will be read out in 1.5 - 2.5 seconds. These data are
digitised by ADC (3) and sent to computer wirelessly,
where data can be already processed further. The ad-
vantages of MOS as a absorbed dose dosimeters is
also the fact that they kept the charge is quite stable
and readings can be taken long time after exposure.
When a MOS capacitors is irradiated, positive
charge trapped in the gate oxide (Hughes H. L.,
Benedetto J. M.), (Oldham T. R., McLean F. B. ),
(Adams J. R., Daves W. R., Sanders T. J.), it leads
to shift of volt-farad characteristics, see Figure 3. The
magnitude of the shift depends on the absorbed dose
and is approximately 200 mV in the absence of gate
voltage during irradiation. By applying a positive
voltage on the gate , we can increase the sensitivity
and shift can reach 400-500 mV per Gy.
To confirm behaviour of MOS structures under ra-
diation by standard medical equipment the most com-
mon samples were taken, the gate oxide SiO2 was
grown in a dry environment at 1000C, thickness of
oxide was 0.6 micrometres on Si wafer 4.5 Om /cm
conductivity of n-type with F(fluorine) doping. Size
of crystal was 1x1mm. Irradiation was carried out at
Photon clinical linear accelerator 6MeV (Varian 2100
EX), doses were 0 to 10 Gy, at room temperature. As
a control dosimeter, ionisation chamber ROOS was
used. Results of the experiment are shown on Fig-
ure 4.
Figure 4: Characteristic of volt shift for the silicon substrate
n-typer.
In our case we are going to use a successfully
tested system of pattern recognition and bind our
system of sensors on the skin of the patient. The
image recognition system was used for skin cancer
diagnostic and has been published in (Dubovitskiy
and Blackledge, 2008), (Dubovitskiy and Blackledge,
2009), (Dubovitskiy and Blackledge, 2008) (Dubovit-
skiy and McBride, 2013), (Dubovitskiy D, Devyatkov
V and Richer G ) and (Dubovitskiy and Blackledge,
2008) this redundant system was working well and we
expect it to be extremely effective.
3 SKIN PATTERN POSITIONING
SYSTEM
The current medical practice includes several radia-
tion exposure during the course of treatment with a
number of days in between. The position of the net
bandage on the patient’s skin is very important to al-
low consistency for the next treatment of the same
tumour. In order to address this, data from the CT
scan could be used to adjust position for the next treat-
ment. Computation of position is implemented by us-
ing Fractal Geometry theory to get the precise pattern
of the skin. The precise pattern of the skin is corre-
sponded to the calibration points on the net bandage.
The real time computation system will allow a doc-
tor to dynamically move the bandage and see the off-
BIODEVICES 2016 - 9th International Conference on Biomedical Electronics and Devices
104
set from the last treatment position. When offset ap-
proaches zero, the exact same position of the radiation
sensors will be reached.
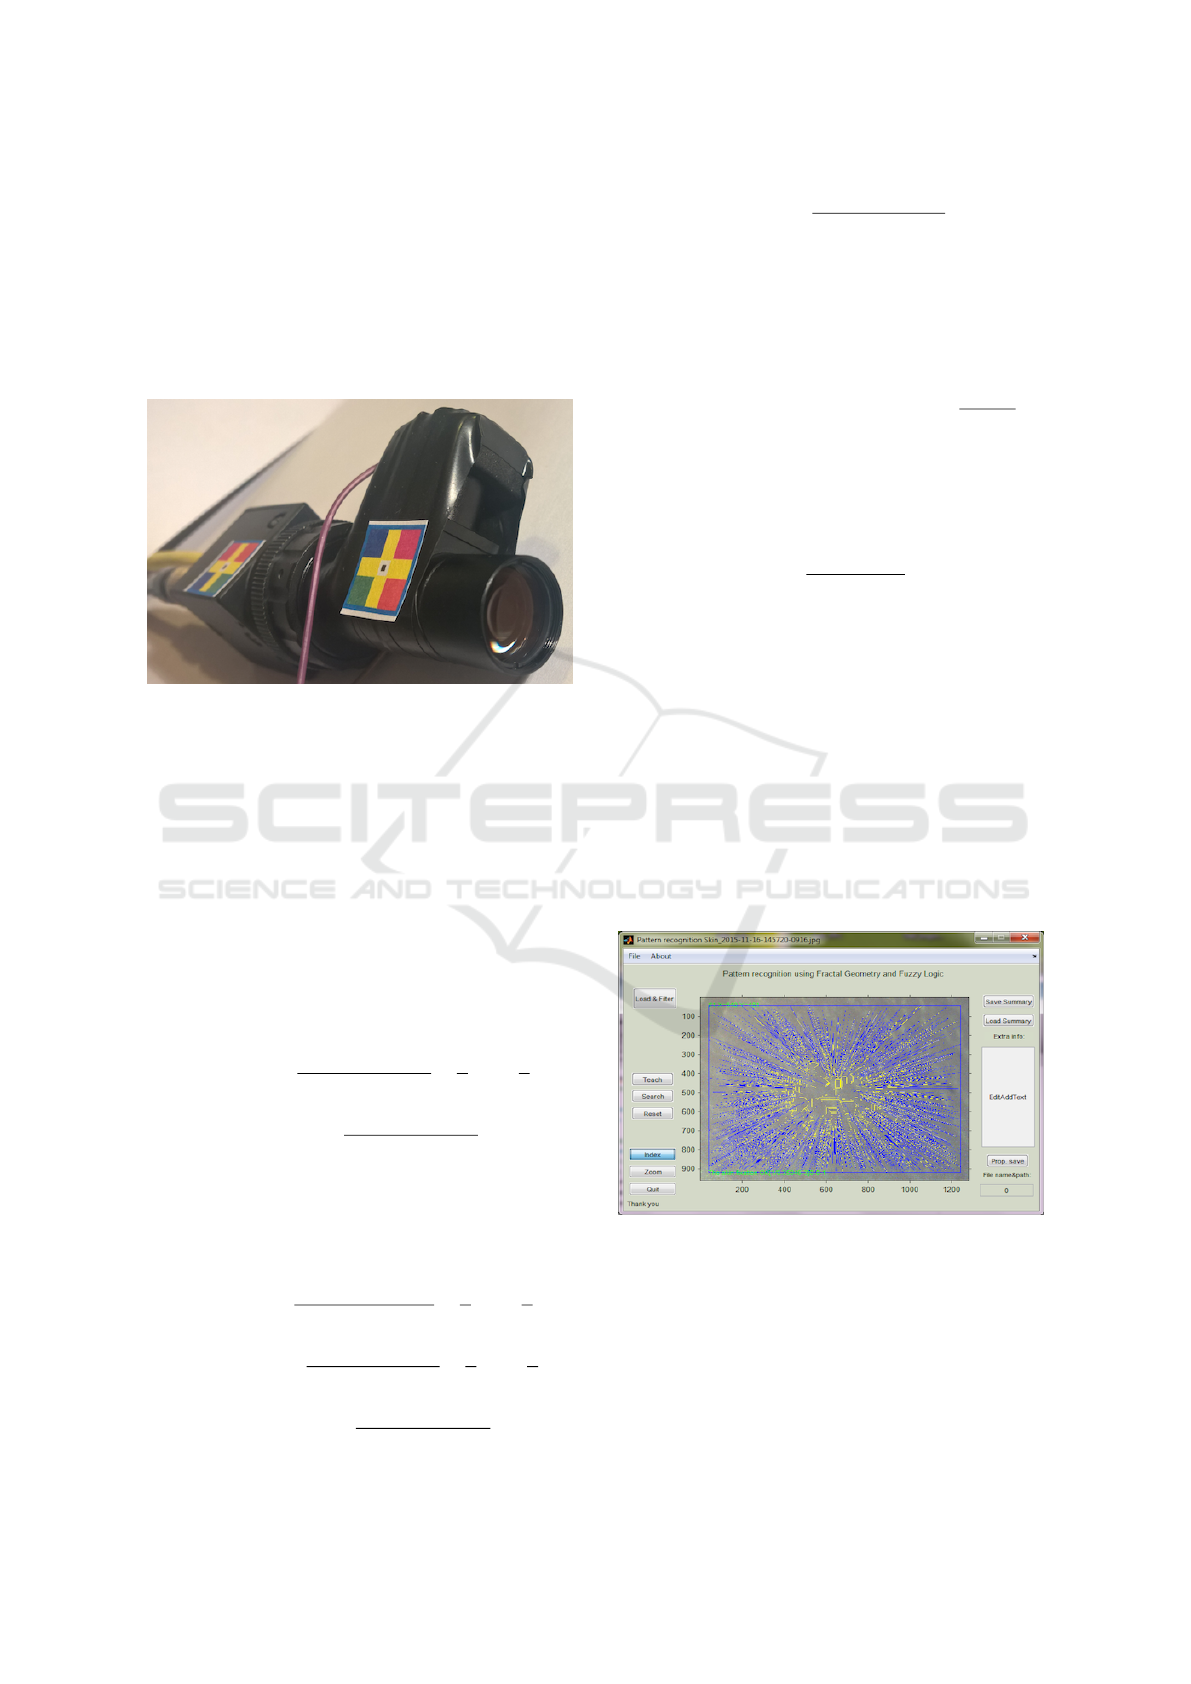
The skin has texture and a particular skin region
could be characterised by Fractal features called Frac-
tal parameters. An image of a skin sample has been
taken by a specially designed dermatological image
acquisition camera on Figure 5.
Figure 5: Dermatological image acquisition camera.
The correspondent points are calculated from
Fractal parameters. If we consider the profile of a
typical skin image, then the curve does not coincide
with a sin-wave signal. To obtain adequate accuracy,
it is necessary to magnify the resolution of the image,
which in turn introduces distortion. For increased ac-
curacy on low-resolution data, we consider a convolu-
tion function of a form more consistent with the pro-
file of a video signal. For a signal I we consider the
representation
F (k) =
N
∑
n=1
I (n)
arccos
cos
2π(k − 1)(n − 1)
N
−
π
2
−
π
2
−iarcsin
cos
2π(k − 1)(n − 1)
N
and for an image I with resolution m ×n,
F (p, q) =
M
∑
m=1
N
∑
n=1
I (m,n) (1)
arccos
cos
2π(p − 1)(m − 1)
M
−
π
2
−
π
2
×
arccos
cos
2π(k − 1)(n − 1)
N
−
π
2
−
π
2
−iarcsin
arccos
2π(k − 1)(p − 1)
M
×arcsin
cos
2π(k − 1)(n − 1)
N
(2)
In this work, application of the power spectrum
method used to compute the fractal dimensions of a
skin surface is based on the above representations for
F (k) and F (p,q) respectively. We then consider the
power spectrum of an ideal fractal signal given by
P = c|k|
−β
, where c is a constant and β is the spectral
exponent. In two dimensions, the power spectrum is
given by P(k
x
,k
y
) = c|k|
−β
, where
|
k
|
=
q
k
2
x
+ k
2
y
. In
both cases, application of the least squares method or
Orthogonal Linear Regression yields a solution for β
and c, the relationship between β and the Fractal Di-
mension D
F
being given by
D
F
=
3D
T
+ 2 − β
2
for Topological Dimension D
T
. This approach allows
us to drop the limits on the recognition of small ob-
jects since application of the FFT (for computing the
power spectrum) works well (in terms of computa-
tional accuracy) only for large data sets, i.e. array
sizes larger than 256 and 256×256. Tests on the accu-
racy associated with computing the fractal dimension
using equations (1) and (2) show an improvement of
5% over computations based on conventional Discrete
Fourier Transform.
The setup calculates Fractal features dynamically
from the centre of an image. The testing GUI software
is presented on Figure 6:
Figure 6: GUI software.
The original skin image from the camera is pre-
sented on Figure 7.
The current position of the net bandage and cam-
era is given from optical calibration marks Figure 8.
The corespondent points of the current Fractal
marks and optical position gives us the offset num-
ber which guide the doctor to the original position of
the sensor net bandage.
Radiation Exposure Analysis in 3D Cancer Treatment
105
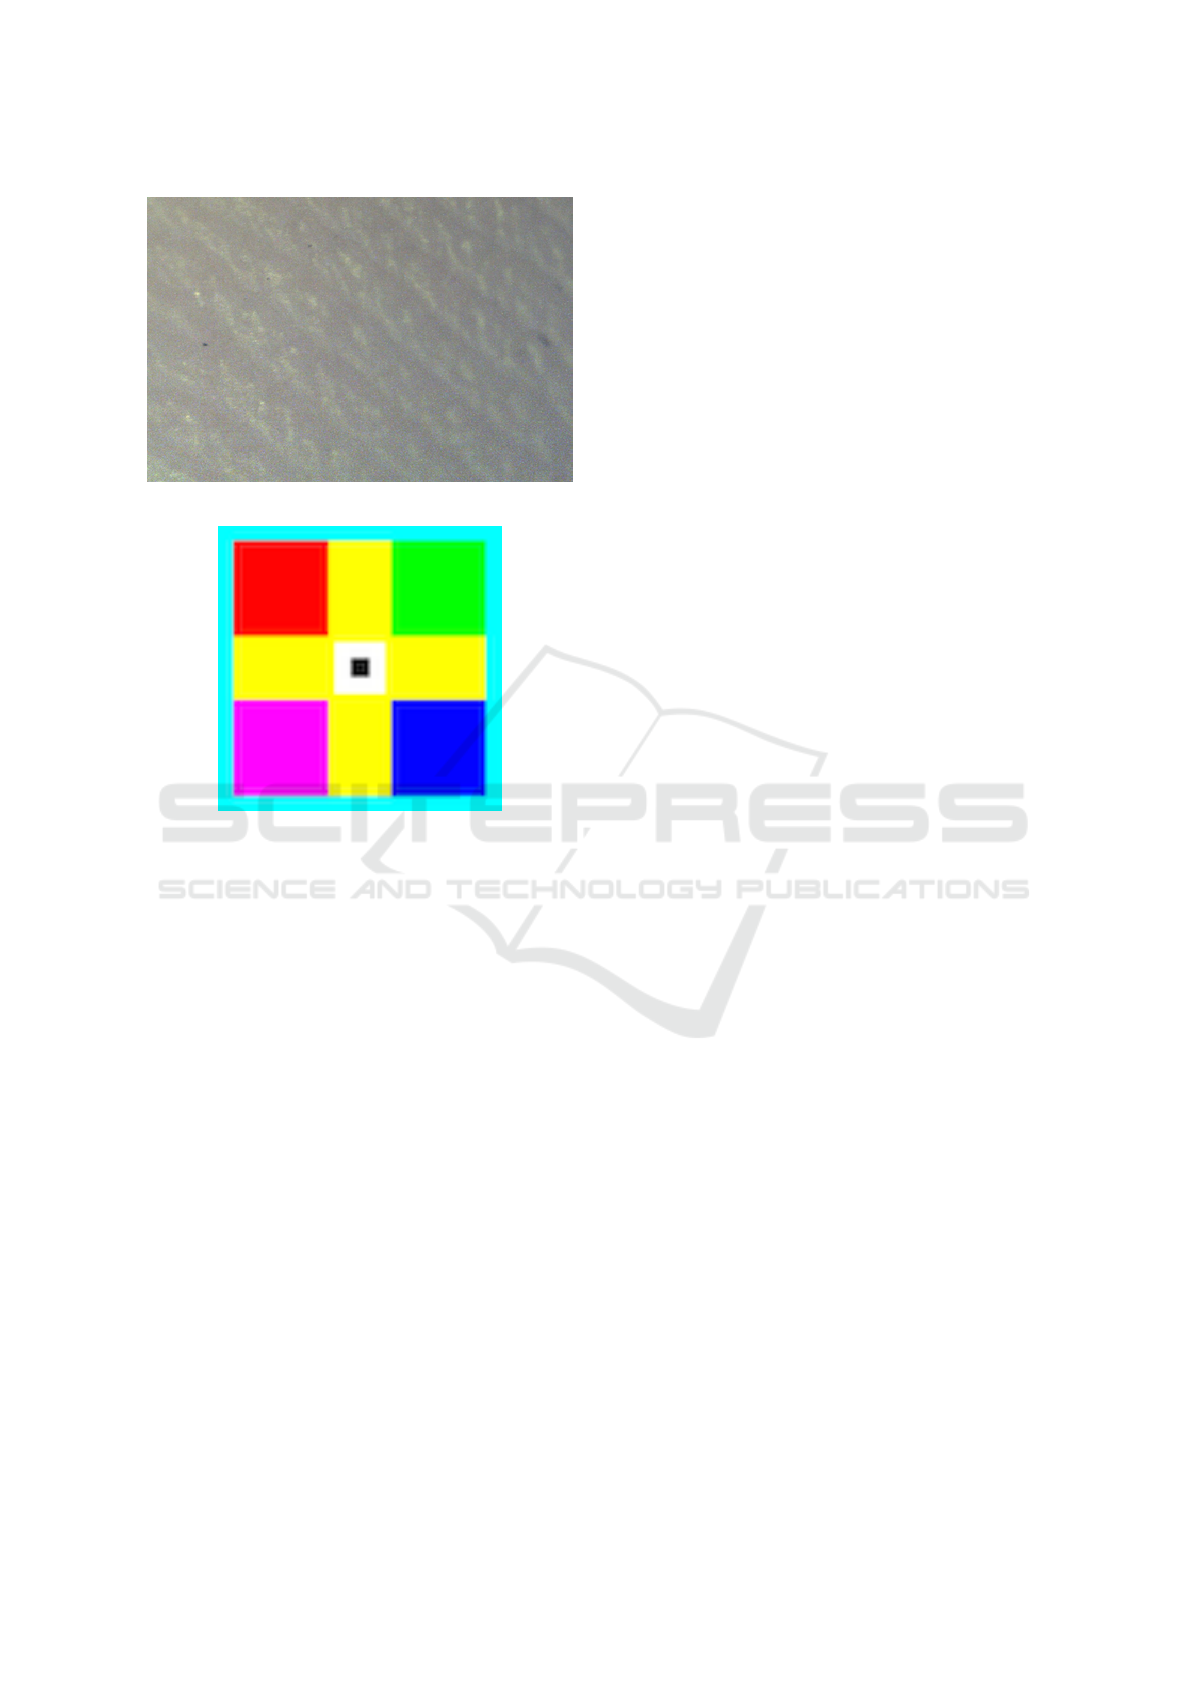
Figure 7: The original skin image.
Figure 8: The optical calibration mark.
4 CONCLUSIONS
The focus of this paper is creation of the simple and
convenient system which allows to control the spatial
distribution of the accumulated dose inside body. The
use of modern image recognition technique allows us
to position the sensor net bandage in exact position
like it has been used. The measurement of input beam
radiation and output radiation (after passing the tis-
sue) gives us unique possibilities to provide more ac-
curate results. The calculation of exact accumulation
dose and its confirmation by correct measurements is
the key to the right healing. Simple and reliable sys-
tem monitoring of 3D dose distribution will allow to
provide treatment in the safest way. The safe way
means that the healthy cells will not be the subject
of unnecessary exposure (as much as possible) and
will be be able maintain healthier life support. This
work represents the new approach to accurate radia-
tion exposure treatments. Industrial implementation
will require further experiments and technological in-
put in order to calibrate, coordinate and synchronise
use of this technology in a clinical setting. However,
we hope that our work will lay a foundation for the
next step in safe cancer treatment, ultimately prolong-
ing and improving the lives of many people.
ACKNOWLEDGEMENT
The work reported in this paper is supported by the
Oxford Recognition Ltd. The authors are grateful to
Robert Vyn for his help in the preparation of this pa-
per.
REFERENCES
Soubra, M., Cygler, J. and Mackay, G.F. (1984). Evaluation
of a Dual Metal Oxide-Silicon Semiconductor Field
Effect Transistor Detector as a Radiation Dosimeter.
Med. Phys. , 21 (4) April.
Thomson I., Reece M.H. (1988). Semiconductor MOSFET
Dosimetry. Proceedings of Health Physics Society
Annual Meeting.
Yves De Deene, Andrew Jirasek (2008). Uncertainty in 3D
gel dosimetry, 8th International Conference on 3D Ra-
diation Dosimetry (IC3DDose). Journal of Physics:
Conference Series 573 (2015) 01.
Karthikeyan Nithiyanantham, Ganesh K. Mani, Vikraman
Subramani, Lutz Mueller, Karrthick K. Palaniappan,
Tejinder Kataria (2015). Analysis of direct clinical
consequences of MLC positional errors in volumetric-
modulated arc therapy using 3D dosimetry system.
Journal of Applied Clinical Medical Physics Vol 16
No 5.
Ma T. P., Dressendorfer P. V. (1989). Ionizing radiation
effects in MOS devices and circuits. New York: Wiley
Interscience.
Kohler, Ross A., Kushner, R.A., (1988). Total dose radi-
ation hardness of MOS devices in hermetic ceramic
packages. Nuclear Science, IEEE Transactions on
(Volume:35 ,Issue: 6) .
S. Kaschieva (1994). Improving the radiation hardness of
MOS structures. International Journal of Electronics
Volume 76,Issue 5.
Claeys, C.,Simoen, Eddy (2002). Radiation Effects
in Advanced Semiconductor Materials and Devices.
Springer Science and Business Media, Aug 21.
G Meurant (1999). New Insulators Devices and Ra-
diation Effects. 1st Edition, Print book ISBN
9780444818010, Holland.
A. Sathish Kumar, S. D. Sharma, and B. Paul Ravindran
(2014). Characteristics of mobile MOSFET dosimetry
system for megavoltage photon beams. J Med Phys.
Jul-Sep; 39(3): 142?149.
A. Gopidaj, Ramesh S. Billima GGA, Velayudham Rama-
subramanian (2008). Performance characteristics and
commissioning of MOSFET as an in-vivo dosimeter
for high energy photon external beam radiation ther-
apy. Reports of Practical Oncology and Radiotherapy,
Volume 13, Issue 3, Pages 114-125.
BIODEVICES 2016 - 9th International Conference on Biomedical Electronics and Devices
106

Bo-Young Choe (2013). Dosimetric Characteristics of
Standard and Micro MOSFET Dosimeters as In-vivo
Dosimeter for Clinical Electron Beam. Journal- Ko-
rean Physical Society., 03/2013; 55:2566-2570.
Briere TM, et al. (2005). In vivo dosimetry using disposable
MOSFET dosimeters for total body irradiation. Med
Phys, 32:1996.
Scalchi P, Francescon P, Rajaguru P (2005). Characterisa-
tion of a new MOSFET detector configuration for in
vivo skin dosimetry. Med Phys, 32(6):1571?8.
S. M. Sze (1981). Physics of Semiconductor Devices. Wil-
ley, New York, 2nd ed.
E. H. Nicollian, J. R. Brews (1982). MOS (metal oxide
semiconductor) physics and technology. Wiley, New
York.
Jay N. Zemel (1979). Nondestructive Evaluation of Semi-
conductor Materials and Devices. Nato Science Series
B, ISSN: 0258-1221.
Hughes H. L., Benedetto J. M. (2003). Radiation effects
and hardening of MOS technology devices and cir-
cuits. IEEE Trans. on Nuclear Science.
Oldham T. R., McLean F. B. (2003). Total ionizing dose
effects in MOS oxides and devices. IEEE Trans. on
Nuclear Science Vol. 50.
Adams J. R., Daves W. R., Sanders T. J. (1977). A radiation
hardened field oxide. IEEE Trans. on Nuclear Science.
Vol. NS-24, N 6.
E.R.Davies (1997). Machine Vision: Theory, Algorithms,
Practicalities. Academic press, London.
Dubovitskiy, D. A. and Blackledge, J. M. (2008). Sur-
face inspection using a computer vision system that
includes fractal analysis. ISAST Transaction on Elec-
tronics and Signal Processing, 2(3):76–89.
Dubovitskiy, D. A. and Blackledge, J. M. (2009). Texture
classification using fractal geometry for the diagnosis
of skin cancers. EG UK Theory and Practice of Com-
puter Graphics 2009, pages 41– 48.
Dubovitskiy D., Devyatkov V. and Richer G. (2014). The
Application of Mobile Devices for the Recognition
of Malignant Melanoma. BIODEVICES 2014: Pro-
ceedings of the International Conference on Biomedi-
cal Electronics and Devices, Angers, ISBN: 978-989-
758-013-0, Page 140, France 03 ? 06 March.
Dubovitskiy, D. A. and Blackledge, J. M. (2011). Moletest:
A Web-based Skin Cancer Screening System. The
Third International Conference on Resource Intensive
Applications and Services, vol: 978-1-61208-006-2,
pages: 22 - 29, Venice, Italy, 22 - 27 May.
Dubovitskiy, D. A. and Blackledge, J. M. (2008). Object
Detection and Classification with Applications to Skin
Cancer Screening. International Society for Advanced
Science and Technology (ISAST) Intelligent Systems,
No. 1, Vol. 1, ISSN 1797-1802, pages: 34 ? 45.
Dubovitskiy, D. A. and Blackledge, J. M. (2012). Tar-
geting cell nuclei for the automation of raman spec-
troscopy in cytology. In Targeting Cell Nuclei for
the Automation of Raman Spectroscopy in Cytology.
British Patent No. GB1217633.5.
Dubovitskiy, D. A. and McBride, J. (2013). New ‘spider’
convex hull algorithm for an unknown polygon in ob-
ject recognition. BIODEVICES 2013: Proceedings of
the International Conference on Biomedical Electron-
ics and Devices, page 311.
Freeman, H. (1988). Machine vision. Algorithms, Architec-
tures, and Systems. Academic press, London.
Grimson, W. E. L. (1990). Object Recognition by Comput-
ers: The Role of Geometric Constraints. MIT Press.
Louis, J. and Galbiati, J. (1990). Machine vision and digital
image processing fundamentals. State University of
New York, New-York.
Nalwa, V. S. and Binford, T. O. (1986). On detecting
edge. IEEE Trans. Pattern Analysis and Machine In-
telligence, 1(PAMI-8):699–714.
Ripley, B. D. (1996). Pattern Recognition and Neural Net-
works. Academic Press, Oxford.
K.Clarke and D.Schweizer (1991). Measuring the fractal
dimension of natural surfaces using a robust fractal
estimator. Cartography and Geographic Information
Systems, (18):27–47.
K.Falconer (1990). Fractal Geometry. Wiley.
L.DeCola (1989). Fractal analysis of a classified land-
sat scene. Photogrammetric Engineering and Remote
Sensing, 55(5):601–610.
Snyder, W. E. and Qi, H. (2004). Machine Vision. Cam-
bridge University Press, England.
Y.YAGI, J.R.GILBERSON: Digital imaging in pathology:
The case for standardisation. J Telemed Telecare 11
(2005), 109–16.
Radiation Exposure Analysis in 3D Cancer Treatment
107
