
The Role of the Complex Extended Textural Microstructure
Co-occurrence Matrix in the Unsupervised Detection of the HCC
Evolution Phases, based on Ultrasound Images
Delia Mitrea
1
, Sergiu Nedevschi
1
and Radu Badea
2
1
Technical Unniversity of Cluj-Napoca, Department of Computer Science, Cluj-Napoca, Romania
2
Iuliu Hatieganu University of Medicine and Pharmacy of Cluj-Napoca,
Department of Medical Imaging, Cluj-Napoca, Romania
Keywords: Complex Extended Textural Microstructure Co-occurrence Matrix (CETMCM), Hepatocellular Carcinoma
(HCC), Evolution Phases, Unsupervised Classification, Ultrasound Images.
Abstract: The hepatocellular carcinoma (HCC) is a frequent malignant liver tumour and one of the main causes of death.
Detecting the HCC evolution phases is an important issue, aiming the early diagnosis of this tumour and
patient monitoring with maximum accuracy. Our objective is to discover the evolution stages of HCC, through
unsupervised classification techniques, using advanced texture analysis methods. In this work, we assessed
the role that the Haralick features derived from the Complex Extended Textural Microstructure Co-occurrence
Matrices (CETMCM) have in the unsupervised detection of the HCC evolution stages. A textural model for
these phases was also generated. The obtained results were validated by supervised classifiers, well known
for their performance, such as the Multilayer Perceptron (MLP), Support Vector Machines (SVM),
respectively decision trees and they were also compared with the previously obtained results in this domain.
The final classification accuracy was about 90%.
1 INTRODUCTION
The hepatocellular carcinoma (HCC) is the most
frequent malignant liver tumour, present in 75% of
the liver cancer cases. It evolves from cirrhosis, after
a liver parenchyma restructuring phase, towards the
end of which dysplastic nodules that can turn into
HCC result. Detecting HCC in early evolution stages
presents a major importance. Also, accurately
identifying the evolution stage is essential, in order to
adopt the appropriate treatment (Sherman, 2005).
Ultrasonography (US) is a safe method for patient
examination, non-invasive, inexpensive, easy to
apply and, thus, repeatable. Other medical imaging
based examination methods, such as the computer
tomography (CT), the magnetic resonance imaging
(MRI), or the contrast enhanced ultrasonography
(CEUS) are irradiating or expensive. In ultrasound
images, HCC appears, in incipient phases, as a small
lesion, having 3-4 cm in size. In more advanced
stages, the most relevant characteristic of HCC is the
heterogeneity, due to the co-existence of fibrosis,
regeneration nodules, hepatocitar necrosis and fat
cells. Advanced HCC is also featured by a very
complex structure of vessels. Thus, HCC is usually
hypoechogenic and homogeneous in the incipient
phase and during its evolution, it usually becomes
inhomogeneous and hyperechogenic. The most
frequent form of HCC is the focal, encephalic form.
There are, however, multiple variants observed for
the encephalic form of HCC, within the ultrasound
images, most of them being associated to a certain
evolution phase (American Liver Foundation, 2015).
These forms are depicted in the figure below (Figure
1). The Edmondson and Steiner staging system stated
the existence of four evolution stages for the HCC
tumour (Atupelage, 2013). In our research, we aim to
perform the detection of the HCC evolution phases
based on textural features determined from
ultrasound images. Thus, we analyse the capability
that the ultrasound images have in order to reveal the
HCC evolution phases and we study the properties of
each phase through textural parameters. In order to
derive new, subtle information, concerning the HCC
evolution phases, we applied unsupervised
classification techniques for the automatic staging of
HCC, based on ultrasound images.
698
Mitrea, D., Nedevschi, S. and Badea, R.
The Role of the Complex Extended Textural Microstructure Co-occurrence Matrix in the Unsupervised Detection of the HCC Evolution Phases, based on Ultrasound Images.
DOI: 10.5220/0005825506980705
In Proceedings of the 5th International Conference on Pattern Recognition Applications and Methods (ICPRAM 2016), pages 698-705
ISBN: 978-989-758-173-1
Copyright
c
2016 by SCITEPRESS – Science and Technology Publications, Lda. All rights reserved
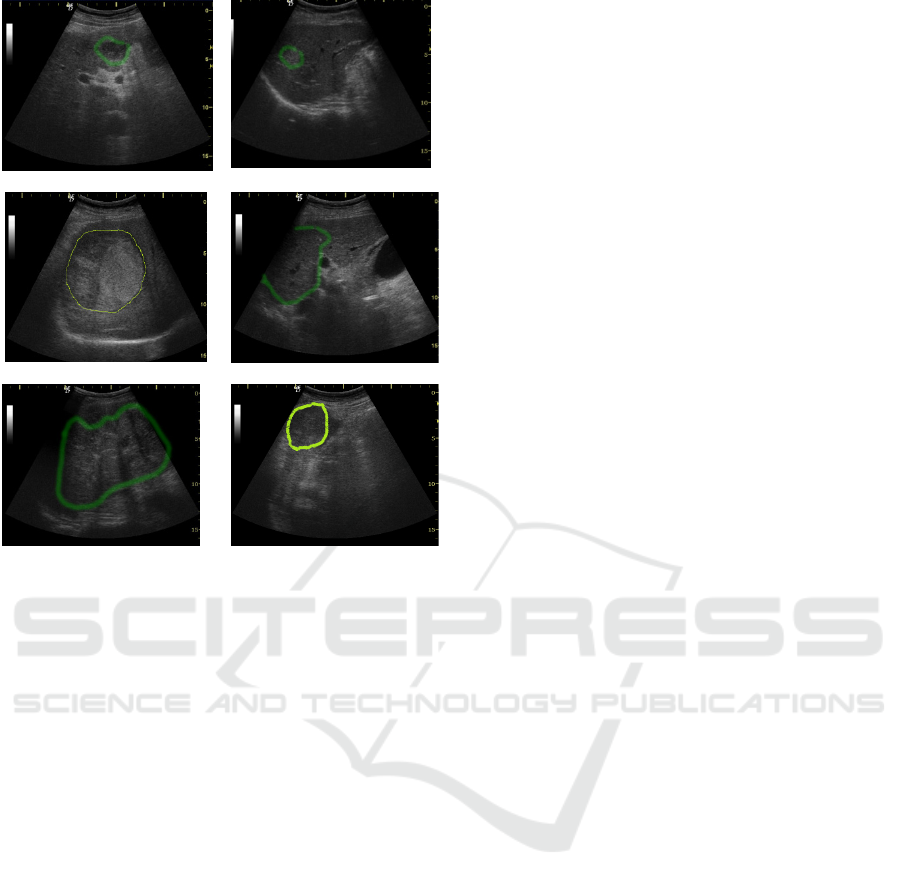
(a.) (b.)
(c.) (d.)
(e.) (f.)
Figure 1: Visual forms of the HCC tumor, in US images:
(a.) Incipient form, hypoechogenic aspect; (b.) Incipient
form, hyperechogenic aspect; (c.) Encephalic form,
hyperechogenic, inhomogeneous aspect; (d.) Encephalic
form, isoechogenic, homogeneous aspect; (e.) Encephalic
form, hyperechogenic, fibrolamelar aspect; (f.) Encephalic
form, hypoechogenic aspect.
Concerning the computerized detection of the
HCC evolution phases, several approaches exist,
involving texture-based features and supervised
classification methods (Atupelage, 2013),
respectively histological features and a combination
between supervised and unsupervised classification
techniques (Ciocchetta, 2000), but no significant
research exists regarding the automatic grading of the
HCC severity, based on ultrasound images, in an
unsupervised manner. Thus, in (Atupelage, 2013), the
authors determined the evolution stages of HCC, in
supervised manner, from histological images, using
newly defined textural features, derived through
multifractal analysis. A bag-of-features based
supervised classifier was employed in order to
identify one of the five evolution stages of HCC (four
that conformed to the Edmondson and Steiner grading
system, together with an additional stage, which
preceded the malignity). The final resulted accuracy
was 95%. Another approach combined the supervised
and unsupervised classification techniques, in order
to detect the HCC tumour in incipient phase, using
histological features (Ciocchetta, 2000). For
performing supervised classification, a combination
scheme based on the sum of the basic classifier
outputs was implemented, while for unsupervised
classification, a fuzzy-k-means clustering method
was employed. Regarding the unsupervised
classification of the malignant diseases, the authors
assessed the role of the dimensionality reduction
methods, in the context of the differentiation among
the glioma brain tumour evolution phases, based on
spectroscopic image (Resmi, 2010). Two techniques,
the Laplacian Eigenmaps, respectively the
Independent Component Analysis (ICA) were
compared, the first method resulting as superior. A
hierarchical classifier that performed agglomerative
clustering was also implemented, the final accuracy
being 91%. In our work, we discovered the evolution
phases of HCC from ultrasound images, through
computerized methods, in unsupervised manner, by
using textural features and clustering techniques. We
previously employed, for this purpose, existing,
classical methods for texture analysis, as well as
advanced, newly defined techniques, based on
generalized, superior order co-occurrence matrices
(Mitrea D., 2015). The Complex Extended Textural
Microstructure Co-occurrence Matrix (CETMCM),
based on Laws’ and gradient features, was firstly
defined in (Mitrea, D., 2014) and assessed in the
context of the supervised classification of some
abdominal tumours within ultrasound images. In this
work, we highlighted the role that the CETMCM
matrix had in the unsupervised detection of the HCC
evolution phases. For the validation of the
unsupervised classification results, appropriate
supervised classification techniques were adopted
(Witten, 2005). The results obtained in this work, due
to the CETMCM parameters, were also compared
with the previously obtained performances. The
content of this paper is structured in the following
manner: after the introduction, the state of the art is
presented. Then, the proposed methods are described
in details, followed by experiments and discussions.
At the end, the conclusions are stated and some
bibliographic references are proposed.
2 THE PROPOSED SOLUTION
The textural model of the HCC evolution stages
consists of: (a) the relevant textural features for the
differentiation among these stages and (b) the specific
values associated to each relevant textural feature:
arithmetic mean, standard deviation, and probability
distribution. In order to build the textural model of the
The Role of the Complex Extended Textural Microstructure Co-occurrence Matrix in the Unsupervised Detection of the HCC Evolution
Phases, based on Ultrasound Images
699

HCC evolution stages a methodology consisting of
the following steps was implemented: 1.) A
preliminary step, when the appropriate images were
gathered and regions of interest were marked inside
the HCC tissue. 2.) The image analysis phase was
performed then, consisting of feature computation, by
applying specific methods for texture analysis. 3.)
The learning phase, in order to discover the existing
classes, to derive the set of the relevant textural
features and their specific values. 4.) The validation
phase, the purpose being to assess the model obtained
during the previous phases, through supervised
classification methods. The techniques corresponding
to each step will be described in the next sections.
2.1 The Image Analysis Phase
The textural features were computed using both
classical and newly defined texture analysis methods.
Concerning the classical methods for texture analysis,
we considered first order statistics of the grey levels,
second order statistics of the grey levels such as the
GLCM matrix and the autocorrelation index, edge-
based statistics and gradient based features, statistics
of the textural microstructures obtained after the
application of the Laws’ convolution filters, as well
as the Shannon entropy computed after applying the
wavelet transform recursively, twice (Meyer-Base,
2009). Also, more advanced texture analysis
methods, described in our previous works, (Mitrea D.,
2012) and (Mitrea D., 2015) were implemented, such
as the following types of generalized co-occurrence
matrices: the Grey Level Co-occurrence Matrix
(GLCM), the Edge Orientation Co-occurrence Matrix
(EOCM), the Complex Textural Microstructure Co-
occurrence Matrix (CTMCM) based on Laws’
features. In this work, we analysed the role that the
Complex Extended Textural Microstructure Co-
occurrence Matrix (CETMCM) had in the detection
and characterization of the HCC evolution phases.
The CETMCM matrix was defined as follows:
)}sgn()))(sgn((,
),..sgn()))(sgn((
|,||||,..,||||,|||
|,||||,..,|||,|||
,),(,..,),(,),(
:)),(),..,,(),,(),,{((#),..,,(
1111
111212
11213112
11213112
222111
33221121
−−
−
−
⋅=−−
⋅=−−
=−=−=−
=−=−=−
===
=
nnnn
nn
nn
nnn
nnnD
ydxdyyxx
ydxdyyxx
ydyyydyyydyy
xdxxxdxxxdxx
tyxAtyxAtyxA
yxyxyxyxtttC
(1)
In (1), #S is the number of elements of the set S,
while n is the matrix dimension. Thus, each element
of this matrix, C
D
(t
1
, t
2
,..., t
n
), is equal with the
number of n-tuples of pixels, with the spatial
coordinates (x
i
, y
i
), having the values t
i
for the
attribute A(x
i
, y
i
). „A” stands for the attribute
associated to each pixel, corresponding to the textons
(cluster labels) resulted after the application of the
improved k-means clustering algorithm, while t
1
,
t
2
,..., t
n
are the values of these attributes. The
improved k-means clustering algorithm was applied
upon the combined feature vectors resulted after the
convolution with the Laws’ filters, respectively with
some representative edge detection techniques. In the
case of the Laws’ convolution filters, the 5x5 kernels
(Laws’, 1980) were taken into account: L
5
L
5
, E
5
E
5
,
S
5
S
5
, W
5
W
5
, R
5
R
5
, together with the combined
kernels, S
5
R
5
, R
5
S
5
, which provided good results in
our experiments (Mitrea D., 2012). Concerning the
edge detection techniques, we considered the Sobel
filters for detecting horizontal and vertical edges, the
Kirsch Compass filters in order to detect edges with
different orientations (multiples of 45
o
), as well as the
Laplacian convolution filter (Meyer-Base, 2009). In
practice, the probability matrix was employed (Davis,
1981). The spatial relation between the pixels (x
i
, y
i
)
was defined by the set of the displacement vectors
provided in (2)
(2)
We computed the second and third order
CETMCM matrix (for n=2 and n=3) and we
determined the Haralick features, as in (Mitrea D.,
2012). We also considered some features referring to
the n-dimensional spatial representation of the
CETMCM matrix which were not experimented
before in our research: cluster shade (equivalent to the
skewness of the histogram associated to the co-
occurrence matrix); cluster prominence (equivalent to
the histogram kurtosis); the maximum area for the
intersection of the co-occurrence matrix with a
horizontal plan in the 3D case and the corresponding
extension to the n-dimensional case. The
mathematical expressions of these features are
provided in (3), (4) and (5).
),..,,(
*}......{...
21
3
1
0
1
0
1
0
2121
12
n
G
x
G
x
G
x
nn
xxxpCETMCM
xxxClShade
n
−
=
−
=
−
=
−−−−+++=
μμμ
(3)
),..,,(
*}......{...Pr
21
4
1
0
1
0
1
0
2121
12
n
G
x
G
x
G
x
nn
xxxpCETMCM
xxxomCl
n
−
=
−
=
−
=
−−−−+++=
μμμ
(4)
}),...,,(|,),...,,({|
2121
NxxxCETMCMxxxMaxMaxAreaH
nnN
==
(5
)
In the case of the second order CETMCM
computation, the following directions were
considered: 0°, 90°, 180°, and 270°. For the third
)),(),..,,(),,((
112211 −−
=
nn
ydxdydxdydxdd
ICPRAM 2016 - International Conference on Pattern Recognition Applications and Methods
700

order CETMCM, the current pixel was considered in
the central position and together with the other two
pixels, they were either collinear, or formed a right
angle triangle, the current pixel being situated in the
position of the right angle. The following
combinations of orientations were taken into account
for the two displacement vectors: (0°, 180°), (90°,
270°), (45°, 225°), (135°, 315°) in the case of the
collinear pixels; (0°, 90°), (90°, 180°), (180°, 270°),
(0°, 270°), (45°, 135°), (135°, 225°), (225°, 315°),
(45°, 315°), in the case of the right angle triangle. The
displacement vectors had the absolute value 2, in both
cases. We determined the CETMCM and the
pCETMCM matrices for all the considered direction
combinations, the final Haralick feature values
resulting as an arithmetic mean between the values of
the Haralick features of the individual matrices.
2.2 The Learning Phase
Each of the clustering methods described below was
applied and assessed individually, before and after
relevant feature selection. Then the number of the
clusters in the data was decided, based on the
combination of the results provided by the three
methods (a majority voting procedure). The results
were validated through supervised classification.
2.2.1 Clustering Methods
The method of Expectation Maximization (EM) is a
powerful technique that iteratively estimates the
desired parameters, by maximizing the log-likelihood
of the model (Witten, 2005). The parameters
estimated in our work through this technique were the
number of clusters and the sample distributions
within the clusters. The X-means clustering method
was employed as well, being an improved version of
k-means clustering (Pelleg, 2000). The method of X-
means clustering expects a maximum and a minimum
value for the k parameter and performs the following
steps: (1.) Run conventional k-means (Witten, 2005)
to convergence, for a certain value of k. (2.) Decide
whether new cluster centroids should appear or not,
by splitting the old centroids into two. (3.) If k>k
max
,
then stop and report the best model identified during
the algorithm, according to the Bayesian Information
Criterion – BIC (XMeans). The BIC criterion is used
both for deciding which centroids to split,
respectively in order to identify the best model. The
overall algorithm performance is estimated by the
distortion, computed as the average squared distance
from the points to their centroids, for the best model.
The method of Particle Swarm Optimization (PSO)
aims to optimize the solution of a problem by
simulating the movement of a particle swarm and by
determining the best position for each particle (Das,
2008). Each particle has associated a position and a
velocity. The velocity of a particle k increases from
an iteration to another. The speed is influenced by a
cognitive component, which refers to the distance
from the personal best position, as well as by a social
component, referring to the distance from the best
global position. The optimal particle positions are
determined through an evaluation function, defined
according to the specific of each problem.
Considering our problem, of unsupervised
classification through clustering (grouping), a particle
is represented by a certain cluster configuration,
respectively by the way the cluster labels are
associated to the input data, for a given number of
clusters. We combined the PSO technique with the k-
means clustering method. The initial configuration of
the swarm resulted after the application of the k-
means method upon the initial data. We defined the
evaluation function using the specific metrics for
assessing the unsupervised classification
performance, in the case of the k-means clustering
method, meaning, the Within Cluster Sum of Squares
(WCSS). The maximum difference between the
cluster proportions, as well as the number of
insignificant clusters (having a proportion less than
10%), were also taken into account. Thus, the
evaluation function, in our case, was a weighted
mean, as described in (6). All the terms of this
weighted mean were normalized between 0 and 1.
Eval = 0.5*WCSS + 0.2*max_dif_clust_prop +
0.3*no_insignifiant_clust
(6)
2.2.2 Relevant Textural Feature Selection
Our method for relevant feature selection aims to
achieve best class separation, in the context of the
unsupervised classification. Thus, the overlapping
area between two neighbouring clusters must be as
small as possible. For each textural feature f, a
relevance score was defined, as described below:
−=
ji
ji
sizereggOverlappinflevance
,
)
,
__1()(Re
(7)
In (7), i and j are neighbouring clusters. The relevance
of f depends on the sizes of the overlapping regions
that exist between each pair of Gaussian distributions
of f corresponding to each pair of neighbouring
clusters. The overlapping region size was computed
as in (Mitrea D., 2015).
The Role of the Complex Extended Textural Microstructure Co-occurrence Matrix in the Unsupervised Detection of the HCC Evolution
Phases, based on Ultrasound Images
701

2.2.3 The Specific Values of the Relevant
Features
The arithmetic mean of the relevant textural features,
corresponding to the cluster centres were computed
for each cluster. The Graphical representation of
these arithmetic means, for all the detected clusters,
was performed, in order to analyse the correlation of
the feature values with the evolution of HCC. The
specific variation intervals per class, for each relevant
feature, were also determined, using the probability
density tables obtained after applying the Bayesian
Belief Networks method (Witten, 2005).
2.3 The Validation Phase
In order to evaluate the model resulted during the
learning phase, the relevant textural features were
provided at the inputs of some supervised classifiers,
well known for their performance. The following
supervised classification techniques, which provided
the best results in our experiments, were adopted:
Multilayer Perceptron (MLP), Support Vector
Machines (SVM), the C4.5 algorithm of decision
trees, and also a specific multiclass meta-classifier, in
combination with these basic learners. The multiclass
meta-classifier reduced the classification process to a
combination of binary classifications and was used in
conjunction with the Exhaustive Correction Code
strategy (Weka, 2015). For classification
performance evaluation, we used the recognition rate
(accuracy), the average sensitivity (average TP rate)
and the area under the ROC curve (Witten, 2011).
3 EXPERIMENTS
AND DISCUSSIONS
The experimental dataset consisted of 200 HCC
cases, three B-mode ultrasound images being taken
into account for each case (patient). All the patients
underwent biopsy, for diagnostic confirmation. The
images were acquired with an ultrasound machine of
type Logiq 7, under the same settings: 5.5 MHz
frequency, gain of 78, depth of 16 cm. A region of
interest (ROI), having 50x50 pixels in size, was
selected on each image, inside HCC. The textural
features were determined for each ROI,
independently on orientation, illumination and ROI
size. The texture analysis methods were applied using
our own modules, implemented in Visual C++. The
clustering methods, the supervised classifiers and the
Bayesian Belief Networks were implemented using
the Weka 3.6 library (Weka, 2015). The PSO method
was implemented in Matlab using a specific
framework (Biswas, 2013).
3.1 The Learning Phase
3.1.1 Discovering Clusters in the Data
First, the individual clustering techniques:
Expectation Maximization (EM), X-means clustering
(XMeans), respectively Particle Swarm Optimization
(PSO) combined with k-means clustering were
applied, before and after feature selection. The
unsupervised classification performances obtained
after performing feature selection, using the
algorithm described within the 2.2.2 section, was
usually better than the performance obtained before
feature selection. Then, the estimation concerning
the number of clusters within the data was
performed, by combining the individual results of the
adopted methods. For the XMeans method, the
Euclidean distance was considered. For each
unsupervised classification method, the parameters
representing the number of clusters (for EM and PSO
combined with k-means), respectively the minimum
and maximum number of clusters (in the case of
XMeans), were set to consecutive, integer values
ranging for 2 to 6, in order to identify the best cluster
configuration.
Table 1: The performance of EM.
No. Clusters Log likelihood Score
2 -139.87
0.41
3 -131.95 0.51
4 -117.87 0.74
5 -112.42 0.94
6 -109.027 0.5
In the case of the EM method, the log likelihood was
estimated and a score was computed, as well, using
the following formula: Score= 0.5*log_likelihood
+0.3*(1-n)+ 0.2*(1-dif), where n is the number of
small clusters, while dif is the maximum difference
between the cluster propor-tions. When computing
this score, the values for log_likelihood, n and dif
were normalized between 0 and 1. As we notice from
Table 1, the maximum score was obtained in the case
of 5 clusters, so, according to the EM method, there
are 5 clusters within the data.
In the case of the X-means clustering technique,
the distortion measure was estimated and an index
was computed as follows: Index= 0.5*distortion
+0.3*n+0.2*dif, where n is the number of small
ICPRAM 2016 - International Conference on Pattern Recognition Applications and Methods
702

clusters, while dif is the maximum difference between
the cluster proportions. All the terms (distortion, n
and dif) were normalized between 0 and 1. Thus, the
smallest index value indicated the best solution in this
situation. This index had a minimum value for 5
clusters, so there exist 5 clusters within the data,
according to the X-means clustering technique.
Table 2: The performance of PSO+k-means clustering.
No.
Clusters
WCSS Index
2 1.256e+012 0.27
3 7.392e+011 0.62
4 5.312e+011 0.34
5 4.172e+011 0.23
6 1.333e+011 0.32
In the case of PSO combined with k-means
clustering, the WCSS measure, specific for the
evaluation of the k-means technique, was considered,
and also an index was computed, corresponding to the
best values of the evaluation function, as described in
(6). Thus, also in this situation, both the WCSS
parameter and the index must take minimum values
in the best case. According to Table 2, the index took
the smallest value in the case of 5 clusters.
Considering the results provided by each of the three
adopted clustering methods, we can conclude that
there are, most likely, 5 distinct clusters within the
data, corresponding to the HCC evolution phases.
3.1.2 The Relevant Textural Features
The relevant textural features were detected by the
algorithm described in 2.2.2, for each clustering
method. Only the features that had a relevance index
above the threshold (0.6) were taken into account.
The three resulting relevant feature sets were
intersected, yielding the final set, depicted in (8).
Relevant_features = {Max_grey_level,
EOCM_Homogeneity, EOCM_Energy,
EOCM_Coreelation, GLCM3_Energy,
GLCM5_Variance, Directional_grad_variance,
Mean_level, Mean_Laws_edges, Spot_Frequency,
CETMCM_Max_AreaH,
CETMCM_Cluster_Shade, CETMCM_Cluster
_Promminence, CETMCM3_Energy,
CETMCM3_Homogeneity}
(8)
Besides the classical textural features, we notice
the presence of the CETMCM based features: the
homogeneity and the energy, derived from the third
order CETMCM, stood for the homogeneity
decrease, respectively for the echogenicity increase,
towards the advanced HCC evolution phases; the
second order CETMCM cluster shade and cluster
promminence, respectively the maximum area for the
interesection with a horizontal plan, revealed a sparse
distribution of the complex extended textural
microstructures during the initial evolution phases,
respectively an increased density of these
microstructures towards the advanced HCC evolution
phases. We also remarked the increased values for the
mean relevance index associated to the parameters
CETMCM_Cluster_Shade and
CETMCM_Max_AreaH, of 0.97, respectively 0.85.
The homogeneity, energy and variance, derived from
the EOCM matrix, as well as from the third and fifth
order GLCM, were also included in the relevant
feature set, expressing again the heterogeneous,
complex structure of the HCC tissue that
corresponded to the advanced HCC evolution phases.
We also remark the presence of the first order
statistics concerning the gradient based features and
the textural Laws’ microstructures, standing for the
variations in the tissue structure complexity, as well
as of the correlation computed from the EOCM
matrix, emphasizing differences in granularity
between various HCC evolution phases.
3.1.3 The Specific Values of the Relevant
Textural Features
In Figure 2, the values of the arithmetic means that
corresponded to some of the relevant textural
features, considered for each cluster, were graphically
represented. According to the a-priori existing
knowledge concerning the decrease in homogeneity,
respectively the increase in echogenicity during the
evolution of HCC, the second cluster, c
2
,
corresponded to the incipient phase, having the most
decreased value for the grey levels, respectively the
maximum GLCM homogeneity, while cluster c
5
corresponded to the most advanced evolution phase
for the HCC tumor, presenting the most increased
value of the gray levels, respectively the minimum
value of the GLCM homogeneity. The other clusters,
c
1
, c
3
and c
4
corresponded to intermediary evolution
phases: c
1
was closer to the incipient evolution phase,
while c
3
and c
4
were closer to the advanced evolution
phases. The arithmetic mean values of other features,
such as the energy of the third order CETMCM and
the cluster promminence derived from the second
order CETMCM, were also analyzed.
We notice, from Figure 2, that the third order
CETMCM energy had low values for the incipient
phases and high values for more advanced phases,
The Role of the Complex Extended Textural Microstructure Co-occurrence Matrix in the Unsupervised Detection of the HCC Evolution
Phases, based on Ultrasound Images
703
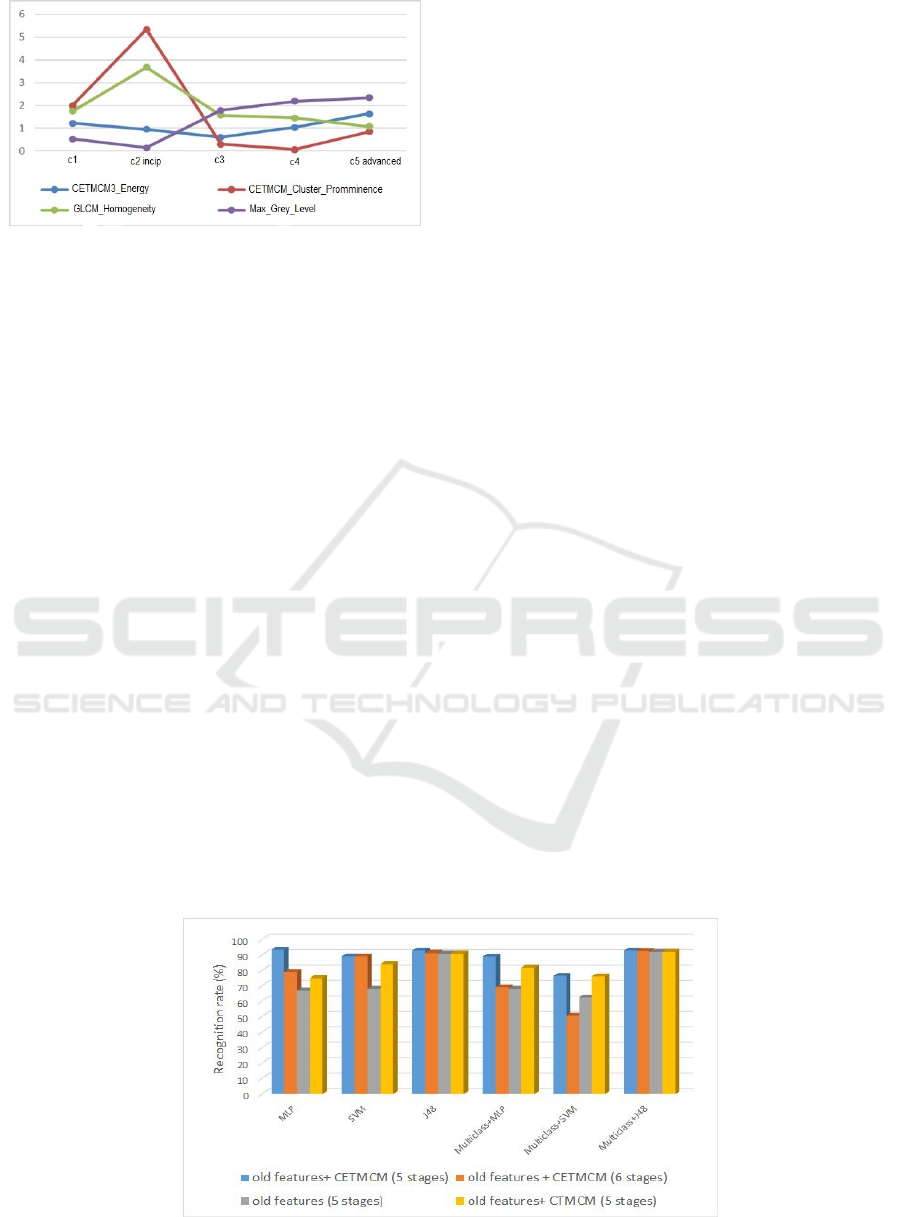
Figure 2: The mean values of the relevant textural features
for each HCC evolution phase.
denoting an increase in the density of the complex
extended textural microstructures during the HCC
evolution. The cluster promminence of the CETMCM
matrix, corresponding to the 3D histogram kurtosis,
had maximum values during the incipient evolution
phase and small values during the advanced evolution
phases, due to the fact that, during the incipient phase,
umany small values of the complex extended textural
microstructures and few increased values of these
microstructures occur. The probability distributions
generated by Bayesian Belief Networks confirmed
these results.
3.2 The Validation Phase
During this phase, the values of the relevant textural
features were provided at the inputs of some
powerfull supervised classifiers and meta-classifiers,
as described before. The SMO method, standing for
the SVM classifier, with a 3
rd
degree polynomial
kernel was considered; the MLP classifier was also
adopted, with a learning rate of 0.2, a momentum (α)
of 0.8, and the number of nodes from the single
hidden layer equal with a = (nr_input_features +
nr_classes)/2; the J48 method, the Weka equivalent
of C4.5, was employed as well. Also, we adopted the
multiclass meta-classifier of Weka 3.6 (Weka, 2015).
The instances were labeled according to the results
provided by PSO combined with k-means clustering.
The following situations were compared: the case of
using only the previous textural features; the case of
using the former textural features, combined with the
recently defined Haralick features, derived from the
CTMCM matrix, based on Laws’ features (Mitrea D.,
2015); the case of using the former textural features
combined with the newly defined CETMCM features.
For the last case, both situations of 5 and 6 clusters
were considered, as, for 6 clusters, increased values
of the usual unsupervised classification performance
parameters were obtained, but, however the size of
some resulted clusters was very small. The
comparison of the recognition rates is depicted in
Figure 3.
It results that the CETMCM features led to the
best recognition accuracy, in most of the situations.
The values obtained for 5 clusters were superior to
those obtained in the case of 6 clusters. The average
recognition rate obtained in the first case was 88.95%,
while the average accuracy obtained in the second
case was 78.63%. This confirms the results obtained
in the previous subsection, so there exist 5 clusters in
the data. When considering the combination between
the former textural features and the CETMCM
features, the maximum recognition rate, of 93.35%,
together with the maximum sensitivity (average TP
rate), of 93.14%, respectively the maximum value of
the AUC, of 98.3%, resulted in the case of the MLP
classifier.
The obtained results, indicating a 90% accuracy,
were comparable with the already obtained accuracy
for the supervised and unsupervised classification of
the HCC evolution phases (Atupelage, 2013),
(Ciocchetta, 2000). In addition, in our research, five
evolution stages of HCC were discovered,
noninvasively, through unsupervised classification
methods, from ultrasound images.
Figure 3: Evaluation of the CETMCM textural features through supervised classification methods.
ICPRAM 2016 - International Conference on Pattern Recognition Applications and Methods
704

4 CONCLUSIONS AND FUTURE
WORK
The textural features, based on the CETMCM matrix,
provided satisfying results in our study, leading to the
discovery of 5 HCC evolution phases and to an
increase in accuracy in comparison with our
previously obtained results in this domain (Mitrea D,
2015). The newly considered textural features,
associated to the spatial representation of the
CETMCM, were selected as relevant and indicated
differences concerning the complexity of the tissue
structure during the evolution of HCC. The obtained
results were validated through supervised
classification, achieving classification accuracies
around 90%. In our future work, the newly defined
features will be compared with other existing textural
features, such as the Local Binary Pattern (LBP). We
also aim to further increase the accuracy of the texture
analysis methods by employing more multiresolution
features. Larger datasets will be considered as well
and data representation techniques, such as Self
Organizing Maps (SOM) will be also employed. (Yin,
2008).
REFERENCES
Sherman, M., 2005. Approaches to the Diagnosis of
Hepatocellular Carcinoma. In Current
Gastroenterological Reports, vol. 7, no. 1, 2005, pp.11-
18.
American liver foundation, 2015. Online: http://www.
liverfoundation.org/abouttheliver/info/
Atupelage, C., Nagahashi, H., 2013. Computational grading
of hepatocellular carcinoma using multifractal feature
description. In Computers in Medical Images and
Graphics, vol. 37, 2013, pp. 61-71.
Ciocchetta, F., et al., 2000. Combining Supervised and
Unsupervised Methods to Support Early Diagnosis of
Hepatocellular Carcinoma. In Artificial Intelligence in
Medicine, vol. 2780, 2000, pp 239-243.
Resmi, A., 2010. Texture description of low grade and high
grade glioma using statistical features in brain MRIs. In
International J. of Recent Trends in Eng. and
Technology, vol. 4, no. 3, 2010, pp. 27-33.
Mitrea, D., Nedevschi, S., Abrudean, M., Badea, R., 2015.
Detecting the evolution phases of the hepatocellular
carcinoma from ultrasound images, using generalized
co-occurrence matrices. In Acta Electrotehnica, Vol.
56, No. 1-2, 2015, pp.46-54.
Mitrea D., Nedevschi S., Abrudean M., Badea, R., 2014.
Abdominal tumor recognition from ultrasound images
using Complex Extended Textural Microstructure Co-
occurrence Matrices. In Automation, Computers and
Applied Mathematics, Vol. 23, No.1, 2014, pp. 9-17.
Witten, I., Frank, E., 2005. Data Mining. Practical Machine
Learning Tools and Techniques (3rd edition), Morgan
Kaufmann.
Meyer-Base, A., 2009. Pattern recognition for medical
imaging, Elsevier.
Mitrea, D., Mitrea, P., Nedevschi, S., et al., 2012.
Abdominal tumor characterization and recognition
using superior order cooccurrence matrices, based on
ultrasound image. In, Computational and Mathematical
Methods in Medicine. Online: http://www.
hindawi.com/ journals/cmmm/2012/34813/
Laws, K.I., 1980. Rapid texture identification. In SPIE, vol.
238, 1980, pp.76-380.
Davis, L.S., 1981. Image Texture Analysis Techniques – A
Survey. In Digital Image Processing, Simon and R. M.
Haralick (eds.), pp. 189-201, 1981.
Pelleg, A., Moore, W., 2000. X-means: Extending K-
means with Efficient Estimation of the Number of
Clusters. In International Conference on Machine
Learning (ICML), pp. 727-734.
Das, S., 2008. Particle Swarm Optimization and Differen-
tial Evolution Algorithms: Technical Analysis, Appli-
cations and Hybridization Perspectives. In Studies in
Computational Intelligence, no.116, 2008, pp. 1–38.
Weka 3, Data Mining Software in Java, 2015. Online:
http://www.cs.waikato.ac.nz/ml/weka.
Biswas, P., 2013. Particle Swarm Optimization for Matlab,
Online: http://www.mathworks.com/matlabcentral/file
exchange/43541-particle-swarm-optimization--pso.
Yin, H., 2008. The Self-Organizing Maps: Background,
Theories, Extensions and Applications. In
Compu-
tational Intelligence, no. 115, 2008, pp. 715–762.
The Role of the Complex Extended Textural Microstructure Co-occurrence Matrix in the Unsupervised Detection of the HCC Evolution
Phases, based on Ultrasound Images
705
