
An Approach for Sentiment Classification of Music
Francesco Colace
1
and Luca Casaburi
2
1
DIIn, Università degli Studi di Salerno, Via Giovanni Paolo II, 132, 84084, Fisciano (SA), Italy
2
SIMASlab, Università degli Studi di Salerno, Via Giovanni Paolo II, 132, 84084, Fisciano (SA), Italy
Keywords: Sentiment Analysis, Recommender System, Knowledge Management.
Abstract: In recent years, the music recommendation systems and dynamic generation of playlists have become
extremely promising research areas. Thanks to the widespread use of the Internet, users can store a consistent
set of music data and use them in the everyday context thanks to portable music players. The problem of
modern music recommendation systems is how to process this large amount of data and extract meaningful
content descriptors. The aim of this paper is to compare different approaches to decode the content within the
mood of a song and to propose a new set of features to be considered for classification.
1 INTRODUCTION
In recent years, the music recommendation systems
and dynamic generation of playlists have become
extremely promising research areas. Thanks to the
widespread use of the Internet, users can store a
consistent set of music data and use them in the
everyday context thanks to portable music players.
The problem of modern music recommendation
systems is how to process this large amount of data
and extract meaningful content descriptors. This
information can be used for many purposes: music
search, classification and business advice or similar
audio measures. Until now, the traditional approach
to the problem has been the audio labelling. This
operation consists in the definition of symbolic
descriptors that can be used for the generation of the
playlist. Examples of this type are playlists based on
the musical genre or the artist's name. This approach
has some serious limitations: first of all, the labels
generally consider as descriptors whole songs and do
not consider genre or mood changes within the same
song. In addition to this, the classification for labels
often results in very heterogeneous classes, for
example, music belonging to the same genre can have
very different characteristics.
This is the area that houses the Music Information
Retrieval (MIR), a small but growing field of research
that brings together various professionals with a
background in musicology, psychology, signal
processing, artificial intelligence, machine learning,
etc.
The MIR is responsible for research on the
classification of the music according to the audio
signal. The main approach of classification used is
supervised.
In recent years several studies have shown that
emotions perceived by the music are not entirely
subjective and can be described using appropriate
mathematical models (Juslin and Laukka, 2004),
(Krumhansl, 1997), (Dalla Bella et al., 2001)
(Gosselin et al., 2005).
The above stated opens the door to the
reproduction of emotional behaviour in a computer
and gives hope to the classification of music. In
addition to those already mentioned in the literature,
other results of particular interest are available, each
of which differs for at least a key aspect.
Laurier & Herrera (Laurier and Herrera, 2007),
Lu et al. (Lu et al., 2006) and Shi et al. (Shi et al.,
2006) use a categorical representation founded on the
basic emotions Excited, Sad, Pleasant and Calm,
while Wieczorkowska et al. (Wieczorkowska, 2005)
use a greater number of categories to each of which
they are associated with one or more emotional states.
The approach based on the basic emotions gives
very accurate results. Li & Ogihara (Li and Ogihara,
2003) have extracted audio features such as timbre,
pitch and rhythm for the training of Support Vector
Machines in one of the first studies based on the
classification of mood music. The product has been
classified on the basis of 13 categories, 10 from the
Farnsworth’s model (Farnsworth, 1954) and other 3
from their addictions. However, the results have been
Colace, F. and Casaburi, L.
An Approach for Sentiment Classification of Music.
In Proceedings of the 18th International Conference on Enterprise Information Systems (ICEIS 2016) - Volume 2, pages 421-426
ISBN: 978-989-758-187-8
Copyright
c
2016 by SCITEPRESS – Science and Technology Publications, Lda. All rights reserved
421

very satisfactory, with values of precision of around
32% and recall of around 54%.
Skowronek et al. (Skowronek et al, 2007) have
used a set of different features such as tempo, rhythm,
tonality and other features of spectral source shaping
emotions. They have built a classifier of the mood
that uses binary categories (not-happy happy, sad not-
sad, etc...) with an average accuracy of around 85%.
Mandel et al. (2006) have designed a system that
uses MFCCs and SVM. The interesting aspect of this
work is the use of an active learning approach where
the system learns from the direct feedback provided
by the user. In addition, the algorithm chooses the
examples to be labelled intelligently, requiring the
user to record only the instances considered more
informative, thus reducing the amount of data needed
to construct the model.
Lu et al. (Lu et al, 2006) use four categories,
contentment, depression, anxious and exuberance,
derived from the model of Thayer (Thayer,
1989)(Thayer, 1996) which is based on two-
dimensions: stress and energy. The system is trained
with 800 pieces of classical music and it reaches a
level of precision of roughly 85% (the training phase
has been conducted using three quarters of the dataset
while the test phase has been conducted on the
remaining quarter of the data). Nevertheless, the
prediction of the mood has been taken using the four
squares as exclusive categories although the study
refers to a system of spatial representation.
Yang et al. (Yang et al, 2008) use the Thayer’s
model with a regressive approach to shape each of the
two dimensions: arousal and valence. The
participants to the previous project have extracted 114
features, mainly spectral and tone, together with the
features related to the loudness. The software used for
the extraction of features have been Marsyas and
PsySound, the Principal Component Analysis (PCA)
filter has been subsequently applied to the set of
features in order to reduce the size of the feature
vectors. In combination with these tools, they have
shaped Arousal and Valence using a dataset of 195
previously recorded clips and the regression function:
Support Vector Regression. The overall results are
very encouraging.
Yang & Chen (Yang et al, 2010) use a new
approach, not commonly used in the MIR, based on
the employ of algorithms as ListNet and propose a
new algorithm called RBFListNet. Han et al. design a
system of emotion recognition called SMERSH (SVR
-based Music Emotion Recognition System) based on
the model of Thayer (Thayer, 1989)(Thayer, 1996).
They have observed an increase in the level of
accuracy simply passed from a Cartesian to a polar
representation of the data.
Eerola et al. (Eerola et al, 2010) have tested both
the paradigms of representation of the mood: category
and space. They have proposed PLS (Partial Least
Square) as regression technique for a space of three
dimensions: activity, valence and tension. The
database containing the records consists of music
often employed as soundtrack of the films and then
tailored to convey emotions. The collection consists
of 110 tracks selected and annotated by 116 students.
The features have been extracted using MIRtoolbox.
They have reported relatively good results also
suggesting that two sizes should be more than
sufficient to shape emotions.
(Schmidt et al., 2013) have developed a game
called Moodswings in order to be able to collect the
data of records within a two-dimensional plane with
Arousal and Valence. On the basis of the data
collected (1 record per second), we have performed a
series of tests of classification techniques in
combination with the selection of the features and
regression. A comparison has also been carried out,
in terms of performance, between the representation
and the spatial category. The approach is regressive
and the sizes Arousal and Valence have given the best
results.
(Cardoso et al., 2011) have brought the
MOODetector software to automatically generate
playlists based on mood. The instrument works like a
typical music player, it extends itself with
mechanisms for automatic estimation of the values of
arousal and valence in the Thayer’s plane. The used
dataset contains 194 musical clips lasting 25 seconds
from which some spectral features have been
extracted, such as centroid, spread, skewness,
kurtosis, slope, rolloff, flux and MFCCs together with
time and tonality, through the use of Marsyas,
MIRtoolbox and Psysound. The question of musical
recognition is addressed in terms of regression using
LIBSVM. The system reaches an accuracy R^2 of
63% for the arousal and of 35.6% for the valence.
(Aljanaki et al., 2013) solve the problem of
classification of the mood within the task MediaEval
2013 dividing the work into several phases: data
filtering feature extraction attribute selection,
regression and evaluation. The training model has
been made using a data set of 744 songs from which
some other temporal and spectral features, such as
rms, low energy, zero crossing rate, etc., have been
extracted using MIRToolbox, PsySound and
SonicAnnotator. Pursued to the selection of the
attributes, the data were modelled using multiple
regression techniques such as Support Vector
Regression, M5Rules, Multilayer Perceptron and
ICEIS 2016 - 18th International Conference on Enterprise Information Systems
422
other regression techniques available in WEKA. The
evaluation of the algorithms has been performed
using a Cross Validation of 10 segments. The system
is able to obtain excellent performances: 0.64 for
arousal and 0.36 for valence (in R^2).
2 THE PROPOSED APPROACH
The aim of this paper is to compare different
approaches to decode the content within the mood of
a song and to propose a new set of features to be
considered for classification. The spatial
representation in two dimensions proposed by Russell
has been chosen to map the emotional states and
describe the mood, according to the latest studies
about the state of the art.
It will adopt an approach of supervised learning;
in particular, it will define the problem in terms of
Regression. This choice enables us to be free from
semantic classes and to estimate only two values
(arousal and valence) for each song so as to locate a
point in the plane of Russell.
The tools MIRtoolbox and openSMILE are used
for the extraction of features from the audio tracks.
Weka is used for the classification stage.
Several regression algorithms will be compared
and are all available in Weka Data Mining. These
algorithms are: LinearRegression, RBFREgression
and AdditiveRegression.
The approach used for the classification process
is shown in figure 1. The method, in accordance with
literature, is divided into 4 main components:
Recovery of the DataSet.
Audio Features Extraction.
Filtering Features, Training and Classification.
Evaluation.
Figure 1: Description of the process.
2.1 The DataSet
We use a 1000 songs dataset [19] to test all the
algorithms and it consists of 744 songs. The songs, as
provided in the package of 45 sec clips in MPEG
Layer 3 (MP3), have been selected from the Free
Music Archive (FMA), while the records for each clip
have provided a csv format.
For reasons of compatibility with the used
software, it has been necessary to convert any audio
from MP3 to WAV. Static records have been used for
tagging and they relate to the classification of the
entire music clip.
The evaluation process has been carried out using
a cross-validation based on 10 folds breaking the data
into train-set and test set.
Clips of 45 seconds have been drawn randomly
from the original songs and all are re-encoded to have
the same sample rate of 44100Hz.
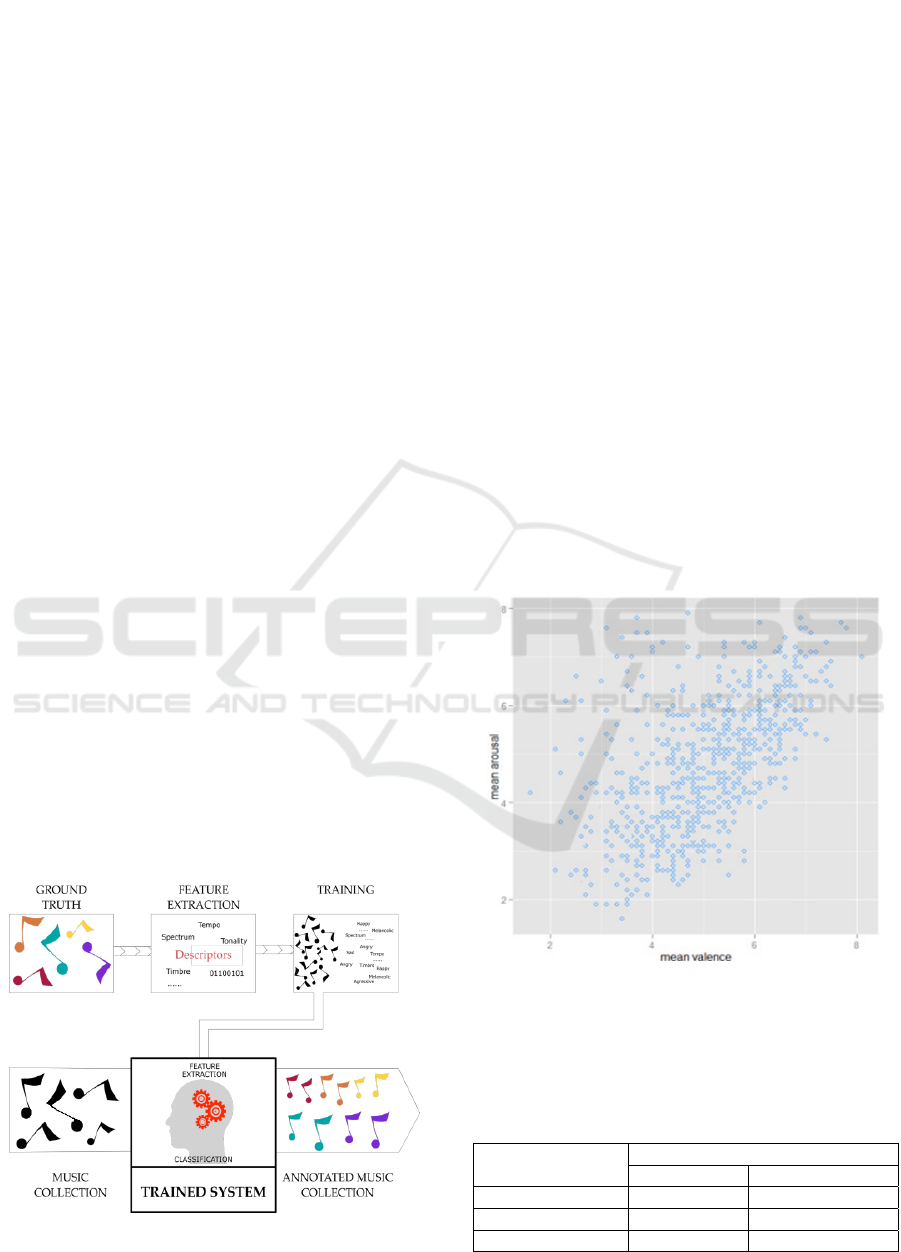
A graphical representation of the used data set is
shown in Figure 2. On the Y-axis, it shows the
average value of Arousal (mean arousal) and on the
X the average value of Valence (mean valence)
received by each audio clip inside the package in the
phase of the static annotation.
Figure 2: Graphical representation of 1000 Songs Dataset.
This dataset was used as a base for the MediaEval
2013 whose results by Anna Aljanaki et al. (2013) are
reported in table 1.
Table 1: Results obtained in the Mediaeval 2013.
Evalutation Metric
M5Rules & Multiple Regression
Arousal Valance
R^2 0.64 0.36
MAE 0.08 0.10
AE-STD 0.06 0.07
An Approach for Sentiment Classification of Music
423

2.2 Audio Features Extraction
In this phase, the software openSMILE and
MIRtoolbox have been used. OpenSMILE is able to
extract numerous descriptors of low-level (Low-
Level Descriptors – LLD) to which it is possible to
apply different filters, functionalities and
transformations.
They have defined four different sets of features:
The first set of features we refer to is emolarge. It
was written in 2009 by Florian Eyben, Martin
Woellmer and Bjoern Schuller. This
configuration file allows you to extract
descriptors such as: Energy, MFCC, Mel-based
features, Pitch and other descriptors of low level
source such as spectral, spectral-roll-off, spectral
flux, spectral centroid etc. The set contains 6669
used features derived from a base of 57 LLD to
which as many 57 delta coefficients of first order
(differential) and 57 coefficients of acceleration or
delta coefficients of second order correspond. For
each of the 171 descriptors of low level (57 + 57
+ 57) 39 features have been calculated so coming
to 6669 features (Table 2).
Table 2: List of LLD and functions for the configuration file
'emolarge' - Experiment 1.
LLD
Functional Type
Energy
Cepstrum
Pitch
Voice quality
Crossing
Spectral
Extremes
Means
Regression
Moments
Percentiles
Crossings
Peaks
For the second experiment, we consider the set of
features called emobase2010. This configuration
is based on a previous study, "INTERSPEECH
paralinguistics challenge". It was written by
Florian Eyben, Martin Woellmer and Bjoern
Schuller in 2010 and allows extracting descriptors
such as pitch, loudness, Jitter, MFCC, MFB, LSP
and calculating some functionalities on them. The
set contains 1582 used features derived from a
base of 34 LLD to which as many 34 delta
coefficients of first order correspond. For each of
the 68 LLD, 21 features have been calculated so
coming to 1428 features. 4 LLD have been
extracted for the pitch, in each of them
accompanied by four deltas of the first order. For
each of the 8 LLD, 19 features have been
calculated by adding functionality, then other 152
features prior to 1428, plus 2-pitch-based features
(Table 3).
Table 3: List of LLD and functions for 'emobase2010'
configuration file - Experiment 2.
LLD
Functional Type
Intensity & loudness
Cepstrum
LPC
Pitch
Voice quality
Extremes
Means
Regression
Moments
Percentiles
Times/duration
A configuration of features realized by us has
been used for the experiment 3. The considered
descriptors are Energy, MFCC, Mel-based
features, Pitch, LSP, intensity, loudness, Chroma-
features and other descriptors of low-level source
such as spectral spectralRollOff, spectralFlux,
spectralCentroid etc. For each of the 110 LLD, 2
functionalities have been calculated, mean and
standard deviation, and we have obtained 220
features (Table 4).
Table 4: List of LLD and functions for our configuration -
Experiment 3.
LLD
Functional Type
Intensity & loudness
Cepstrum
LPC
Pitch
Voice quality
Extremes
Means
Regression
Moments
Percentiles
Times/duration
In the fourth and final experiment, the software
used for the extraction of features has been
MIRtoolBox with MATLAB. The features
extracted in this case are shown in table 5.
Table 5: List of features extracted by MIRtoolBox -
Experiment 4.
Source Features
MIR ToolBox
Rms, low energy, filter
bank, attack time, attack
slope, centroid,
fluctuation, brightness,
spread, skewness, kurtosis,
flux, flatness, roughness,
irregurality, inharmonicity,
rolloff85, rolloff95, event
density, time, pulse clarity,
entropy, MFCC, zero
cross, pitch, peaks, key
clarity, mode, HCDF,
novelty
2.3 Evalutation
The experiments have been evaluated by computing
ICEIS 2016 - 18th International Conference on Enterprise Information Systems
424

Mean Absolute Error (MAE) and Root-Mean Square
Error (RMSE) for Arousal and Valence.
=
1
−
=
1
|
−
|
where
is the value predicted by the model and is
the value to predict.
The results obtained through cross-validation of
10 folds are shown below.
2.3.1 Experiment 1
In the pre-processing phase, PCA, ReliefF and
CfsSubsetEval filters have been applied to the data set
of features. The best results have been obtained using
ReliefF and are reported in Table 6.
Table 6: Results of the experiment 1.
Method Valence Arousal
Additive
Regression
MAE: 0.1971
RMSE: 0.2482
MAE: 0.1577
RMSE: 0.199
Linear
Regression
MAE: 0.2149
RMSE: 0.2698
MAE: 0.1917
RMSE: 0.2362
RBF Regression
MAE: 0.2102
RMSE: 0.2701
MAE: 0.1716
RMSE: 0.2196
The high number of features, 6669, in addition to
giving very distant results from the state of the art, has
required the times of filtering and typically long
training for the three tested regression algorithms.
In conclusion, from this experiment it can be
deduced that the best results are obtained using the
Additive Regression to predict the values of arousal
and valence.
2.3.2 Experiment 2
In this experiment during pre-processing, only the
method of selection ReliefF has been applied to the
data set. In Table 7, the best results in the context of
this experiment are shown.
Table 7: Results of the experiment 2.
Method Valence Arousal
Additive
Regression
MAE: 0.2087
RMSE:
0.2625
MAE: 0.2036
RMSE: 0.2532
Linear
Regression
MAE: 0.2301
RMSE:
0.2911
MAE: 0.229
RMSE: 0.285
RBF Regression
MAE: 0.229
RMSE: 0.285
MAE: 0.2087
RMSE: 0.26256
2.3.3 Experiment 3
In this experiment, the phase of selection of features has
been carried out manually, therefore no filter has been
used. The results obtained are reported in Table 8.
Table 8: Results of the experiment 3.
Method Valence Arousal
Additive
Regression
MAE: 0.2313
RMSE:
0.2674
MAE: 0.1659
RMSE: 0.2198
Linear
Regression
MAE: 0.2458
RMSE:
0.3167
MAE: 0.1958
RMSE: 0.2487
RBF Regression
MAE: 0.242
RMSE:
0.3086
MAE: 0.1844
RMSE: 0.2359
2.3.4 Experiment 4
The best results are reported in Table 12 and have
been obtained using the entire set of features and
without pre-processing filter.
Table 9: Results of the experiment 4.
Method Valence Arousal
Additive
Regression
MAE: 0.084
RMSE:
0.1045
MAE: 0.0759
RMSE: 0.0943
Linear
Regression
MAE: 0.0919
RMSE:
0.1143
MAE: 0.0801
RMSE: 0.0984
RBF Regression
MAE: 0.088
RMSE:
0.1092
MAE: 0.0775
RMSE: 0.0973
In the latter experiment, we can observe a slight
improvement in terms of performance of the trained
models compared to the state of the art. The best
result has been obtained, as in the previously
illustrated cases, with the Additive Regression.
3 CONCLUSIONS
Of the first three experiments conducted, the best
result has been obtained under the experiment 1
failing to have a MAE of 0.1577 for the arousal and
0.1971 for the valence for a RMSE of 0.199 for the
arousal and 0.2482 for the valence, this however at
the expense of a very high time classification. In the
experiment 3, instead, even if the results obtained are
slightly coarse, with a MAE of 0.1659 for the arousal
and 0.2313 for the valence for a RMSE of 0.2198 for
the arousal and 0.2674 for the valence, the amount of
used features is much smaller.
An Approach for Sentiment Classification of Music
425

From the experiments, it can be seen, as well as
for the state of the art, that the error on Valence is
much higher than the error on Arousal.
Recalling that the annotations that it makes
reference to for training the models are provided by
individuals, in the light of the experiments, it can be
inferred that people are more able to distinguish the
level of activation of the music (arousal) rather than
the negative or positive mood contained in the song
(valence). The best result has been obtained with the
experiment 4, getting slightly better outcomes than
the state of the art presented in the task of MediaEval
2013.
Wanting to advance criticisms to this dataset,
looking at the distribution of records within the
graphical representation, it can be observed that, on
the basis of the description of the moods according to
Russell, the number of audio tracks that have a high
value and a low arousal (RELAXED) are few. In the
future, a more balanced set will be adopted.
REFERENCES
Juslin, P. N. & Laukka, P., 2004, Expression, Perception,
and Induction of Musical Emotions: A Review and a
Questionnaire Study of Everyday Listening, Journal of
New Music Research, 33 (3), 217–238.
Krumhansl, C. L., 1997, An exploratory study of musical
emotions and psychophysiology. Canadian journal of
experimental psychology, 51 (4), 336–353.
Dalla Bella, S., Peretz, I., Rousseau, L., & Gosselin, N.,
2001, A developmental study of the affective value of
tempo and mode in music, Cognition, 80 (3), 1–10.
Gosselin, N., Peretz, I., Noulhiane, M., Hasboun, D.,
Beckett, C., Baulac, M., & Samson, S., 2005, Impaired
recognition of scary music following unilateral
temporal lobe excision, Brain, 128 (3), 628–640
Laurier, C. & Herrera, P., 2007, Audio music mood
classification using support vector machine. In
Proceedings of the 8th International Conference on
Music Information Retrieval. Vienna, Austria.
Lu, L., Liu, D., & Zhang, H.-J., 2007, Automatic mood
detection and tracking of music audio signals. Audio,
Speech, and Language Processing, IEEE Transactions
on, 14 (1), 5–18.
Shi, Y.-Y., Zhu, X., Kim, H.-G., & Eom, K.-W., 2006, A
Tempo Feature via Modulation Spectrum Analysis and
its Application to Music Emotion Classification. In
Proceedings of the IEEE International Conference on
Multimedia and Expo, pp. 1085–1088.
Wieczorkowska, A., Synak, P., Lewis, R., & Raś, 2005,
Extracting Emotions from Music Data. In M.-S. Hacid,
N. V. Murray, Z. W. Raś, & S. Tsumoto (Eds.)
Foundations of Intelligent Systems, Lecture Notes in
Computer Science, vol. 3488, chap. 47, pp. 456–465.
Berlin, Heidelberg: Springer-Verlag.
Li, T., Ogihara, M., 2003, 'Detecting emotion in music',
paper presented to Proceedings of the International
Symposium on Music Information Retrieval,
Washington D.C., USA.
Farnsworth, P. R., 1954, A study of the Hevner adjective
list. The Journal of Aesthetics and Art Criticism, 13 (1),
97–103.
Skowronek, J., McKinney, M., & van de Par, S., 2007, A
Demonstrator for Automatic Music Mood Estimation.
In Proceedings of the 8th International Conference on
Music Information Retrieval, pp. 345–346. Vienna,
Austria.
Thayer, R. E. (1989). The biopsychology of mood and
arousal. Oxford: Oxford University Press.
Thayer, R. E. (1996). The Origin of Everyday Moods:
Managing Energy, Tension, and Stress. Oxford: Oxford
University Press.
Yang, Y. H., Lin, Y. C., Su, Y. F., & Chen, H. H., 2008, A
Regression Approach to Music Emotion Recognition.
IEEE Transactions on Audio, Speech, and Language
Processing, 16 (2), 448–457.
Yang, Y. H. & Chen, H., 2010, Ranking-Based Emotion
Recognition for Music Organization and Retrieval.
IEEE Transactions on Audio, Speech, and Language
Processing, 487–497
Eerola, T., Lartillot, O., & Toiviainen, P. (2009). Prediction
of Multidimensional Emotional Ratings in Music from
Audio using Multivariate Regression Models. In
Proceedings of ISMIR 2009, pp. 621–626.
Mohammad Soleymani, Micheal N. Caro, Erik M.
Schmidt, Cheng-Ya Sha, and Yi-Hsuan Yang, 2013,
1000 songs for emotional analysis of music,
Proceedings of the 2Nd ACM International Workshop
on Crowdsourcing for Multimedia (New York, NY,
USA), CrowdMM ’13, ACM, 2013, pp. 1–6.
Luís Cardoso, Renato Panda and Rui Pedro Paiva, 2011,
“MOODetector: A Prototype Software Tool for Mood-
based Playlist Generation” Department of Informatics
Engineering, University of Coimbra – Pólo II, Coimbra,
Portugal.
Anna Aljanaki, Frans Wiering, Remco C. Veltkamp:
“MIRUtrecht participation in MediaEval 2013:
Emotion in Music task” Utrecht University,
Princetonplein 5, Utrecht 3584CC {A.Aljanaki@uu.nl,
F.Wiering@uu.nl, R.C.Veltkamp@uu.nl}
ICEIS 2016 - 18th International Conference on Enterprise Information Systems
426
