
Circadian Dynamics of High Frequency Oscillations in Patients with
Epilepsy
Jirí Balach
1
, Petr Jezdik
1,2
, Radek Janca
1
, Roman Cmejla
1
, Pavel Krsek
3
, Petr Marusic
4
and Premysl Jiruska
5
1
Departement of Circuit Theory, Czech Technical University in Prague, Technická 2, Prague, Czech Republic
2
Department of Measurement, Czech Technical University in Prague, Technická 2, Prague, Czech Republic
3
Department of Pediatric Neurology, 2
nd
Faculty of Medicine, Charles University in Prague, Motol University Hospital,
Prague, 150 06, Czech Republic
4
Department of Neurology, 2
nd
Faculty of Medicine, Charles University in Prague, Motol University Hospital, Prague,
150 06, Czech Republic
5
Department of Developmental Epileptology, Institute of Physiology, The Czech Academy of Sciences, Prague, CZ-14220,
Czech Republic
Keywords: Intracerebral EEG, High-frequency Oscillations, Circadian Rhythms, Epilepsy, Seizure Onset Zone.
Abstract: High frequency oscillations (HFOs) are novel biomarker of epileptogenic tissue. HFOs are currently used to
localize the seizure generating areas of the brain, delineate the resection and to monitor the disease activity.
It is well established that spatiotemporal dynamics of HFOs can be modified by sleep-wake cycle. In this
study we aimed to evaluate in detail circadian and ultradian changes in HFO dynamics using techniques of
automatic HFO detection. For this purpose we have developed and implemented novel algorithm to automatic
detection and analysis of HFOs in long-term intracranial recordings of six patients. In 5/6 patients HFO rates
significantly increased during NREM sleep. The largest NREM related increase in HFO rates were observed
in brain areas which spatially overlapped with seizure onset zone. Analysis of long-term recording revealed
existence of ultradian changes in HFO dynamics. This study demonstrated reliability of automatic HFO
detection in the analysis of long-term intracranial recordings in humans. Obtained results can foster practical
implementation of automatic HFO detecting algorithms into presurgical examination, dramatically decrease
human labour and increase the information yield of HFOs.
1 INTRODUCTION
High-frequency oscillations (HFOs) are sinus like
oscillations significantly rising above the background
in the frequency range above 80 Hz (Bragin et al.,
2002; Jacobs et al., 2008; Staba et al., 2002;
Urrestarazu et al., 2007). HFOs are divided into two
types according to their frequency profile.
Oscillations in range 80-200 Hz are classified as
ripples while oscillations over 200 Hz are called fast
ripples. HFOs represent a novel biomarker of
epileptogenic tissue with the potential to increase the
information yield of presurgical evaluations and to
improve the outcomes of epilepsy surgery.
Visual analysis of HFO in intracranial recordings
is a time consuming process. According to Zelmann
et al., (2012) it takes 10 hours of concentrated human
work to analyse 10 channel data with duration of 10
minutes. Visual review of long-term signals from a
hundreds of channels is virtually impossible in a
reasonable time period and it also suffers from human
bias. Successful implementation of HFOs analysis
into the clinical practice requires development of new
techniques of automatic HFOs detection which would
provide reliable information about HFO
spatiotemporal dynamics. Substantial number of
studies focused on the HFOs and their utilization in
presurgical examination evaluated only short-term
recordings. Only selected segments of invasive EEG
(iEEG) usually up to 10 minutes long were evaluated
in large number of HFO studies (Jacobs et al., 2010;
Kerber, 2013). In these studies HFOs were labelled
manually or semi-automatically using detection
algorithms for preselection of candidate HFO events
(Zelmann et al., 2012; Worrell, 2008; Crépon, 2010;
Staba et al., 2002; Cho et al., 2014).
284
Balach, J., Jezdik, P., Janca, R., Cmejla, R., Krsek, P., Marusic, P. and Jiruska, P.
Circadian Dynamics of High Frequency Oscillations in Patients with Epilepsy.
DOI: 10.5220/0005827602840289
In Proceedings of the 9th International Joint Conference on Biomedical Engineering Systems and Technologies (BIOSTEC 2016) - Volume 4: BIOSIGNALS, pages 284-289
ISBN: 978-989-758-170-0
Copyright
c
2016 by SCITEPRESS – Science and Technology Publications, Lda. All rights reserved

Table 1: Summary of patient dataset information; *Original frequency, resampled to 512Hz.
Patient
number
Age /
Gender
MRI findings
Number of channels of
implanted electrodes
Sampling
frequency (Hz)
Record length
(hours.)
1 child/M FCD Ib 122 1000* 12
2 adult/F Normal 128 512 24.5
3 adult/F FCD susp. 128 512 22.5
4 child/M FCD IIb 71 1000* 22
5 adult/F FCD Ia 128 512 12
6 child/M FCD IIb 109 1000* 14.5
The advantage of algorithms of automated HFO
detection is their capability to analyse large amount
of data in a relatively short time. Recordings are
analysed with the same conditions and by the same
measures and obtained results are not biased. The
major downside of automated algorithms represents
inconsistent number of false detections.
Several studies have demonstrated that spatial
distribution of HFOs correlates with the localization
of seizure onset zone (Bagshaw et al., 2009; Brázdil
et al., 2010; Jacobs et al., 2009, 2008; Urrestarazu et
al., 2007). Moreover, resection of HFO generating
regions has been associated with better surgical
outcomes (Akiyama et al., 2011; Cho et al., 2014;
Fujiwara et al., 2012; Haegelen et al., 2013; Sakuraba
et al., 2015). Long-term HFOs dynamics and
spatiotemporal profile are, however, modulated by
several factors like levels of inhibition, vigilance and
by sleep. It has been shown that HFO rate increases
during slow wave sleep (Clemens et al., 2007 ,
Bagshaw et al., 2009) but individual stages of NREM
sleep (NREM1-NREM4) do not influence HFO rates.
Ripples and the fast ripples were confined to SOZ
during NREM. Another study demonstrated that good
surgical outcome was achieved, if the resection
involved brain tissue where ripples occurred during
REM stage (Sakuraba et al., 2015).
These long-term changes in HFO properties must
be taken in account in analysis of HFOs and
interpretation of the results. In the current study, we
aimed to examine the long-term HFO dynamics using
automatic HFO detector (Balach et al., 2014).
2 DATA & METHODS
2.1 Database
We analyzed long-term recordings from three
paediatric and three adult patients implanted with
subdural and/or depth electrodes as a part of the
presurgical examination (Table 1.). Signals were
sampled at 512 Hz (adults) and 1 kHz (children).
High sampling rate signals were resampled to 512 Hz.
The average length of recordings was 17.9 ± 5.7
hours. Each dataset contained 114 ± 22 contacts.
Electrode contacts inside the SOZ were marked by
experienced neurologists. The SOZ was defined as
the area of the brain with the earliest occurrence of
ictal discharges (Litt et al., 2001; Marsh et al., 2010;
Thornton et al., 2011). Research procedures and data
collection were approved by the institutional ethical
committee and patient or parent informed consent
was obtained.
2.2 Methodology
HFO detector was applied to recorded data. The HFO
detection algorithm is based on the dynamical
thresholding of short-time energy changes, followed
by calculation of the number of cycles within the
detected HFO event and identification of peak
frequency within HFO frequency bands (Balach et al.,
2014). To obtain average HFO rate per minute we
used 5-minute sliding window with 80% overlap. Due
to high inter-patient variance of HFO rate, the rate
was normalized by maximal rate observed in each
dataset. Evaluation of circadian changes in HFO
properties required identification of sleep and
wakefulness. Because standard polysomnographic
(PSG) signals (scalp EEG, EOG and EMG) could not
be recorded during invasive monitoring, we
determined the sleep and wakefulness indirectly from
iEEG. First, signals with frequent interictal
epileptiform discharges were removed. The
discharges were detected using highly sensitive spike
detector (Janca et al., 2014).Channels with interictal
epileptiform discharge rate higher than the first
quartile were excluded. Selected data were band-pass
filtered in 2-15 Hz, segmented by 3.5 minutes
window with 70 % overlap. For each data segment we
calculated mean energy and signal zero crossing
frequency. To minimize the energetic and spectral
impact of artefacts, both parameters were normalised
by their 99
th
percentiles and recalculated to a PSG
parameter. This parameters represents frequency to
energy ratio, eq. 1.
Circadian Dynamics of High Frequency Oscillations in Patients with Epilepsy
285
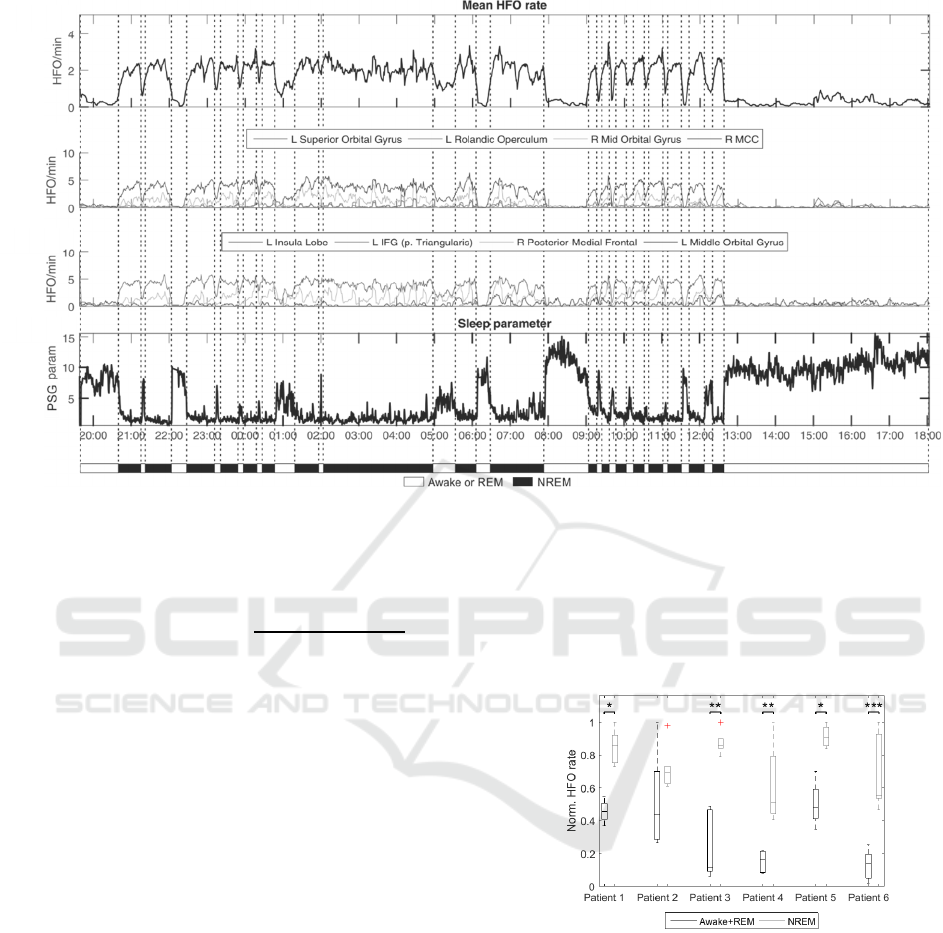
Figure 1: HFO rates in a one-day cycle in patient 3. Awake and sleeping stages were set manually according to HFO rates,
daytime and PSG parameter. A) Mean HFO rate during day/night cycle. B, C) Example of HFO rates from selected brain
structures. Electrode contacts were assigned to anatomical structures according to anatomical atlas (Eickhoff et al., 2005).
Assignments were made manually from the CT/MRI co-registered images. D) Temporal profile of PSG parameter.
.
.
(1)
During the NREM sleep, the normalised
frequency decreases towards the lower frequencies
from delta frequency band while the normalised
energy increases. PSG values drop during the NREM
stage and increase during REM sleep and
wakefulness.
We manually identified wakefulness, REM and
NREM from the PSG parameter. Due to difficult
differentiation between REM sleep and awake states
we classified them as a single awake+REM state.
Utilizing automatic HFO detector we aimed to
address following questions:
1) Does HFO rate varies between awake+REM
and NREM states?
2) Does HFO rate in SOZ and outside display
different circadian dynamics?
3) Does HFO rate correlates with localization of
SOZ?
3 RESULTS
In total 833,199 HFO events were detected in 107.5
hours of iEEG data from all six patients. The
normalised HFOs rates were significantly higher
during NREM than in awake+REM state in 5/6
patients (p<0.05, Wilcoxon’s test, Figure 2).
Figure 2: HFO rates in NREM and Awake+REM states in
each patient (*p<0.05; **p<0.01; ***p<0.001). Patient 2
p=0.1255.
HFO rates during Awake+REM state did not
differ inside and outside SOZ. However, in NREM
state HFO rates in SOZ significantly increased
(p<0.001, Wilcoxon’s test, Figure 3).
The most HFO active regions overlapped with the
SOZ. Better overlap was observed during NREM
(62.8±40%) than during awake+REM state
(44.8±33.7%).
A
B
C
D
BIOSIGNALS 2016 - 9th International Conference on Bio-inspired Systems and Signal Processing
286
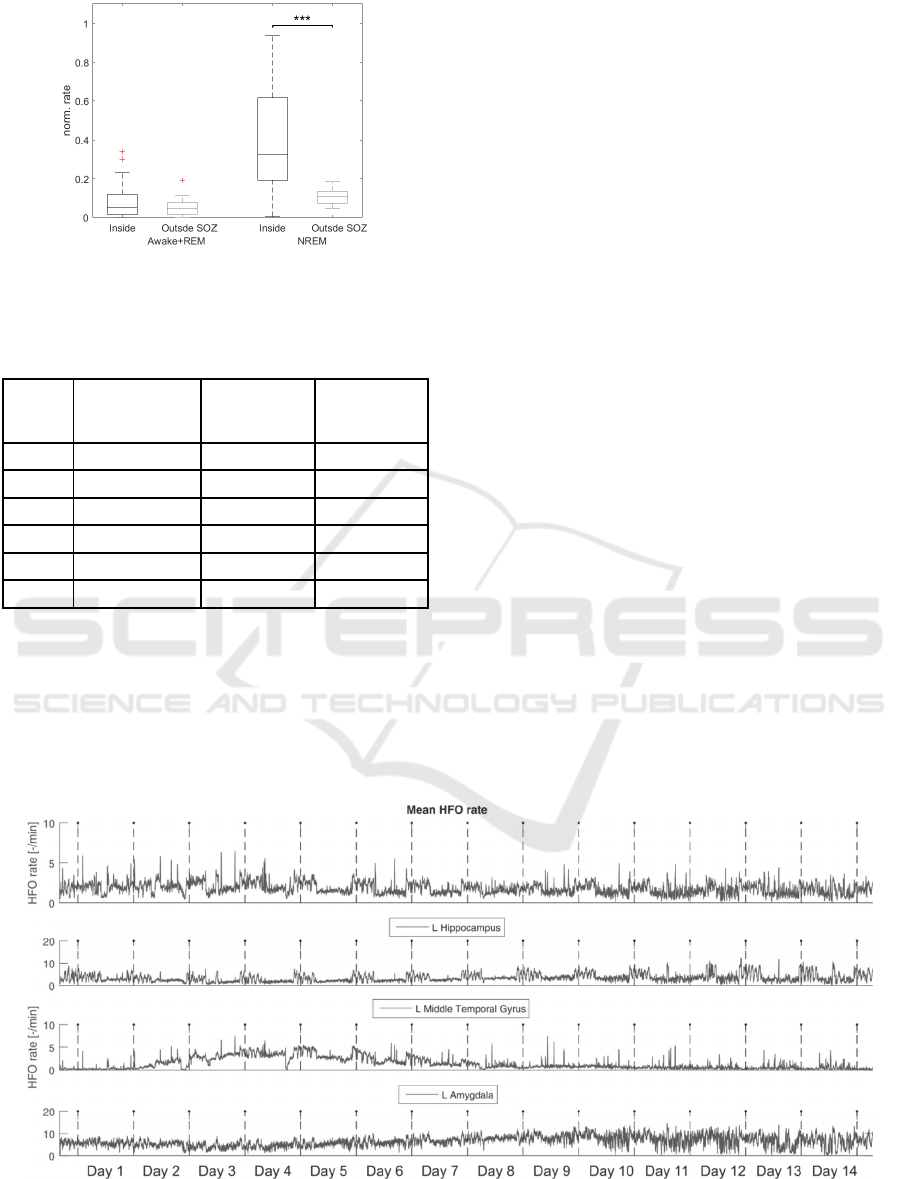
Figure 3: HFO rates significantly increased inside SOZ
during NREM stages. (***p<0.001).
Table 2: Localization ability of channels with HFO
maximal rates ( > 75 percentile).
Patient
Number of
channels in 4
th
quartile
In/Total SOZ
contacts in
awake/REM
In/Total SOZ
contacts in
NREM
1 28 3/16 (19%) 6/16 (38%)
2 29 0/11 (0%) 0/11 (0%)
3 27 17/23 (74%) 20/23 (87%)
4 16 5/19 (26%) 10/19 (52%)
5 16 3/4 (75%) 4/4 (100%)
6 27 3/4 (75%) 4/4 (100%)
In patient 2 we analyzed 14 days of iEEG
recording to evaluate reliability of automated HFO
analysis over very long time period (Figure 4).
Processing of the whole dataset took 130 hours and
4,393,892 HFO events were detected. According to
Zelmann et al., (2012), visual review of such dataset
from HFO perspective would take approximately
258048 hours (~29 years) of human work. We
observed the dynamical changes of HFO occurrence
from the start of the recording. The HFO rate was
stable in majority of brain structures and displayed
circadian fluctuations. However, in left middle
temporal gyrus HFO rates were progressively
increasing. After day 8, the HFO rates were stable in
all studied structures, but the quality of signal
deteriorated due to increased number artefacts
leading to higher number of false detections.
4 DISCUSSION
In this study we have demonstrated reliability of
automatic HFO detection in the analysis of long-term
intracranial recordings in humans. Utilization of
automatic detectors is able to reveal circadian and
long-term dynamics of HFO rate. Obtained results
can foster practical implementation of automatic
HFO detecting algorithms into presurgical
examination, dramatically decrease human labour
and increase the information yield of HFOs (Zelmann
et al., 2012).
This study demonstrates the importance of
understanding of long-term spatiotemporal dynamics
of HFO rates for appropriate interpretation of the
obtained results. Dynamical changes in HFO rates
during NREM sleep inside and outside can provide
better localizing information about SOZ than
recordings obtained during the REM sleep or
wakefulness (Clemens et al., 2007; Bagshaw et al.,
2009; Sakuraba et al., 2015).
Figure 4: HFO rate analysis of continuous 14 day recordings. Mean HFO rate across all implanted electrodes and rates from
electrodes which are inside three chosen anatomy structures. Dashed vertical lines are marks of midnights.
Circadian Dynamics of High Frequency Oscillations in Patients with Epilepsy
287

Application of the analysis to data with very long
duration revealed fast dynamical changes of HFO rate
in respect to circadian rhythms, but also slow
ultradian changes which may reflect various
phenomena like effect of anaesthesia, changes
medication, changes in neurotransmitter and
neuromodulator systems, propensity to generate
seizures and tissue response to implanted electrodes
(Haut, 2006; Zijlmans et al., 2009). Future studies
focused on HFOs will be required to gain insight into
the mechanisms responsible for long-term changes in
HFOs dynamics.
Implemented method of sleep and wakefulness
estimation from iEEG records is not optimal and must
be also considered when interpreting result of the
current study. Combination of EOG and EMG
channels with iEEG may substantially increase the
specificity of the PSG parameter to discriminate each
brain states.
ACKNOWLEDGEMENTS
This study was supported by the grants,
SGS15/198/OHK3/3T/13, the Ministry of Health of
the Czech Republic (NT/13357, NT/14489-3), AZV
15-29835A), Neuron Fund for Support of Science
(001/2012) and the Czech Science Foundation
(GACR 14-02634S).
REFERENCES
Akiyama, T. et al., 2011. Focal resection of fast ripples on
extraoperative intracranial EEG improves seizure
outcome in pediatric epilepsy. Epilepsia, 52(10),
pp.1802–1811.
Bagshaw, A.P. et al., 2009. Effect of sleep stage on
interictal high-frequency oscillations recorded from
depth macroelectrodes in patients with focal epilepsy.
Epilepsia, 50(4), pp.617–628.
Balach, J. et al., 2014. Comparison of algorithms for
detection of high frequency oscillations in intracranial
EEG. In 2014 IEEE International Symposium on
Medical Measurements and Applications (MeMeA).
2014 IEEE International Symposium on Medical
Measurements and Applications (MeMeA). pp. 1–4.
Bragin, A. et al., 2002. Interictal high-frequency
oscillations (80–500Hz) in the human epileptic brain:
Entorhinal cortex. Annals of Neurology, 52(4), pp.407–
415.
Brázdil, M. et al., 2010. Interictal high-frequency
oscillations indicate seizure onset zone in patients with
focal cortical dysplasia. Epilepsy Research, 90(1–2),
pp.28–32.
Cho, J.R. et al., 2014. Resection of individually identified
high-rate high-frequency oscillations region is
associated with favorable outcome in neocortical
epilepsy. Epilepsia, 55(11), pp.1872–1883.
Clemens, Z. et al., 2007. Temporal coupling of
parahippocampal ripples, sleep spindles and slow
oscillations in humans. Brain. Available at:
http://brain.oxfordjournals.org/content/early/2007/07/0
5/brain.awm146 [Accessed October 5, 2015].
Crépon, B. et al., 2010. Mapping interictal oscillations
greater than 200 Hz recorded with intracranial
macroelectrodes in human epilepsy. Brain, 133(1),
pp.33–45.
Eickhoff, S. et al., 2005, A new SPM toolbox for combining
probabilistic cytoarchitectonic maps and functional
imaging data. NeuroImage 25(4), pp. 1325-1335.
Fujiwara, H. et al., 2012. Resection of ictal high-frequency
oscillations leads to favorable surgical outcome in
pediatric epilepsy. Epilepsia, 53(9), pp.1607–1617.
Haegelen, C. et al., 2013. High-frequency oscillations,
extent of surgical resection, and surgical outcome in
drug-resistant focal epilepsy. Epilepsia, 54(5), pp.848–
857.
Haut, S.R., 2006, Seizure clustering. Epilepsy & Behavior,
8(1), pp.50-55.
Jacobs, J. et al., 2009. High frequency oscillations in
intracranial EEGs mark epileptogenicity rather than
lesion type. Brain, 132(4), pp.1022–1037.
Jacobs, J. et al., 2008. Interictal high-frequency oscillations
(80–500 Hz) are an indicator of seizure onset areas
independent of spikes in the human epileptic brain.
Epilepsia, 49(11), pp.1893–1907.
Jacobs, J. et al., 2010, High frequency
electroencephalographic oscillations correlate with
outcome of epilepsy surgery.
Ann Neurology, 67,
pp.209-220.
Janca, R. et al., 2014. Detection of Interictal Epileptiform
Discharges Using Signal Envelope Distribution
Modelling: Application to Epileptic and Non-Epileptic
Intracranial Recordings. Brain Topography, 28(1),
pp.172–183.
Kerber, K. et al., 2013. High frequency oscillations mirror
disease activity in patients with focal cortical dysplasia.
Epilepsia, 54(8), pp.1428-1436.
Litt, B. et al., 2001. Epileptic Seizures May Begin Hours in
Advance of Clinical Onset: A Report of Five Patients.
Neuron, 30(1), pp.51–64.
Marsh, E.D. et al., 2010. Interictal EEG spikes identify the
region of electrographic seizure onset in some, but not
all, pediatric epilepsy patients. Epilepsia, 51(4),
pp.592–601.
Sakuraba, R. et al., 2015. High frequency oscillations are
less frequent but more specific to epileptogenicity
during rapid eye movement sleep. Clinical
Neurophysiology: Official Journal of the International
Federation of Clinical Neurophysiology.
Staba, R.J. et al., 2002. Quantitative analysis of high-
frequency oscillations (80-500 Hz) recorded in human
epileptic hippocampus and entorhinal cortex. Journal of
Neurophysiology, 88(4), pp.1743–1752.
BIOSIGNALS 2016 - 9th International Conference on Bio-inspired Systems and Signal Processing
288

Thornton, R. et al., 2011. Epileptic networks in focal
cortical dysplasia revealed using
electroencephalography–functional magnetic
resonance imaging. Annals of Neurology, 70(5),
pp.822–837.
Urrestarazu, E. et al., 2007. Interictal high-frequency
oscillations (100–500 Hz) in the intracerebral EEG of
epileptic patients. Brain, 130(9), pp.2354–2366.
Worrell, G.A. et al., 2008. High-frequency oscillations in
human temporal lobe: Simultaneous microwire and
clinical macroelectrode recordings. Brain, 131(4),
pp.928–937.
Zelmann, R. et al., 2012. A comparison between detectors
of high frequency oscillations. Clinical
Neurophysiology, 123(1), pp.106–116.
Zijlmans, M. et al., 2009. High-Frequency oscillations
mirror disease activity in patients with epilepsy.
Neurology, 75, pp.979-986.
Circadian Dynamics of High Frequency Oscillations in Patients with Epilepsy
289
