
Motion Classification for Analyzing the Order Picking Process using
Mobile Sensors
General Concepts, Case Studies and Empirical Evaluation
Sascha Feldhorst
1
, Mojtaba Masoudinejad
1
, Michael ten Hompel
1
and Gernot A. Fink
2
1
Chair of Materials Handling and Warehousing, TU Dortmund University, Dortmund, Germany
2
Pattern Recognition Group, TU Dortmund University, Dortmund, Germany
Keywords:
Motion Classification, Order Picking, Mobile Sensors, Pattern Recognition, Logistics, Materials Handling.
Abstract:
This contribution introduces a new concept to analyze the manual order picking process which is a key task
in the field of logistics. The approach relies on a sensor-based motion classification already used in other
domains like sports or medical science. Thereby, different sensor data, e. g. acceleration or rotation rate, are
continuously recorded during the order picking process. With help of this data, the process can be analyzed
to identify different motion classes, like walking or picking, and the time a subject spends in each class.
Moreover, relevant motion classes within the order picking process are defined which were identified during
field studies in two different companies. These classes are recognized by a classification system working with
methods from the field of statistical pattern recognition. The classification is done with a supervised learning
approach for which promising results can be shown.
1 INTRODUCTION
Since 1999 e-commerce has been growing contin-
uously especially in the retail sector. For instance
in Germany, e-commerce companies have increased
their sales for the last 5 years on average by 10 percent
per year (HDE, 2014). It is forecasted that more than
40 billion euro will be spent online in 2015 alone. Due
to this sustained growth, the relevance of industrial
order picking has significantly changed for producers
and retailers since the beginning of the e-commerce
boom in 1999. Within the order picking process,
stored articles are collected in a given quantity to sat-
isfy customer orders. Today this process has a major
impact on the customer service and consequently on
the competitiveness (de Koster et al., 2006).
As manual work is one of the main cost drivers es-
pecially in high-wage countries, the duration of man-
ual materials handling processes is crucially impor-
tant for the operation and planing of industrial or-
der picking systems. The knowledge of time quotas
of manual tasks helps to find optimization potentials
within the process, to estimate the performance and
to determine the amount of staff required to fulfill the
customer orders (Krengel et al., 2010, p.5). Currently,
time measurement approaches like REFA or Methods
Time Measurement (MTM) only allow for the quan-
tification of average time values or the definition of
standard times (Krengel et al., 2010, p.5). Thus, im-
portant process information like the travel or gripping
time can only be estimated, but not automatically de-
termined for a given system. Even modern Warehouse
Management Systems (WMS) and corporate databases
are not able to fill this lack of knowledge. For in-
stance, a WMS usually saves how many order lines
a worker acknowledged during a time period, but it
is unknown how many picks were needed to process
these order lines (ten Hompel and Schmidt, 2007).
Within this context, our goal is to develop a new
way to analyze the order picking process and to gain
new insights into this important part of corporate lo-
gistics. Therefore, we utilize mobile sensors and mo-
tion classification. Body-worn sensors collect physi-
cal data, like accelerations, rotation rates and changes
in the magnitude of the surrounding magnetic field
while the order picker is working. By identifying pat-
terns in the data, executed motions and corresponding
process steps can be recognized, quantified and ana-
lyzed. Therefore, multiple field studies were carried
out, to identify relevant motions and to collect real
process data for the development of a classification
system. Two of these field studies with five different
subjects are considered within this paper.
706
Feldhorst, S., Masoudenijad, M., Hompel, M. and Fink, G.
Motion Classification for Analyzing the Order Picking Process using Mobile Sensors - General Concepts, Case Studies and Empirical Evaluation.
DOI: 10.5220/0005828407060713
In Proceedings of the 5th International Conference on Pattern Recognition Applications and Methods (ICPRAM 2016), pages 706-713
ISBN: 978-989-758-173-1
Copyright
c
2016 by SCITEPRESS – Science and Technology Publications, Lda. All rights reserved

The remainder of this article is organized as fol-
lows: After the introduction and related works, we
present our overall approach as part of our ongoing
research. Afterwards, the field studies and the derived
classification method are described. This contribution
closes with evaluation results of the proposed method.
2 RELATED WORK
In the field of logistics, different statistical and
simulation-based approaches have been investigated
during the last years to understand the characteris-
tics of manual process steps and to identify the fac-
tors that affect the time consumption of these steps.
For instance, in (Krengel et al., 2010) the process
time is modeled with help of probability distributions.
Further works in this area address the measurement
of person specific performance metrics (Siepenkort,
2013) or the identification of factors that have impact
on the performance of a worker (Stinson et al., 2014).
A non-statistical approach is presented in
(G
¨
unthner and Steghafner, 2011) containing a
virtual-reality-based planing tool which utilizes a
simulation model of the planned system to estimate
order picking time. For that, a head-mounted display,
gloves with markers and a modified treadmill are
used. In this paper, we are looking at the problem
from a different perspective and try to gain insights
into the order picking process by reducing the effort
of measurements in existing systems. Consequently,
we want to automate the measurement procedure and
parts of the process analysis like the determination of
the travel time. Thus, we investigate the possibilities
of activity recognition and motion classification like
being already employed in other domains, e. g. in
medical science, sports or entertainment.
In medical science, sensor-based analysis of hu-
man movements and behavior is deployed especially
for the detection and treatment of diseases which im-
pact on the musculoskeletal system. This includes pa-
tients with strokes or neurodegenerations like Parkin-
son’s disease (Bidargaddi et al., 2007), (Dobkin et al.,
2011), (Zhu et al., 2012).
Another field of research related to the medical
context is Ambient Assisted Living (AAL). AAL aims
at the adaption of ICT-technologies helping elderly
people living by themselves performing their daily
activities and increasing their quality of life (Bravo
et al., 2012, p.34). Therefore, the environment and
the people are equipped with technical artifacts which
among others detect anomalies, e. g. medical emer-
gencies (Jeong et al., 2014), (Fern
´
andez-Llatas et al.,
2013). The recognition of behavior and activities in
AAL is summarized by the term Activities of Daily
Life Monitoring (Zouba et al., 2008). As the focus of
this application lies on the detection of anomalies, the
deployed methodologies are not promising candidates
for our goal, as we want to particularly understand the
complete order picking process.
Many popular applications for motion classifi-
cation and activity recognition were developed for
sports and fitness. In this case consumer electron-
ics devices like smartphones and wearables or even
clothes which are equipped with inertial sensors are
used to quantify the physical activities of a sub-
ject. This allows to monitor the health and train-
ing state (Long et al., 2009), (Toney et al., 2006),
(Linz et al., 2006). Especially for professional ath-
letes, sport-specific solutions are available to collect
this data from daily training (Auvinet et al., 2002),
(B
¨
achlin et al., 2008), (Hardegger et al., 2015).
Within the production domain, different activity
recognition approaches have been put forward to ana-
lyze manual manufacturing processes. For instance,
(Hartmann, 2011) introduces a concept to measure
and dissect the behavior of workers executing assem-
bling tasks. Optical markers, cameras, IMUs and a
multi-layer activity recognition are proposed there. A
different approach can be found in (Koskim
¨
aki et al.,
2013) and (Siirtola, 2015). Among others, the authors
address the distinction of different tools the worker
utilizes within the manufacturing process. While all
mentioned works in this field separate data acqui-
sition and data evaluation, (Stiefmeier, 2008) intro-
duces an approach supporting activity recognition in
real-time with the help of a string matching method.
In summary, in production different activity recogni-
tion and motion classification approaches exist which
address the special requirements of manual manu-
facturing tasks. As those tasks usually occur in a
bounded area and mostly consist of upper limb move-
ments, the existing methods do not meet the special
requirements of the order picking process which in-
cludes many context-dependent motions and activities
of the whole body (e. g. driving, walking).
3 APPROACH
To recognize human activities and motions in order
picking, different levels of detail can be identified.
These range from structured motions which are re-
peated periodically like walking or driving to more
complex activities like packing. Especially the pack-
ing of orders consists of multiple sub tasks: setting
up a shipping box, filling it, applying a shipping label
and finally closing the box.
Motion Classification for Analyzing the Order Picking Process using Mobile Sensors - General Concepts, Case Studies and Empirical
Evaluation
707
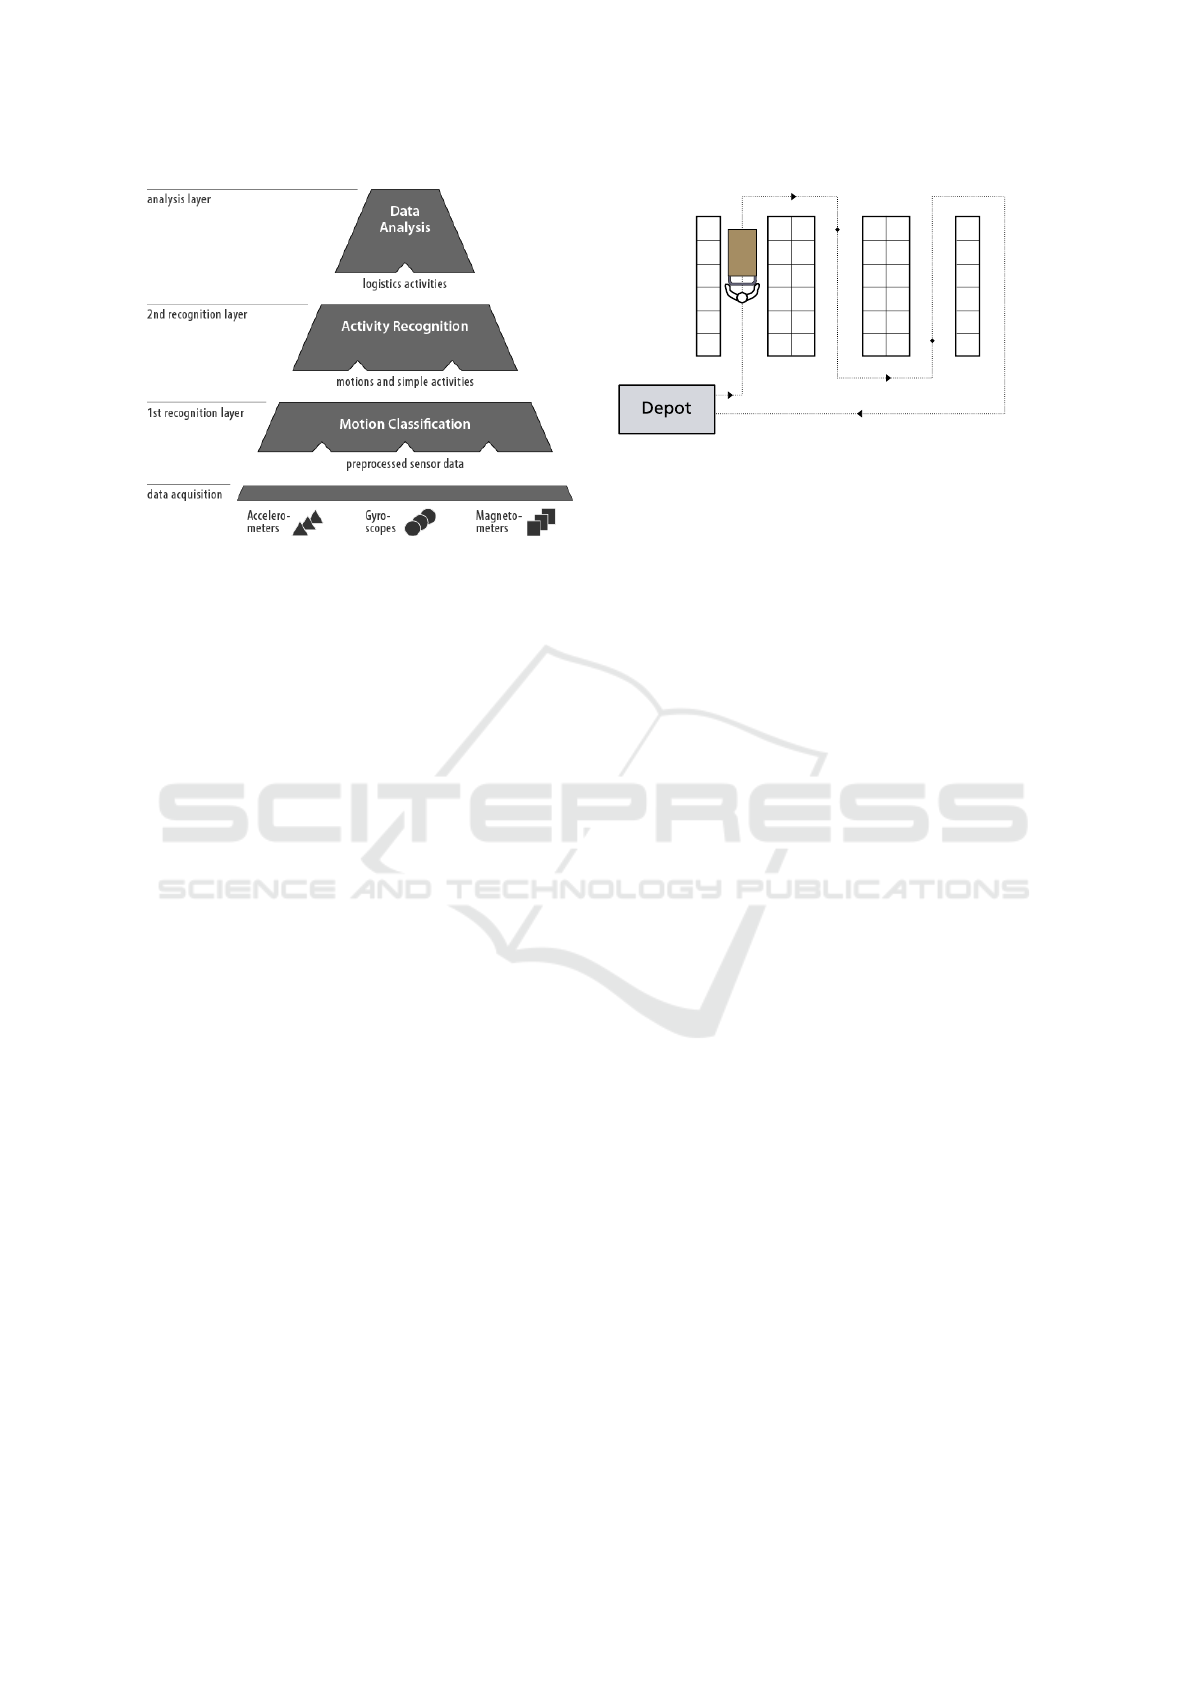
Figure 1: Layered architecture of our approach.
Hence, we decided to use a layered structure for
the overall approach like it has already been done
in other related works (Hartmann, 2011), (Siirtola,
2015). The resulting structure is shown in Figure 1.
The inertial sensors provide the values for the motion
classification on the data acquisition layer. Within
the first recognition layer, recurring motions and sim-
ple activities (e. g. process order line) are identified
which are inputs for the activity recognition. On the
second recognition layer these inputs are composed to
relevant order picking activities before they are auto-
matically processed on the analysis layer.
As our research is still work in progress, this paper is
solely addressing results of the motion classification
layer. In future publications, we are planning to report
on the other levels of our approach.
4 FIELD STUDIES
Based on the organization, material flow and technical
equipment, order picking systems can be divided into
different classes. For example, (Venn and Geißen,
2011) identify 8 classes of order picking systems by
the way a source unit is transformed into a target
unit with help of an order picker. However, in real-
world systems members of the same class differ sig-
nificantly in terms of motions and tasks that are exe-
cuted by the pickers. As these differences are not well
documented in the available literature, we decided to
carry out multiple field studies to gain insights into
the order picking process and to collect reliable mo-
tion data for the evaluation of our work.
In this paper, we consider two comparable order
picking scenarios from different companies. Both
systems are operated manually, meaning that the
goods are stored in racks and the order picker trav-
Figure 2: Example of a manual order picking system.
els through the storage to gather all lines from a given
order list (cf. Fig. 2). Each article is stored inside a
dedicated order box which is placed on a cart. In sys-
tem A, the orders are provided on paper while workers
in system B are using hand-held devices with a WiFi
connection for this purpose. Both systems have a so
called depot which is a dedicated place inside the sys-
tem where every order begins and ends. Moreover, in
the storage, all goods are assigned to static places.
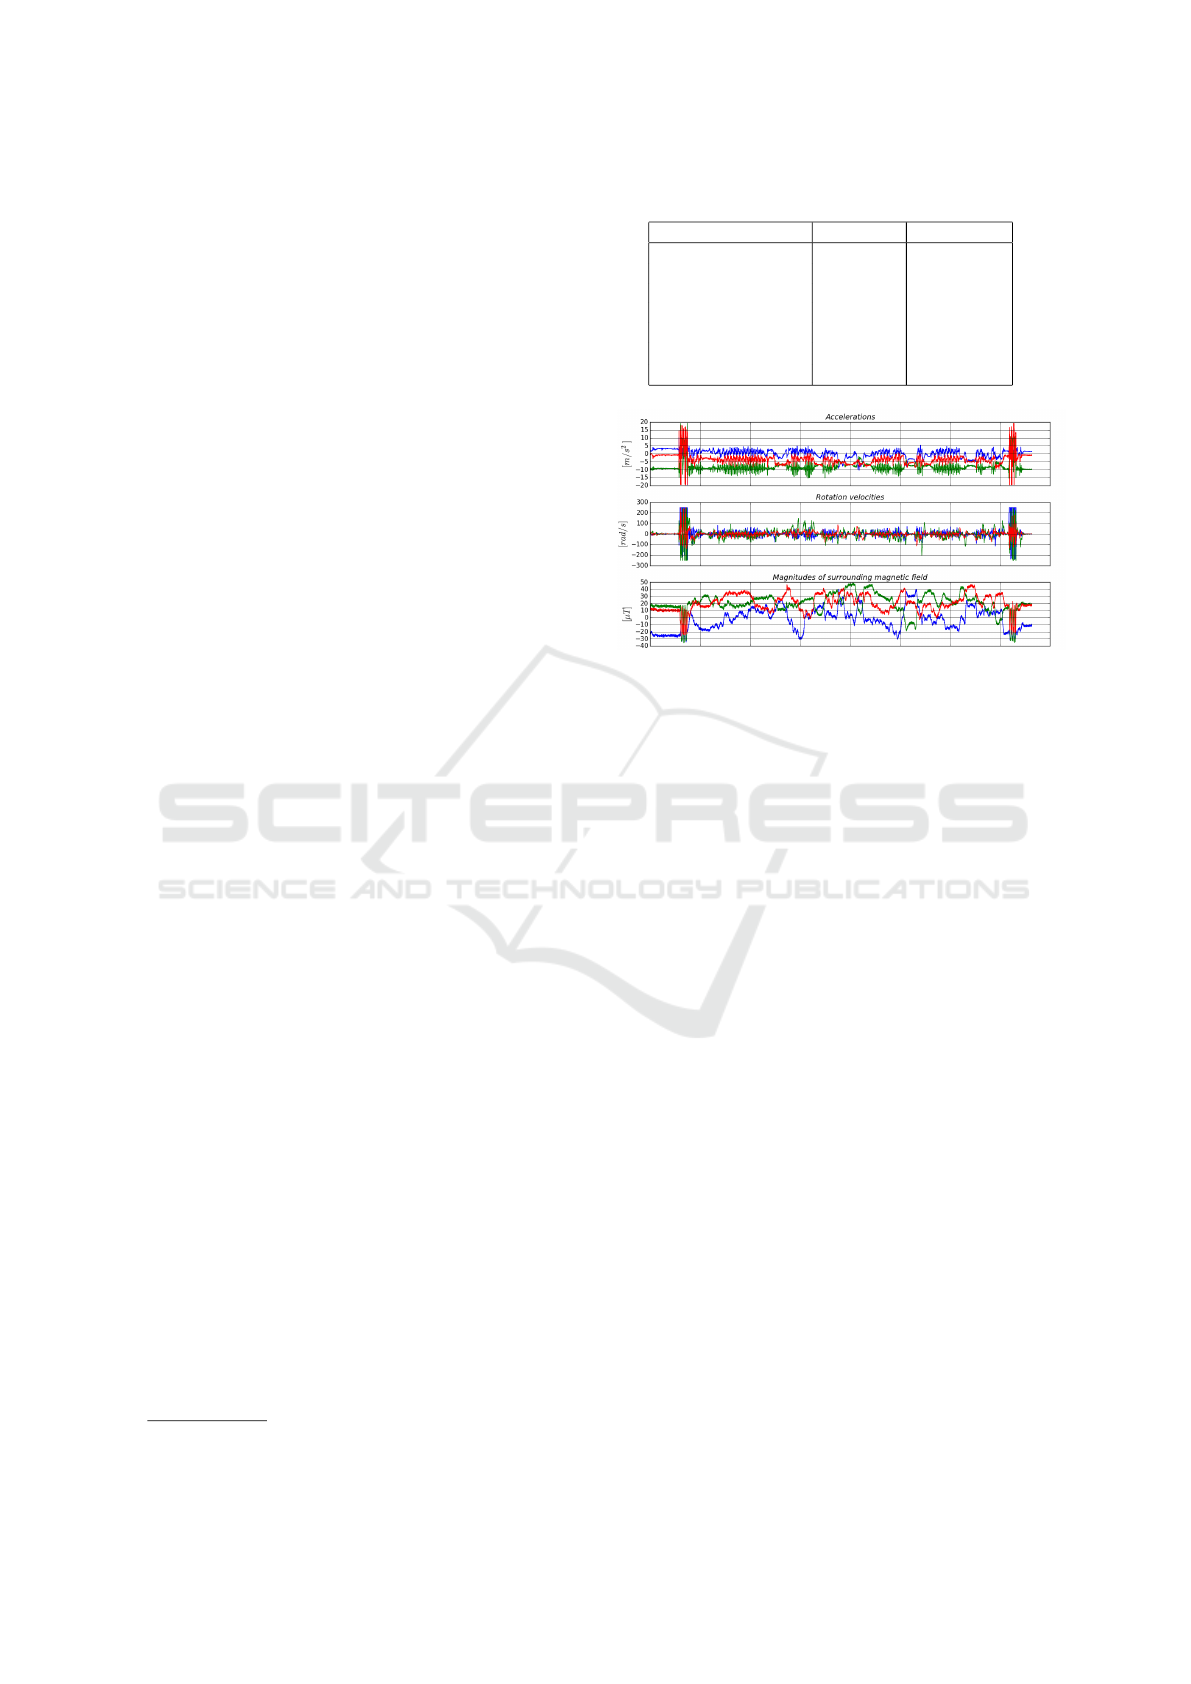
4.1 Measurement Equipment
In order to gather the motion data during our measure-
ments, three dedicated Intertial Measurement Units
(IMU) were used, mounted to the arms and torso of
the subjects. Every IMU consists of an accelerome-
ter, gyroscope and magnetometer whereby every sin-
gle sensor provides values in three spatial dimensions.
These sensors measure the linear acceleration [
m
/s
2
],
the angular velocity [
rad
/s] and the magnitude of the
surrounding magnetic field [µT ]. Additionally, we use
a smartphone with an integrated IMU and a measure-
ment app. This allows to compare the data retrieved
from dedicated IMUs with data collected from con-
sumer electronics devices. Beside raw sensor values,
the dedicated IMUs provide data concerning the ori-
entation of the unit related to an earth reference frame.
The orientation is estimated in real-time using inter-
nal preprocessing based on Kalman filtering.
Currently, all sensors are controlled by means of
Bluetooth and store the measurement results on the
corresponding device. While the dedicated IMUs
save values from all three sensors at a fixed rate (usu-
ally 100 Hz), the smartphone only provides a best ef-
fort service. This means, the operating system of the
phone triggers events for every single sensor at differ-
ent rates. While in the first case all 13 IMU values
(9 raw sensor values and a unit quaternion) are stored
together with the same timestamp, the phone creates
separate entries for all sensors with different times-
tamps and varying rates.
ICPRAM 2016 - International Conference on Pattern Recognition Applications and Methods
708

Figure 3: Measurements at the depot of system A.
For the annotation of the collected motion data, all
measurement runs are recorded on video camera. To
simplify the synchronization of sensor values and the
camera recordings, an evident start/stop-motion was
used. Figure 3 shows the utilized measurement equip-
ment in a real scenario from system A.
4.2 Process and Motion Analysis
Order picking systems have two characteristics that
are helpful when realizing activity recognitions and
motion classifications. At first, from a process point
of view, order picking is very structured compared
to most every day activities. This means, it consists
of distinguishable process steps which have a logi-
cal goal and occur in a system-specific sequence. In
picker-to-parts order picking systems, the picker usu-
ally has to execute the following steps for every order
line: proceed to next storage bin, identify storage bin,
grap given amount of articles, place these in order box
and acknowledge order line. Secondly, in materials
handling many process steps occur in an specific en-
vironment or context. For instance, an order is started
and stopped at the depot while an order line is picked
inside the storage area. Thus, beside the identifica-
tion of motion classes, another goal of our field stud-
ies was to learn more about the places where certain
activities and motions are carried out.
During the video analysis, some observations
were made which should be considered for the de-
velopment of a motion classification in this field. For
instance, the technical artifacts used to guide the or-
der picker through the process like pick lists, hand-
helds, pick-by-light or pick-by-voice systems have a
big impact on the motions occurring within the pro-
cess. Furthermore, depending on the order lines, the
executed motions can differ in terms of sequence and
concurrency. Other results of this analysis and their
implications will be addressed in a future publication.
However, from a logical point of view, the ex-
ecuted process steps were almost identical in both
systems: First, every order was started at the depot.
This included the retrieval of order information and
box(es) which are used to carry the picked items.
Then, every order line was processed like described
above. The main difference between system A and B
is how the order lists and acknowledgments are real-
ized. While in system A pen and paper are used, in
system B the picker carries a mobile terminal with an
integrated barcode scanner. For every order line the
picker needs to grab the item, scan its barcode as well
as the barcode of the box, and finally place it in there.
As most of these process steps contribute to a cer-
tain part of the order picking time (e. g. travel or pick-
ing time), it seems reasonable for the future analy-
sis to utilize these process steps for the definition of
motion classes. Consequently, the following classes
were defined: START ORDER, RETRIEVE BOX, INFO,
WALK, SEARCH, PICK, ACK and CLOSE ORDER. Even,
if the scanning of a barcode belongs logically to the
acknowledgment of an order line, we added a sep-
arate class SCAN to check if the classifiers are able
to distinguish this motion from the others. Further-
more, we introduced additional classes to deal with
the start/stop-motion, to omit certain parts of a mea-
surement and to handle gaps in the annotations. These
classes are called: FLIP, NULL and UNKNOWN.
5 METHOD
The proposed method works on time series data col-
lected from the inertial sensors with a sampling rate f .
We used classifiers from the field of statistical pat-
tern recognition together with a supervised learning
approach. With help of the classes identified during
the process and motion analysis, the sensor data is
labeled and prepared for the use within the method.
To analyze the performance of standard classifiers on
motion data from order picking processes, we chose
Support Vector Machines (SVM), Bayes and Random
Forests classifiers.
5.1 Features
For the classification of human motions, different sta-
tistical measures from the time domain have shown
to work well (Bulling et al., 2014). This includes
minimum, maximum, mean, standard deviation and
the norm. Additionally, the magnitudes of the sig-
nal vectors are considered as features, because they
are independent of the orientation of the sensors (Figo
et al., 2010). Retrieving the six features mentioned
before from the nine raw sensor values (three per
IMU) yields 54 dimensional feature vectors which are
classified by our method. Every feature vector is de-
rived by means of a sliding window approach.
Motion Classification for Analyzing the Order Picking Process using Mobile Sensors - General Concepts, Case Studies and Empirical
Evaluation
709
5.2 Windowing
The feature computation, classification and evaluation
in this work are done based on a sliding time window
approach dividing the sensor signals into equal-sized
sequences which are called windows (Oppenheim and
Schafer, 1999). In this process, the window length w
is usually significantly bigger than the time between
two subsequent sensor measurements (
1
/f ).
To recognize the motions of the order picker, the
goal is actually to find the corresponding motion class
for each inertial measurement. However, when work-
ing with the sliding window method, the sensor val-
ues are not mapped separately to the corresponding
classes. Instead, each window is classified as a whole
and labeled with a motion class.
Adjacent windows can be overlapping which usu-
ally results in a more accurate classification (Siirtola,
2015). Thus, the value of overlap is another parameter
for the determination of windows. In our approach, a
fixed step size s is used to move windows forward at
a constant time rate of s seconds at a time. This was
done to ease the implementation and to make it robust
for sensor values with variable sampling rate like they
are usually provided by smartphones.
5.3 Classification
As already mentioned before, our classification ap-
proach utilizes three classifiers from the field of sta-
tistical pattern recognition, being SVMs, Bayes and
Random Forest classifiers. All of them were already
used for motion classification and activity recognition
and showed promising results. This was done, to learn
more about their strength and weaknesses on motion
data gathered from the order picking process. While
currently every classifier works isolated, we are plan-
ning to use ensembles of these classifiers in the future.
6 EVALUATION
The proposed classification was evaluated in two
steps. At first, three data sets from system A and sys-
tem B were used, to carry out separate 3-fold cross
validations. Further details concerning the data sets
which were used during the evaluation can be seen in
table 1 and an example plot of the sensor measure-
ments in figure 4.
Then, cross-system experiments were done. During
these experiments, models which were trained on sys-
tem A were used to classify test data from system B
1
T=torso, L=left arm, R=right arm
Table 1: Details of the measurement data.
Characteristics System A System B
Subjects 3 Pers. 2 Pers.
Data sets 3 3
Total duration 10 min. 23.5 min.
Orders per data set 1 order 3 - 5 orders
Sensors 3 IMU 3 IMU
Sensor mounting
1
T, L, R T, L, R
Sampling rate 100 Hz 100 Hz
Figure 4: Plots from all inertial sensors of an IMU. The
data was recorded in system A and the sensor was mounted
to the subjects torso.
and vice versa. This was done to gain first insights
concerning the transferability of models between or-
der picking systems from the same class referring to
(Venn and Geißen, 2011) with differences in their
technical realization (here: pick list vs. handheld).
During all experimental runs, the window length w
and the step size s were varied to derive the
impact of these parameters on the classification
rate whereas w ∈ {1.0, 1.5,2.0,2.5,3.0} and s ∈
{0.036,0.125, 0.25,0.5,1.0}. The classification rate
c was determined from the error rate e accounting for
all misclassified windows of an experiment:
c = 1 −e
As mentioned before, the whole evaluation is
based on overlapping time windows and for each win-
dow the features are calculated. Therefore, we started
an evaluation run with labeled sensor values which
were recorded every t
s
= 10 ms (when f = 100 Hz).
These labels were generated with help of a manual
video analysis. In order to use this data within an ex-
periment, for every pair of w and s a new set of win-
dows is required. Beside the features, for every win-
dow, a label must be chosen from the labels related to
the corresponding sensor values. The window label
is derived using a majority voting of all sensor values
inside the window. In case of a tie, the label with the
lowest index is used.
Due to the nature of the observed motions at the
depots of both order picking systems, it was decided
to omit these motions from the evaluation, because
ICPRAM 2016 - International Conference on Pattern Recognition Applications and Methods
710
annotation was rather complex. Thus, the NULL class
was used during the annotation and all values in these
time spans were set to zero. This reduced the classes
to: INFO, WALK, SEARCH, PICK, ACK, SCAN, FLIP, NULL
and UNKNOWN.
6.1 Single-system Experiments
Within the single system experiments, all data sets
used for training and evaluation were taken from the
same system. The results of the classifiers used for
system A and system B with different subjects in the
test set are shown in Tab. 2 and Tab. 3. Note that the
Random Forest classifier shows the most stable per-
formance in both systems over all three motion data
sets with better results for system B. As SVM using
RBF kernels performed rather poorly, linear kernels
were used instead which achieved much better results
on this time series analysis.
Table 2: Results of the three-fold cross validation for the
motion classification using recordings from three different
subjects P01, P02 and P03 (system A, w = 2.0, s = 1.0).
Test SVM Bayes RandForest
P01 69.5 % 67.6 % 72.9 %
P02 63.8 % 62.3 % 73.9 %
P03 68.6 % 73.3 % 71.0 %
Avg. 67.3 ± 3.1 % 67.7 ± 5.5 % 72.6 ± 1.5 %
Table 3: Results of the three-fold cross validation for the
motion classification using recordings from two different
subjects P01 and P02 (system B, w = 3, s = 0.25).
Test SVM Bayes RandForest
P01 64.0 % 64,5 % 84.2 %
P02 a 74.6 % 73.2 % 85.5 %
P02 b 83.0 % 83.9 % 87.2 %
Avg. 73.9 ± 9.5 % 73.9 ± 9.7% 85.6 ± 1.5 %
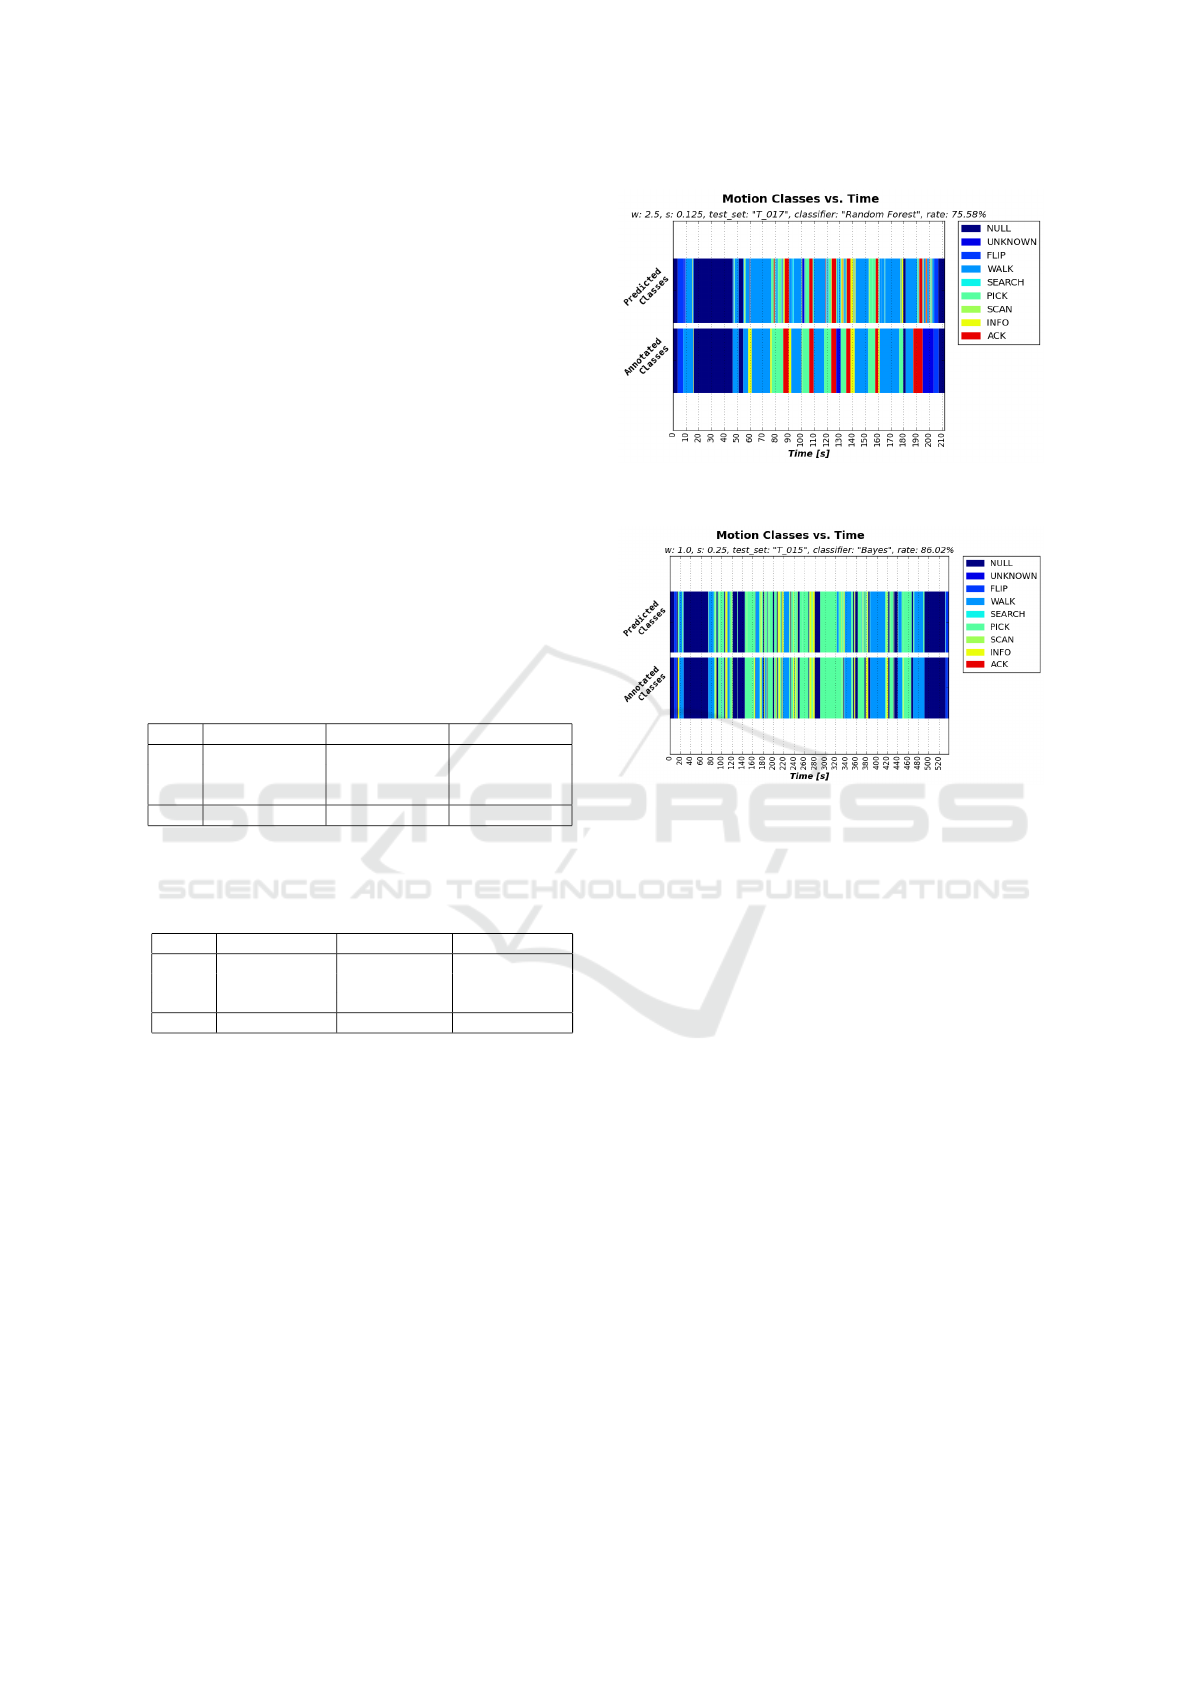
In figures 5 and 6 two classes vs. time plots can be
seen. Those plots clearly show how the order picking
process was executed and how much time the picker
spent in each class. For instance, it can be seen that in
system A the picker walked to a stored article, picked
it and acknowledged the corresponding order line on
his paper list. In system B on the other hand many
articles were picked at the same place and the articles
were stored close to each other. This becomes evi-
dent, since the time spent in the class WALK in this ex-
ample is significantly shorter compared to system A.
Here, it should be mentioned that system A and B
were annotated in a slightly different way. While the
difference between the classes INFO and ACK are ob-
vious in a paper-based system, it was not easy to see
the difference for system B using the handheld de-
vice. Thus, we decided to label every interaction with
Figure 5: Example of a classes vs. time plot generated using
a Random Forest classifier (system A).
Figure 6: Example of a classes vs. time plot generated using
a Bayes classifier (system B).
the handheld with the class INFO.
Figure 7 shows that the variation of w and s had
no big impact on the classification quality which was
the case for most experiments. This can be explained
with the selection of the considered window lengths
and step sizes, as those were chosen based on our ex-
periences from manual time measurements.
6.2 Multi-system Experiments
During the multi-system experiments, the best per-
forming models from one system and three test data
sets from the other system were selected. Those test
data sets were then classified and compared to the an-
notated data. The results of this transferability test
show a reduced classification rate. This can be ex-
plained by the mismatch of training and testing condi-
tions, the limited number of training samples and the
differences between both systems in terms of picker
guidance (pick list vs. handheld). We are planning
to improve these results with help of adaption tech-
niques and a scenario detection.
Motion Classification for Analyzing the Order Picking Process using Mobile Sensors - General Concepts, Case Studies and Empirical
Evaluation
711
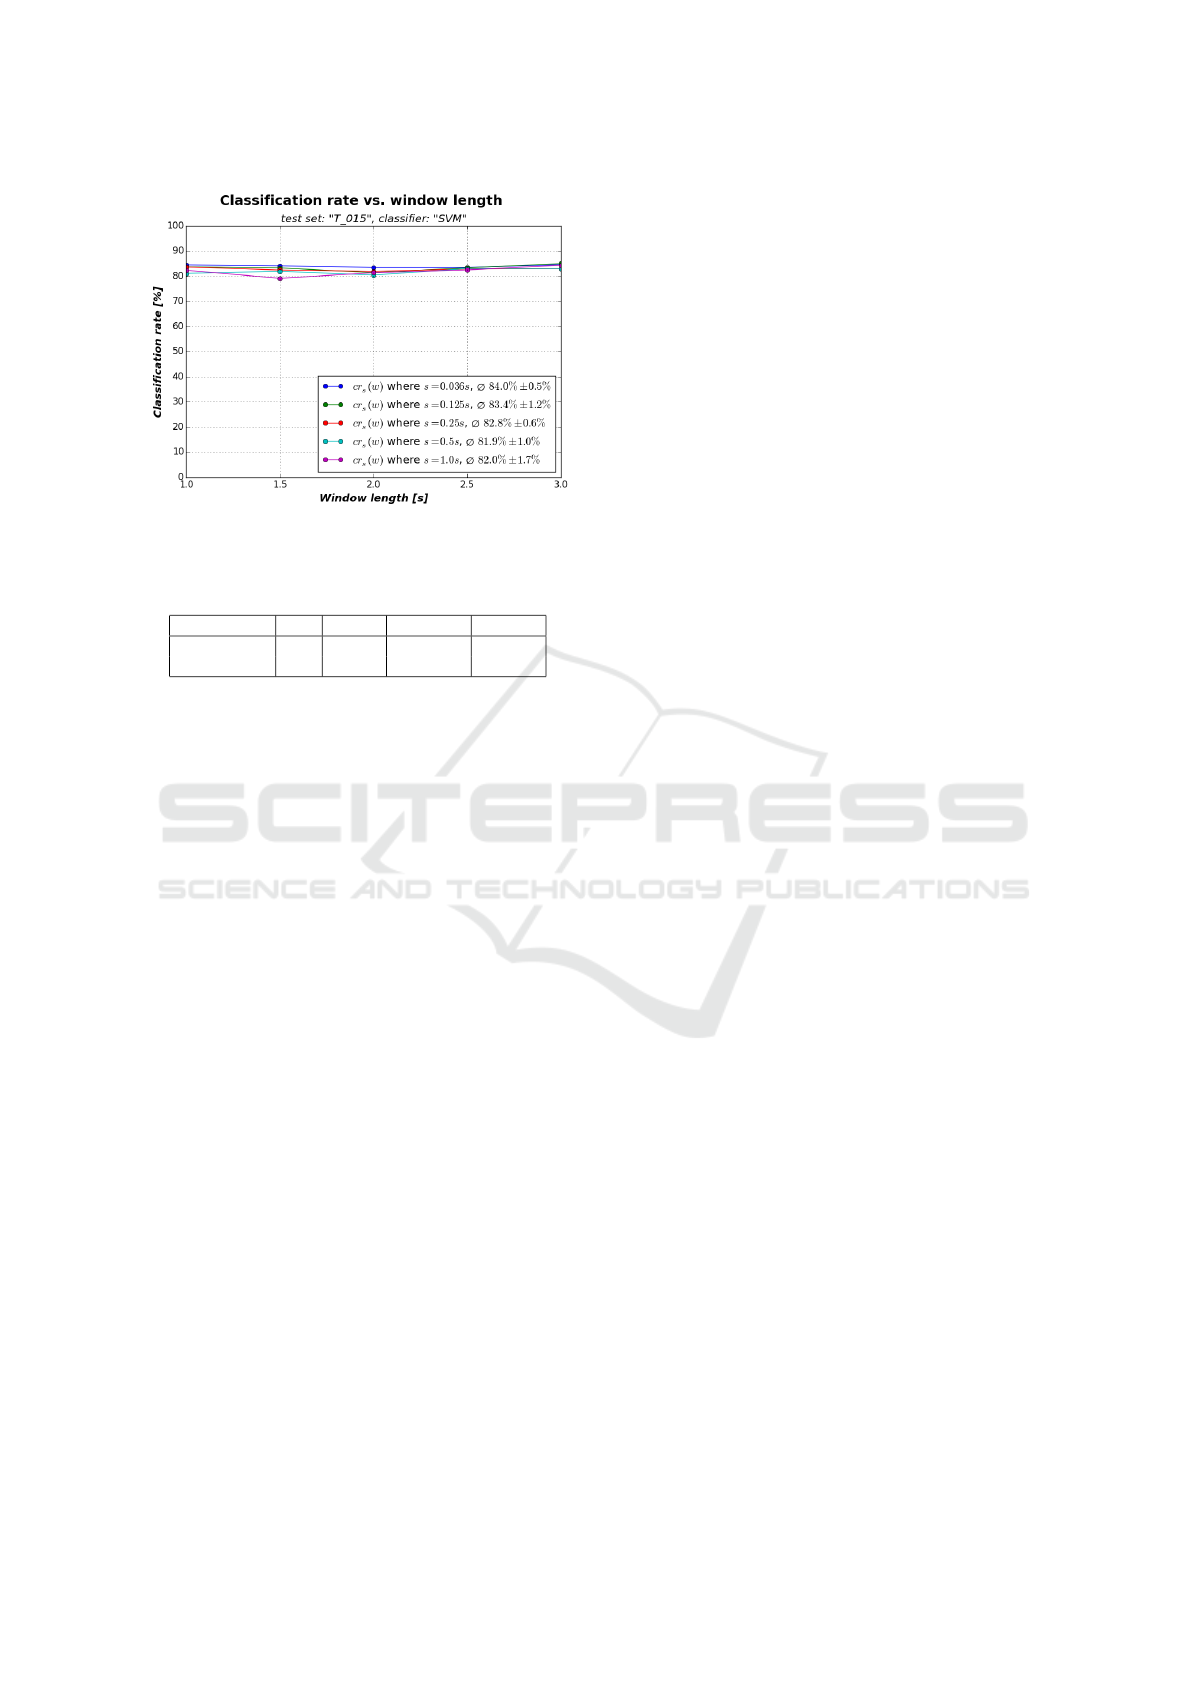
Figure 7: Impact of variation of w and s on c.
Table 4: Results of the multi-system experiments using the
best performing models of the single-system experiments.
Classifier w s Transfer c
RandForest 2.5 0.125 A → B 71.8 %
RandForest 2.0 0.500 B → A 64.8 %
7 CONCLUSION
In this paper a layered method for the analysis of man-
ual order picking systems was introduced which au-
tomates the measurement procedure of different pro-
cess aspects. Especially travel and picking times can
be quantified with help of our approach. Therefore, a
data acquisition based on inertial sensors (integrated
in smartphones and dedicated devices) as well as a
motion classification and activity recognition based
on supervised machine learning methods are utilized.
As part of our ongoing research, this paper focused
on the motion classification being the first layer of
the automated recognition. On this layer, classifiers
from the field of statistical pattern recognition and
an adopted sliding window approach are deployed.
To identify motion classes and to learn about system
characteristics affecting the motions of order pickers,
field studies were carried out. Two of these were pre-
sented and used for the evaluation of our classifica-
tion. The evaluation showed promising results with
potential for further improvements. Beside single-
system experiments, we also carried out multi-system
experiments to test the transferability of the classifi-
cation models.
Our future works will focus on the improvement
of the classification as well as the development of
the activity recognition and automated data analysis.
Among others, we want to improve the preprocessing
and introduce new features, like the orientation of the
sensors and the context of the measured inertial data.
ACKNOWLEDGEMENTS
Part of the work on this paper has been funded
by Deutsche Forschungsgemeinschaft (DFG) within
the Collaborative Research Center SFB 876 ”Provid-
ing Information by Resource-Constrained Analysis”,
project A4.
REFERENCES
Auvinet, B., Gloria, E., Renault, G., and Barrey, E. (2002).
Runner’s stride analysis: Comparison of kinematic
and kinetic analyses under field conditions. Science
& Sports, 17(2):92–94.
B
¨
achlin, M., Forster, K., Schumm, J., Breu, D., Germann,
J., and Troster, G. (2008). An automatic parameter
extraction method for the 7x50m stroke efficiency test.
In Proceedings of IPCA, volume 1, pages 442–447.
Bidargaddi, N., Sarela, A., Klingbeil, L., and Karunanithi,
M. (2007). Detecting walking activity in cardiac re-
habilitation by using accelerometer. In IEEE, editor,
Intelligent Sensors, Sensor Networks and Information,
2007., pages 555–560.
Bravo, J., Herv
´
as, R., and Rodr
´
ıguez, M. (2012). Am-
bient Assisted Living and Home Care: 4th Inter-
national Workshop, IWAAL 2012, Vitoria-Gasteiz,
Spain, December 3-5, 2012. Proceedings. Lecture
Notes in Computer Science. Springer Berlin Heidel-
berg, Berlin, Heidelberg.
Bulling, A., Blanke, U., and Schiele, B. (2014). A tutorial
on human activity recognition using body-worn iner-
tial sensors. ACM Computing Surveys, 46(3):1–33.
de Koster, R., Le-Duc, T., and Roodbergen, K. J. (2006).
Design and control of warehouse order picking: a lit-
erature review, volume 2006,005 of ERIM report se-
ries research in management Business processes, lo-
gistics and information systems. ERIM, Rotterdam.
Dobkin, B. H., Xu, X., Batalin, M., Thomas, S., and Kaiser,
W. (2011). Reliability and validity of bilateral ankle
accelerometer algorithms for activity recognition and
walking speed after stroke. Stroke; a journal of cere-
bral circulation, 42(8):2246–2250.
Fern
´
andez-Llatas, C., Benedi, J.-M., Garc
´
ıa-G
´
omez, J. M.,
and Traver, V. (2013). Process mining for indi-
vidualized behavior modeling using wireless track-
ing in nursing homes. Sensors (Basel, Switzerland),
13(11):15434–15451.
Figo, D., Diniz, P. C., Ferreira, D. R., and Cardoso, J. M.
(2010). Preprocessing techniques for context recogni-
tion from accelerometer data. Personal and Ubiqui-
tous Computing, 14(7):645–662.
G
¨
unthner, W. A. and Steghafner, A. (2011).
Kommissioniersystem-Planung mit VR: KomPlanVR ;
Forschungsbericht ;. Technische Univ, M
¨
unchen.
Hardegger, M., Ledergerber, B., Mutter, S., Vogt, C., Seiter,
J., Calatroni, A., and Tr
¨
oster, G. (2015). Sensor tech-
nology for ice hockey and skating. In Proceedings of
ICPRAM 2016 - International Conference on Pattern Recognition Applications and Methods
712

the 12th Annual Body Sensor Networks Conference.
IEEE.
Hartmann, B. (2011). Human worker activity recognition in
industrial environments: KIT, Diss.–Karlsruhe, 2011.
KIT Scientific Publishing, Karlsruhe.
HDE (2014). B2c-E-Commerce-Umsatz in Deutschland in
den Jahren 1999 bis 2014 sowie eine Prognose f
¨
ur
2015 (in Milliarden Euro).
Jeong, S. Y., Jo, H. G., and Kang, S. J. (2014). Fully
distributed monitoring architecture supporting multi-
ple trackees and trackers in indoor mobile asset man-
agement application. Sensors (Basel, Switzerland),
14(3):5702–5724.
Koskim
¨
aki, H., Huikari, V., Siirtola, P., and R
¨
oning, J.
(2013). Behavior modeling in industrial assembly
lines using a wrist-worn inertial measurement unit.
Journal of Ambient Intelligence and Humanized Com-
puting, 4(2):187–194.
Krengel, M., Schmauder, M., Schmidt, T., and Turek, K.
(2010). Beschreibung der Dynamik manueller Opera-
tionen in logistischen Systemen: Schlussbericht. Dres-
den.
Linz, T., Kallmayer, C., Aschenbrenner, R., and Reichl, H.
(2006). Fully integrated ekg shirt based on embroi-
dered electrical interconnections with conductive yarn
and miniaturized flexible electronics. In International
Workshop on Wearable and Implantable Body Sensor
Networks (BSN’06), pages 23–26.
Long, X., Yin, B., and Aarts, R. M. (2009). Single-
accelerometer-based daily physical activity classifi-
cation. Conference proceedings : ... Annual In-
ternational Conference of the IEEE Engineering in
Medicine and Biology Society. IEEE Engineering in
Medicine and Biology Society. Annual Conference,
2009:6107–6110.
Oppenheim, A. V. and Schafer, R. W. (1999). Discrete time
signal processing. Prentice Hall, Upper Saddle River,
NJ [u.a.].
Siepenkort, A. (2013). Methode zur Messung und Be-
wertung der individuellen Kommissionierleistung in
Person-zur-Ware-Systemen: Univ., Diss.–Stuttgart,
2012. Berichte aus dem Institut f
¨
ur F
¨
ordertechnik
und Logistik. Institut f
¨
ur F
¨
ordertechnik und Logistik,
Stuttgart.
Siirtola, P. (2015). Recognizing human activities based on
wearable inertial measurements: methods and appli-
cations. PhD thesis, University of Oulu, Department
of Computer Science and Engineering.
Stiefmeier, T. (2008). Real-time spotting of human activi-
ties in industrial environments: Diss., Eidgen
¨
ossische
Technische Hochschule ETH Z
¨
urich, Nr. 17907–
Z
¨
urich, 1790. ETH, Z
¨
urich.
Stinson, M. R., Sommer, T., and Wehking, K.-H. (2014).
Bewertung und Optimierung der Effizienz manueller
T
¨
atigkeiten in der Kommissionierung (EfKom): Ab-
schlussbericht. Univ. Inst. f
¨
ur F
¨
ordertechnik und Lo-
gistik (IFT), Stuttgart.
ten Hompel, M. and Schmidt, T. (2007). Warehouse man-
agement: Automation and organisation of warehouse
and order picking systems ; with 48 tables ; [with CD-
ROM]. Springer, Berlin.
Toney, A. P., Thomas, B. H., and Marais, W. (2006). Man-
aging smart garments. In Wearable Computers, 2006
10th IEEE International Symposium on, pages 91–94.
Venn, E. and Geißen, T. (2011). Kommissionieren mit
System: Mit acht Bausteinen erfolgreich planen.
Hebezeuge F
¨
ordermittel, 51(6):338–342.
Zhu, Z., Mazilu, S., Hardegger, M., Plotnik, M., Hausdorff,
J. M., Roggen, D., and Tr
¨
oster, G. (2012). Real-time
detection of freezing of gait for parkinson’s disease
patients via smartphone. In Adjunct Proceedings of
the 10th International Conference on Pervasive Com-
puting (Pervasive 2012).
Zouba, N., Boulay, B., Bremond, F., and Thonnat, M.
(2008). Monitoring activities of daily living (adls)
of elderly based on 3d key human postures. In Ca-
puto, B. and Vincze, M., editors, Cognitive Vision,
volume 5329 of Lecture Notes in Computer Science,
pages 37–50. Springer Berlin Heidelberg.
Note that a significant part of research in the field of
order picking is done in Germany and therefore some of the
references are only available in German.
Motion Classification for Analyzing the Order Picking Process using Mobile Sensors - General Concepts, Case Studies and Empirical
Evaluation
713
