
The Data-driven Factory
Leveraging Big Industrial Data for Agile, Learning and Human-centric
Manufacturing
Christoph Gröger
1,2
, Laura Kassner
1
, Eva Hoos
1
, Jan Königsberger
1
, Cornelia Kiefer
1
,
Stefan Silcher
1,3
and Bernhard Mitschang
1
1
Graduate School of Excellence advanced Manufacturing Engineering, University of Stuttgart,
Nobelstr.12, 70569 Stuttgart, Germany
2
Robert Bosch GmbH, Robert-Bosch-Platz 1, 70839 Gerlingen-Schillerhöhe, Germany
3
eXXcellent solutions GmbH, Heßbrühlstraße 7, 70565 Stuttgart, Germany
Keywords: IT Architecture, Data Analy
tics, Big Data, Smart Manufacturing, Industrie 4.0.
Abstract: Global competition in the manufacturing industry is characterized by ever shorter product life cycles, increas-
ing complexity and a turbulent environment. High product quality, continuously improved processes as well
as changeable organizational structures constitute central success factors for manufacturing companies. With
the rise of the internet of things and Industrie 4.0, the increasing use of cyber-physical systems as well as the
digitalization of manufacturing operations lead to massive amounts of heterogeneous industrial data across
the product life cycle. In order to leverage these big industrial data for competitive advantages, we present the
concept of the data-driven factory. The data-driven factory enables agile, learning and human-centric manu-
facturing and makes use of a novel IT architecture, the Stuttgart IT Architecture for Manufacturing (SITAM),
overcoming the insufficiencies of the traditional information pyramid of manufacturing. We introduce the
SITAM architecture and discuss its conceptual components with respect to service-oriented integration, ad-
vanced analytics and mobile information provisioning in manufacturing. Moreover, for evaluation purposes,
we present a prototypical implementation of the SITAM architecture as well as a real-world application sce-
nario from the automotive industry to demonstrate the benefits of the data-driven factory.
1 INTRODUCTION
Global competition in the manufacturing industry is
characterized by ever shorter product life cycles, in-
creasing complexity and a turbulent environment.
High product quality, continuously improved pro-
cesses as well as changeable organizational structures
constitute critical success factors for manufacturing
companies (Westkämper, 2014).
With the rise of the internet of things, initiatives
like Industrie 4.0 (MacDougall, 2014), respectively
Smart Manufacturing (Davis et al., 2012), signifi-
cantly foster the use of cyber-physical systems (CPS)
(Shi et al., 2011) as well as the digitalization of man-
ufacturing operations and promote the vision of de-
centralized self-control and self-optimization of prod-
ucts and processes (Brettel et al., 2014). This leads to
enormous amounts of heterogeneous industrial data
across the entire product life cycle, representing big
industrial data (Kemper et al., 2013). These data are
both structured and unstructured, ranging, e.g., from
machine sensor data on the shop floor to data on prod-
uct usage as well as from data on customer complaints
in social networks to data on failure reports of service
technicians. Exploiting these data, that is, extracting
valuable business insights and knowledge from these
data, is one of the central challenges in Industrie 4.0
(Gölzer et al., 2015). For example, these data can be
used for optimization of product design, manufactur-
ing execution and quality management.
However, the prevailing manufacturing IT archi-
tecture in practice, the information pyramid of manu-
facturing (ISA, 2000), prevents comprehensive data
exploitation due to the following limitations:
(1) complex point-to-point integration of heterogene-
ous IT systems limits a flexible integration of new
data sources; (2) strictly hierarchical aggregation of
information prevents a holistic view for knowledge
extraction; (3) isolated information provisioning for
the manufacturing control level and the enterprise
control level impedes employee integration on the
factory shop floor.
40
Gröger, C., Kassner, L., Hoos, E., Königsberger, J., Kiefer, C., Silcher, S. and Mitschang, B.
The Data-driven Factory - Leveraging Big Industrial Data for Agile, Learning and Human-centric Manufacturing.
In Proceedings of the 18th International Conference on Enterprise Information Systems (ICEIS 2016) - Volume 1, pages 40-52
ISBN: 978-989-758-187-8
Copyright
c
2016 by SCITEPRESS – Science and Technology Publications, Lda. All rights reserved
To address these issues, we present the concept of
the data-driven factory which is based on the results
of several research projects we have undertaken at the
Graduate School of Excellence advanced Manufac-
turing Engineering (GSaME) at the University of
Stuttgart in cooperation with various industry part-
ners. The data-driven factory leverages big industrial
data for agile, learning and human-centric manufac-
turing and makes use of a novel IT architecture, the
Stuttgart IT Architecture for Manufacturing (SITAM),
overcoming the insufficiencies of the traditional in-
formation pyramid of manufacturing. The data-driven
factory combines service-oriented integration, ad-
vanced analytics as well as mobile information provi-
sioning in a holistic approach in order to exploit big
industrial data for competitive advantages.
The remainder of this paper is organized as fol-
lows: First, we analyze the limitations of the infor-
mation pyramid of manufacturing with respect to big
industrial data and further discuss related work in
Section 2. Next, we introduce the concept of the data-
driven factory in Section 3 and derive technical re-
quirements. Section 4 focuses on the SITAM archi-
tecture and its components in order to address these
requirements and provide a technical framework for
the data-driven factory. For evaluation purposes, we
present a prototypical implementation of the SITAM
architecture and discuss a real-world application sce-
nario in Section 5 demonstrating the benefits of the
data-driven factory. Finally, we conclude in Section 6
and highlight future work.
2 BIG INDUSTRIAL DATA AND
THE INFORMATION PYRAMID
OF MANUFACTURING
In this section, first, we analyze the limitations of the
traditional information pyramid of manufacturing
with respect to big industrial data in Section 2.1.
Next, we discuss related work, especially recent man-
ufacturing IT architectures addressing these limita-
tions in Section 2.2.
2.1 Limitations of the Information
Pyramid of Manufacturing
The information pyramid of manufacturing, also
called the hierarchy model of manufacturing, repre-
sents the prevailing manufacturing IT architecture in
practice (Vogel-Heuser et al., 2009). It is used to
structure data processing and IT systems in manufac-
turing companies and it is standardized in ISA 95
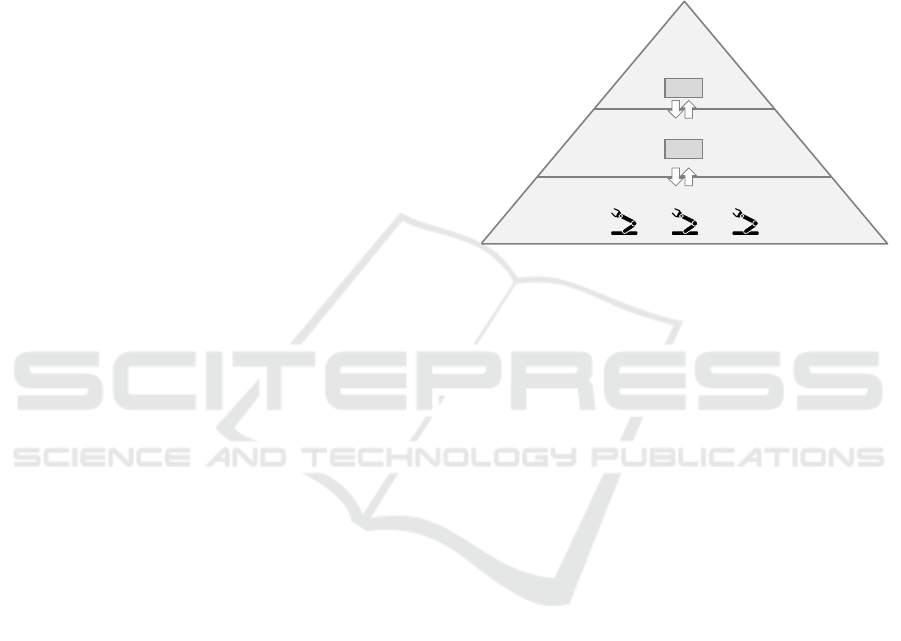
(ISA, 2000). In a simplified version, the information
pyramid is comprised of three hierarchical levels (see
Figure 1): the enterprise control level refers to all
business-related activities and IT systems, such as en-
terprise resource planning (ERP) systems, the manu-
facturing control level focuses on manufacturing op-
erations management especially with manufacturing
execution systems (MES) and the manufacturing
level refers to the machines and automation systems
on the factory shop floor.
Figure 1: Information pyramid of manufacturing.
Data processing in the information pyramid is based
on three fundamental principles (Vogel-Heuser et al.,
2009):
• Central Automation to control all activities top-
down starting from the enterprise control level
• Information Aggregation to condense all data bot-
tom-up starting from the manufacturing level
• System Separation to allow only IT systems at ad-
jacent levels to directly communicate with each
other
The digitalization of manufacturing operations as
well as the massive use of CPS lead to big industrial
data, i.e., enormous amounts of heterogeneous indus-
trial data at all levels of the information pyramid and
across the entire product life cycle (Kemper et al.,
2013). For instance, besides huge amounts of struc-
tured machine data and sensor data resulting from the
shop floor, there are unstructured data on service re-
ports and customer opinions in social networks. Ex-
ploiting these data, that is, extracting valuable busi-
ness insights and knowledge, enables comprehensive
optimization of products and processes (Gölzer et al.,
2015). For instance, customer satisfaction can be cor-
related with product design parameters using CAD
data and CRM data or root causes of process quality
issues can be analyzed using machine data and ERP
data.
However, data processing according to the infor-
mation pyramid of manufacturing prevents
Manufacturing Control Level
Manufacturing Level
Enterprise
Control Level
MES
ERP
The Data-driven Factory - Leveraging Big Industrial Data for Agile, Learning and Human-centric Manufacturing
41

comprehensive data exploitation due to the following
major technical limitations (L
i
):
• L
1
: Central automation and system separation lead
to a complex and proprietary point-to-point inte-
gration of IT systems, which significantly limits a
flexible integration of new data sources across all
hierarchy levels (Minguez et al., 2010). For exam-
ple, integrating an additional machine typically re-
quires the costly and time-consuming adaptation of
interfaces for a specific MES.
• L
2
: Strictly hierarchical information aggregation
leads to separated data islands preventing a holis-
tic view for knowledge extraction (Kemper et al.,
2013). For instance, historic machine data at the
manufacturing level is separated from ERP data at
the enterprise control level, which prevents a ho-
listic process performance analysis correlating,
e.g., machine parameters and details on product
configurations.
• L
3
: Central control and information aggregation
lead to isolated information provisioning focusing
on the manufacturing control level and the enter-
prise control level and thus impede employee inte-
gration on the manufacturing level (Bracht et al.,
2011). For example, process execution data is typ-
ically aggregated for MES and ERP systems with-
out information provisioning for shop floor work-
ers.
To conclude, the function-oriented and strictly hier-
archical levels of the information pyramid of manu-
facturing support a clear separation of concerns for
the development and management of IT systems.
However, the information pyramid lacks flexibility,
holistic data integration and cross-hierarchical infor-
mation provisioning. These factors significantly limit
the exploitation of big industrial data and necessitate
new manufacturing IT architectures, which are dis-
cussed in the following section.
2.2 Related Work: Manufacturing IT
Architectures
We did a comprehensive literature analysis on recent
architectural approaches for IT-based manufacturing.
As result, we identified the following two major
groups of work:
• Abstract Frameworks for Industrie 4.0 and Smart
Manufacturing, which represent meta models and
roadmaps for standardization issues, especially the
Reference Architectural Model Industrie 4.0
(ZVEI, 2015) as well as the SMLC framework for
Smart Manufacturing (Davis et al., 2012)
• Concrete Manufacturing IT Architectures, which
structure IT components and their relations in and
across manufacturing companies on a conceptual
level, especially (Vogel-Heuser et al., 2009;
Minguez et al., 2010; Holtewert et al., 2013; Pa-
pazoglou et al., 2015)
The above frameworks are defined on a significantly
higher abstraction level than the information pyramid
of manufacturing. Hence, we concentrate on existing
manufacturing IT architectures and analyze them
with respect to the technical limitations of the infor-
mation pyramid identified in Section 2.1. The com-
mon core of all of the above IT architectures is a ser-
vice-oriented architecture (SOA) (Erl, 2008) in order
to enable a flexible integration of IT systems – i.e. IT
services – across all hierarchy levels (Minguez et al.,
2010; Holtewert et al., 2013). In addition, in (Vogel-
Heuser et al., 2009), the need for a common data
model standardizing the interfaces and the data of the
IT services is underlined. In (Holtewert et al., 2013;
Papazoglou et al., 2015), a marketplace with IT ser-
vices is proposed in addition. In (Papazoglou et al.,
2015), a knowledge repository is part of the architec-
ture. However, no concrete concepts for data integra-
tion, data analytics or data quality are presented.
All in all, these existing manufacturing IT archi-
tectures mainly address the limitation of a complex
and proprietary point-to-point integration of IT sys-
tems in the information pyramid of manufactur-
ing (L
1
). Yet, they lack manufacturing-specific ap-
proaches for data analytics and information provi-
sioning to fully address the limitations of separated
data islands (L
2
) as well as of isolated information
provisioning (L
3
). In contrast, our concept of the data-
driven factory and the SITAM architecture address all
three limitations in a holistic approach as detailed in
the following sections.
3 THE DATA-DRIVEN FACTORY
The data-driven factory is a holistic concept to exploit
big industrial data for competitive advantages of man-
ufacturing companies. For this purpose, the data-
driven factory addresses central economic challenges
of today’s manufacturing (Westkämper, 2014), par-
ticularly agility, learning ability as well as employee
orientation, and makes use of a novel IT architecture,
the Stuttgart IT Architecture for Manufacturing
(SITAM), overcoming the insufficiencies of the tra-
ditional information pyramid of manufacturing.
The data-driven factory takes a holistic view on
all data generated across the entire product life cycle,
ICEIS 2016 - 18th International Conference on Enterprise Information Systems
42

from product design over manufacturing execution
until service and support, including both structured
data and unstructured data. Structured data generally
refers to data in a relational form whereas unstruc-
tured data comprises text, audio and video files as
well as images. In contrast to earlier integration ap-
proaches, especially Computer Integrated Manufac-
turing (Groover, 2008), the data-driven factory does
not aim at totally automating all operations and deci-
sion processes but explicitly integrates employees in
order to benefit from their knowledge, creativity and
problem-solving skills.
In the following, we highlight the characteristics
of the data-driven factory in Section 3.1 and derive
corresponding technical requirements in Section 3.2
as a basis for the development of the SITAM archi-
tecture in Section 4.
3.1 Characteristics
From a manufacturing point of view, the data-driven
factory is defined by the following core characteris-
tics (see Figure 2):
• The data-driven factory enables agile manufactur-
ing (Westkämper, 2014) by exploiting big indus-
trial data for proactive optimization and agile
adaption of activities. For instance, machine fail-
ures and turbulences can be predicted near real-
time and manufacturing processes can be proac-
tively adapted.
• The data driven factory enables learning manufac-
turing (Hjelmervik and Wang, 2006) by exploiting
big industrial data for continuous knowledge ex-
traction. For instance, concrete action recommen-
dations can be learned from historic process exe-
cution data to optimize a specific metric, e.g., qual-
ity rate.
• The data driven factory enables human-centric
manufacturing (Zuehlke, 2010) by exploiting big
industrial data for context-aware information pro-
visioning as well as knowledge integration of em-
ployees to keep the human in the loop. For exam-
ple, shop floor workers are immediately informed
about performance issues of the machine they are
currently working at and can digitally create corre-
sponding improvement suggestions, e.g., by re-
cording a video.
To conclude, the data-driven factory leverages big in-
dustrial data for agile, learning and human-centric
manufacturing. In this way, it creates new potentials
for competitive advantages for manufacturing com-
panies, especially with respect to efficient and at the
same time agile processes, continuous and proactive
improvement as well as the integration of knowledge
and creativity of employees across the entire product
life cycle.
Figure 2: Characteristics and technical requirements
of the data-driven factory.
3.2 Technical Requirements
Based on the above characteristics and taking into ac-
count the limitations of the information pyramid of
manufacturing (see Section 2.1), we have derived the
following technical core requirements (R
i
) for the re-
alization of the data-driven factory (see Figure 2):
• R
1
: Flexible Integration of Heterogeneous IT Sys-
tems to rapidly include new data sources for agile
manufacturing, e.g., when setting up a new ma-
chine
• R
2
: Holistic Data Basis and Advanced Analytics
for knowledge extraction in learning manufactur-
ing, e.g., to prescriptively extract action recom-
mendation from both structured and unstructured
data
• R
3
: Mobile Information Provisioning to ubiqui-
tously integrate employees across all hierarchy
levels for human-centric manufacturing, e.g., in-
cluding service technicians in the field as well as
product designers
In order to realize these requirements, a variety of IT
concepts and technologies has to be systematically
combined in an overall IT architecture. As we ana-
lyzed in Sections 2.1 and 2.2, the information pyra-
mid of manufacturing lacks flexibility, holistic data
integration and cross-hierarchical information provi-
sioning (R
1
-R
3
). Thus, a novel manufacturing IT ar-
chitecture is necessary, which is detailed in the next
section.
4 SITAM: STUTTGART
IT ARCHITECTURE
FOR MANUFACTURING
The SITAM architecture is a conceptual IT architec-
ture for manufacturing companies to realize the data-
Data-Driven
Factory
Agile
Learning
Human-
Centric
Technical Requirements
• Flexible Integration of
Heterogeneous IT
Systems
• Holistic Data Basis and
Advanced Analytics
• Mobile Information
Provisioning
The Data-driven Factory - Leveraging Big Industrial Data for Agile, Learning and Human-centric Manufacturing
43
driven factory. The architecture is based on the results
and insights of several research projects we have un-
dertaken in cooperation with various industry part-
ners, particularly from the automotive and the ma-
chine construction industry.
In the following, we present an overview of the
SITAM architecture in Section 4.1 and detail its com-
ponents in Sections 4.2-4.6.
4.1 Overview
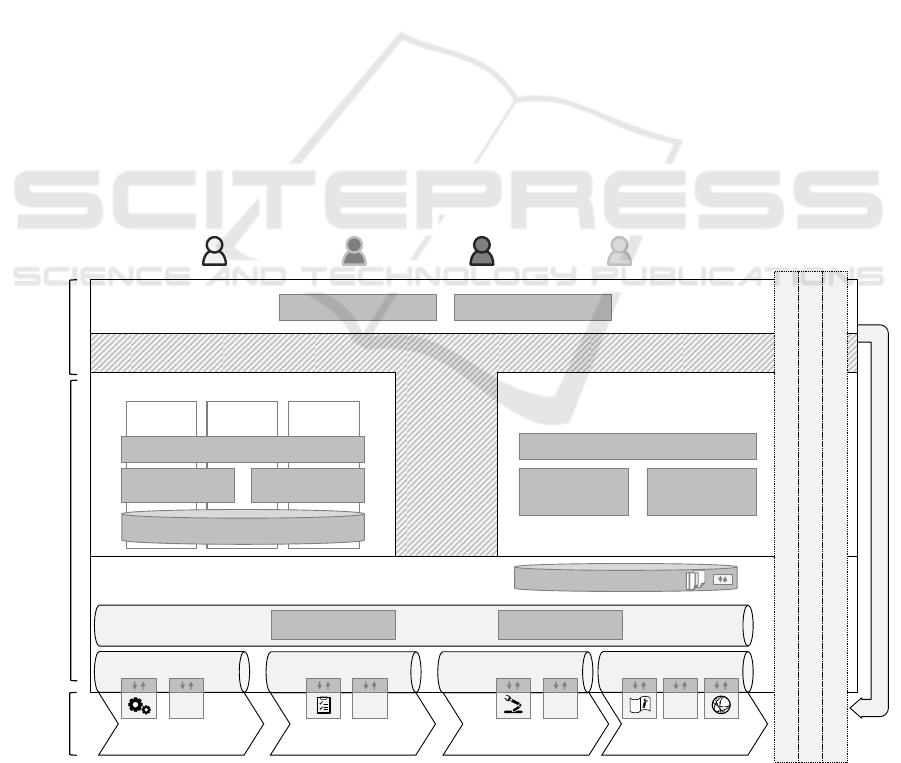
The SITAM architecture (see Figure 3) encompasses
the entire product life cycle: Processes, physical re-
sources, e.g., CPS and machines, IT systems as well
as web data sources provide the foundation for sev-
eral layers of abstracting and value-adding IT.The in-
tegration middleware (see Section 4.2) encapsulates
these foundations into services and provides corre-
sponding data exchange formats as well as mediation
and orchestration functionalities.
The analytics middleware (see Section 4.3) and
the mobile middleware (see Section 4.4) build upon
the integration middleware to provide predictive and
prescriptive analytics for structured and unstructured
data around the product life cycle and mobile inter-
faces for information provisioning.
Together, the three middlewares enable the com-
position of value-added services for both human users
and machines (see Section 4.5). In particular, services
can be composed ad-hoc and offered as mobile or
desktop apps on an app marketplace to integrate hu-
man users, e.g., by a mobile manufacturing dashboard
with prescriptive analytics for workers. The added
value from these services feeds back into the product
life cycle for continuous proactive improvement and
adaptation.
Cross-architectural topics (see Section 4.6) repre-
sent overarching issues relevant for all components
and comprise data quality, governance as well as se-
curity and privacy.
In the following, the components of the SITAM
architecture are described in greater detail.
4.2 Integration Middleware:
Service-oriented Integration
The SITAM’s integration middleware represents a
changeable and adaptable integration approach,
which is based on the SOA paradigm (Erl, 2008). The
integration middleware is specifically tailored to
manufacturing companies, providing the much
needed flexibility and adaptability required in today’s
aforementioned turbulent environment with a perma-
nent need of change.
Figure 3: Overview of the Stuttgart IT Architecture for Manufacturing (SITAM).
Continuous Improvement and Feedback
Integration Middleware
Value-Added Services
PLM Bus
SOA Governance Repository
Mediation Orchestration
Analytics Middleware
Descriptive
Analytics
Predictive
Analytics
Prescriptive
Analytics
Mobile Middleware
Service
Composition & Access
Security & Privacy
Governance
Data Quality
Product Life Cycle:
Processes, Resources,
IT-Systems, Web
Value-adding
Middleware
Role-based
Applications
Manufacturing Knowledge Repository
Mobile
Context-Aware
Data Handling
Mobile
Synchronization
and Caching
Mobile Visualization
Visual Analytics
Information Mining KPI Management
App Composer App Marketplace
After Sales Service Bus
Usage and Support
CRM
Prod. Planning Service
Bus
Production planning
ERP
Engineering Service Bus
Engineering
PDM
Manufacturing Service
Bus
Manufacturing
MES
ICEIS 2016 - 18th International Conference on Enterprise Information Systems
44

To enable those benefits, it builds on a concept of
hierarchically arranged Enterprise Service Busses
(ESBs) following (Silcher et al., 2013). Each one of
these ESBs is responsible for the integration of all ap-
plications and services of a specific phase of the prod-
uct life cycle.
All phase-specific ESBs are connected via a su-
perordinate Product-Lifecycle-Management-Bus
(PLM Bus). The PLM Bus is responsible for commu-
nication and mediation between phase-specific bus-
ses as well as for the orchestration of services.
This concept enables, for example, the easier inte-
gration of external suppliers without opening up too
much of a company’s internal IT systems to them by
just “plugging” their own ESB into the PLM Bus. Be-
sides, it also reduces the complexity by abstraction
over the introduced integration hierarchy.
A dedicated sub-component providing real-time
capabilities is used in the manufacturing phase to con-
nect CPS and other real-time machine interfaces to
the overall ESB compound.
The ESB hierarchy effectively abstracts and de-
couples technical systems and their services into a
more business-oriented view, which we call value-
added services. Value-added services use the basic
services providing access to application data, orches-
trate and combine them.
This decoupling also evens out different speeds in
the development and change of applications or ser-
vices. Companies often face the problem of having to
integrate, e.g., legacy mainframe applications with
modern mobile apps, which inherently have very dif-
ferent development speeds. By decoupling business-
oriented services from the technical systems/services,
each application can be developed separately and at
its own pace, while the integration middleware han-
dles all transformations and mediations that might be
necessary to maintain compatibility.
Each phase-specific ESB also utilizes its own
phase-specific data exchange format to handle the
different requirements of each phase. For example,
engineering has to be able to exchange large amounts
of data, e.g., CAD models, whereas manufacturing re-
quires the quick exchange of a large amount of
smaller data chunks, e.g., MES production data. Af-
tersales on the other hand needs to handle both large
CAD data as well as small, lightweight data struc-
tures, e.g., live car data.
The separation into different phase-specific ESBs
allows each department or business unit to make use
of specialized data exchange formats tailored to
phase-specific needs.
To sum up, the hierarchical composition of phase-
specific ESBs across the entire product life cycle and
the changeable service-oriented abstraction of IT sys-
tems address requirement R
1
(flexible integration of
heterogeneous IT systems) of the data-driven factory.
4.3 Analytics Middleware: Advanced
Analytics
The analytics middleware is service-oriented and
comprises several manufacturing-specific analytics
components which are crucial for a data-driven fac-
tory: The manufacturing knowledge repository for
storing source data and analytics-derived insights, in-
formation mining on structured and unstructured data,
management of key performance indicators (KPIs),
and visual analytics. The analytics middleware in-
cludes functionalities for descriptive, predictive and
prescriptive analytics, with prescriptive analytics be-
ing a novel introduction which provides actionable
problem solutions or preventative measures before
critical conditions lead to losses (Evans and Lindner,
2012). In providing integrative, holistic and near-real
time analytics on big industrial data of all data types,
the SITAM analytics middleware transcends the ana-
lytics capabilities of existing approaches (see Sec-
tion 2). This significantly contributes to the learning
and agile characteristics of the data-driven factory.
Source data are extracted using predefined ETL
functions from the integration middleware. Integrated
data of structured and unstructured type from around
the product life cycle are stored in the manufacturing
knowledge repository along the lines of (Gröger et al.,
2014b) for maximum integration, minimum infor-
mation loss and flexible access. Over the course of the
product life cycle, this repository is enriched with var-
ious knowledge artefacts, e.g., analytics results like
data mining models, business rules and free-form
documents such as improvement suggestions. To
store structured and unstructured source data in a
scalable manner, the repository combines SQL and
NoSQL storage concepts. It also includes the func-
tionality for flexibly creating semantic links between
source data and knowledge artefacts to support rea-
soning and knowledge management (see (Gröger et
al., 2014b)).
The information mining component can be subdi-
vided into classical data mining and machine learning
tools for structured data on the one hand, and tools for
various types of unstructured data – text, audio,
video – on the other hand.
We will discuss text analytics (Aggarwal and
Zhai, 2012) in more detail since its use in a frame-
work for integrative data analytics is novel and since
text data harbor a wealth of hitherto untapped
knowledge. Typically, text analytics applications
The Data-driven Factory - Leveraging Big Industrial Data for Agile, Learning and Human-centric Manufacturing
45

have been focused on one isolated unstructured data
source and one analytical purpose, without integrat-
ing the results with analytics on structured data and
with the disadvantage of information loss along the
processing chain (Kassner et al., 2014).
To secure flexibility of analytics and easy integra-
tion of data from different sources, we propose a set
of basic and custom text analytics toolboxes, includ-
ing domain-specific resources for the manufacturing
and engineering domains and on an individual prod-
uct domain level. This type of toolbox is similar to the
generic and specific text analytics concepts proposed
in (Kassner et al., 2014). Value-added applications of
these text analytics tools fall into two main catego-
ries: (1) information extraction tasks and (2) direct
support of human labor through partial automation.
For example, presenting the top ten errors for a spe-
cific time span based on text in shop floor documen-
tation is an information extraction task which helps
workers gain insights into weaknesses of the produc-
tion setup. Using features of text reports, for example
occurrences of particular domain-specific keywords,
to predict the likelihood of certain error codes which
a human expert must manually assign to these text re-
ports, constitutes an example of a direct support ana-
lytics task (see (Kassner and Mitschang, 2016) for an
implementation and proof of concept of this use case
within the SITAM architecture).
Information mining can then be applied to dis-
cover knowledge, which is currently hidden in a com-
bination of structured data and extracts from unstruc-
tured data. For example, process and machine data
from the shop floor can be matched up with
timestamps and extracted topics or relations from un-
structured error reports to discover root causes for
problems which have occurred. Real-time process
data from the shop floor can be compared to historical
data to discover indicators for problematic situations
and prescribe measures for handling them, for exam-
ple speeding up a machine when a delayed process
has been discovered.
In order to constitute the backbone of a truly data-
driven factory, information mining has to be con-
ducted near real-time, on a variety of data sources as-
needed, and manufacturing processes, sales, delivery,
logistics and marketing campaigns have to adjust to
meet the prescriptions derived from analytics results.
The management of key performance indicators is
another important component and can be greatly im-
proved by readily available and flexible analytics on
a multitude of data sources. Instead of being an off-
line process conducted by the executive layer based
on aggregated reporting data, KPI management can
become a continuous and pervasive process, as data
analytics feedback loops are in place for all processes
around the product life cycle and at any level of the
process hierarchy.
Finally, the analytics middleware also includes
visual analytics for data exploration through human
analysts: This type of analytics mainly combines in-
formation mining and visualization techniques to pre-
sent large data sets to human observers in an intuitive
way, allowing them to make sense of the data beyond
the capabilities of analytics algorithms. Thus, visual
analytics keep the human in the loop according to hu-
man-centric manufacturing.
Thus, the analytics capabilities of our reference
architecture for the data-driven factory transcend
those of related conceptual work in several aspects:
(1) They include prescriptive, not just predictive or
descriptive analytics, (2) they fully integrate struc-
tured and unstructured data beyond the manufactur-
ing process, (3) they stretch across the entire product
life cycle and provide a holistic view as well as holis-
tic data storage, and (4) they are decentralized yet in-
tegrative, since analytics services are combined as-
needed to answer questions or supervise processes
and keep the human in the loop. Advanced analytics
mostly contribute to the fulfillment of requirement
R
2
, but also R
3
and R
1
of the data-driven factory.
4.4 Mobile Middleware: Mobile
Information Provisioning
The mobile middleware enables mobile information
provisioning and mobile data acquisition by facilitat-
ing the development and integration of manufactur-
ing-specific mobile apps. Mobile apps (Clevenger,
2011) are running on smart mobile devices, such as
smartphones, tablets, and wearables, and integrate hu-
mans into the data-driven factory. Due to their high
mobility, workers on the shop floor have to have ac-
cess to the services of the factory anywhere and any-
time, e.g., viewing near real-time information or cre-
ating failure reports on-the-go, supported by the mo-
bile devices’ cameras and sensors. Workers can also
actively participate in the manufacturing process,
e.g., they can control the order in which products are
produced. Furthermore, mobile apps offer an intuitive
task-oriented touch-based design and enable users to
consume only relevant data. Mobile devices also al-
low for the collection of new kinds of data, e.g., posi-
tion data or photos. This enables new kinds of ser-
vices such as context-aware apps and augmented-re-
ality apps (Hoos et al., 2014).
However, the development of mobile apps differs
from the development of stationary applications due
to screen sizes, varying mobile platforms, unstable
ICEIS 2016 - 18th International Conference on Enterprise Information Systems
46

network connections and other factors. In addition,
manufacturing-specific challenges arise (Hoos et al.,
2014), e.g., due to the complex data structures as well
as the high volume of data. In contrast to existing ap-
proaches (see Section 2.2), the mobile middleware
addresses these manufacturing-specific needs.
The mobile middleware comprises three compo-
nents: mobile context-aware data handling, mobile
synchronization and caching as well as mobile visu-
alization.
The mobile context-aware data handling compo-
nent provides manufacturing-specific context models
describing context elements and relations, e.g., on the
shop floor, as well as efficient data transfer mecha-
nism so that only relevant data in the current context
is transmitted to the mobile device. For instance, a
shop floor worker specifically needs information on
the current machine he is working at.
The mobile synchronization and caching compo-
nent supports offline usage of mobile apps. This is
important because a network connection cannot al-
ways be guaranteed, particularly on the factory shop
floor. The components offers mechanisms to deter-
mine which data should be cached using context in-
formation provided by the context models.
The mobile visualization component provides tai-
lored visualization schemas for manufacturing data,
e.g., for CAD product models. For example, it pro-
vides a visualization schema to represent a hierar-
chical product structure and to browse it via touch
gestures. Various screen sizes and touch-based inter-
action styles are considered.
To sum up, the mobile middleware enables the in-
tegration of the human by supporting the develop-
ment and integration of mobile apps. This is done by
offering manufacturing-specific services for data
handling and visualization. Thus, by addressing re-
quirement R
3
(mobile information provisioning), the
mobile middleware contributes to the human-centric
characteristic of the data-driven factory, i.e., keeping
the human in the loop.
4.5 Service Composition and
Value-added Services
The service-based and integrative nature of the
SITAM architecture allows it to provide value-added
services in several ways. We define value-added ser-
vices as services which provide novel uses and thus
create value by transcending the limitations of the in-
formation pyramid of manufacturing (see Section
2.1): By providing flexible interfaces for data and ser-
vice provisioning (addressing limitation L
1
), by inte-
grating, analyzing and presenting data from several
phases around the product life cycle (addressing lim-
itation L
2
) and by providing access to information in
all the contexts in which it is needed and in which the
traditional model may fail to do so (addressing limi-
tation L
3
). The value-added services offered in the
SITAM architecture cut across the architectural lay-
ers, packaging and combining functionalities of the
integration middleware, the analytics middleware and
the mobile middleware.
In the SITAM architecture, services are composed
and adapted on the basis of user roles and the infor-
mation needs and permissions associated with them.
For example, a shop floor worker receives detailed
alerts related to the process step he is responsible for,
whereas his production supervisor is concerned with
the aggregated state of the entire manufacturing pro-
cess across all process steps.
Ad-hoc service composition is enabled by the app
composer. The app composer offers this functionality
for users in all roles, regardless of their educational
background or their ability to code. For example, data
sources and analytics services can be mashed up and
composed via drag-and-drop in a graphic user inter-
face. Atomic or composed services can then be of-
fered and distributed as apps in the app marketplace
for all types of devices, both stationary and mobile.
To sum up, flexible service composition contrib-
utes to the fulfillment of requirement R
1
(flexible in-
tegration of heterogeneous IT systems) and the provi-
sioning of composed services as mobile apps helps to
fulfill requirement R
3
(mobile information provision-
ing) of the data-driven factory.
4.6 Cross-architectural Topics
Security and privacy, governance and data quality are
overarching topics which must be considered at all
layers of the architecture: at the data sources, in ana-
lytics and mobile middleware as well as in the appli-
cations. In the following, we focus on SOA govern-
ance and data quality as they require specific con-
cepts for the data-driven factory. For general security
and privacy issues in data management, we refer the
reader to (Whitman and Mattord, 2007).
The governance of complex service-oriented archi-
tectures is often neglected in existing manufacturing IT
architectures, such as (Papazoglou et al., 2015), even
though a lack of governance is one of the main reasons
for failing SOA initiatives (Meehan, 2014).
SOA governance covers a wide range of aspects (a
list of key aspects can be found in (Königsberger et
al., 2014)). With more and more systems being inte-
grated – especially CPS, but also for example social
media services – it is becoming difficult to keep track
The Data-driven Factory - Leveraging Big Industrial Data for Agile, Learning and Human-centric Manufacturing
47

of planned changes to those systems and services. For
this reason, service change management and service
life cycle management governance processes track
and report those changes to service consumers and
providers, governed for example via consumer and
stakeholder management processes.
When setting up those governance processes, it is
important to keep them as lightweight and unobtru-
sive as possible in order to minimize complexity and
managerial effort. To support this, the SITAM archi-
tecture contains a central SOA governance repository,
which is built on a specific SOA governance meta
model described in (Königsberger et al., 2014). The
repository uses semantic web technologies that allow
for example the use of semantic reasoning to detect
new dependencies or missing information. The SOA
Governance Repository also contains service data as
well as operations data, spanning and providing sup-
port during all phases of the service life cycle, and
therefore also supporting novel software develop-
ment concepts like DevOps.
Apart from SOA governance, the need for high
quality data is a direct consequence of the concept of
the data-driven factory. A data quality framework for
the data-driven factory needs to enable data quality
measurement and improvement (1) in near real-time
(2) at all analysis steps from data source to user (3)
for all types of data accumulating in the product life
cycle, especially structured data as well as unstruc-
tured textual, video, audio and image data.
Existing data quality frameworks, e.g., (Wang and
Strong, 1996; Sebastian-Coleman, 2013), fail to sat-
isfy these requirements. Hence, we translate these re-
quirements into an extended data quality framework,
which allows a flexible composition of data quality
dimensions (e.g., timeliness, accuracy, relevance and
interpretability) at all levels of the SITAM architec-
ture (see (Wang and Strong, 1996) for an example list
of data quality dimensions). Furthermore, we define
sets of concrete indicators considering data consum-
ers at all levels, from data source to user, and we al-
low for near real-time calculation of data quality (e.g.,
the confidence or accuracy of machine learning algo-
rithms, language of text and speech, author of data
sources and the distribution of data points on a time-
line). This makes the quality of data and of resulting
analytics results transparent at all levels and therefore
enables holistic data quality improvement.
To sum up, we have seen that SOA governance
and data quality are crucial factors across all layers of
the SITAM architecture. A flexible composition of IT
systems and services can be offered using service-ori-
ented architectures. But complex service-oriented ar-
chitectures are prone to fail without systematic SOA
governance. Besides, a holistic data quality frame-
work forms the basis to measure and improve data
quality from data source to user, including the gener-
ated analytics results.
5 IMPLEMENTATION AND
EVALUATION
In the following, we present current work on the real-
ization of the SITAM architecture in a prototypical
implementation in Section 5.1. Moreover, we intro-
duce a real-world application scenario from the auto-
motive industry using the SITAM architecture in Sec-
tion 5.2 and finally evaluate the benefits of the
SITAM architecture and the concept of the data-
driven factory in Section 5.3.
5.1 Implementation Strategy
and Prototype
Our current prototype covers core components in
every layer of the SITAM architecture, in particular
with respect to analytics, governance, mobile and re-
pository aspects. In the following, we sketch major
solution details and technologies we utilized. The lat-
ter were chosen from the large available pool of free
and open source software to underline the broad ap-
plicability of the SITAM architecture and make the
implementation easily adaptable to various industrial
real-world settings.
The integration middleware relies on WSO2’s
Application Server and Business Process Server, to
realize the hierarchical ESB structure as well as the
orchestration of basic services and mediation between
phase-specific ESBs as described in (Silcher et al.,
2013). Services within the prototype are implemented
as either conventional SOAP web services or REST
services. Data exchange formats are realized as XSD
documents and stored in the SOA governance repos-
itory. The repository itself relies, as mentioned in
Section 4.6, on semantic web technologies, mainly
the resource description framework (RDF) and pro-
vides a web-accessible as well as a Web Service in-
terface as described in (Königsberger et al., 2014).
In the analytics middleware, the manufacturing
knowledge repository is implemented as a federation
of a relational database and a NoSQL system – we
used the content management system Alfresco
CMS – to store structured and unstructured data.
These systems are integrated by a specific link store
using a graph database such as Neo4j. The infor-
mation mining component includes tools from the
ICEIS 2016 - 18th International Conference on Enterprise Information Systems
48
Apache UIMA framework (Ferrucci and Lally, 2004)
for unstructured data analytics, with the uimaFit ex-
tension (Ogren and Bethard, 2009) for rapidly build-
ing analytics pipelines to allow for on-the-fly analyt-
ics service composition. Structured data mining capa-
bilities are taken for instance from the WEKA data
mining workbench (Hall et al., 2009). On this basis,
manufacturing-specific predictive and prescriptive
analytics are realized using various data mining tech-
niques, especially decision tree induction, as de-
scribed in (Gröger et al., 2014a, 2014b).
Regarding the mobile middleware, we imple-
mented several mobile apps, e.g., a mobile analytics
dashboard for shop floor workers (Gröger et al.,
2014b) and a mobile product structure visualizer for
engineers. We have implemented native apps for An-
droid and for Windows as well as platform independ-
ent web apps using standardized web technology such
as HTML5.
An app marketplace and a graphical interface for
intuitive access to the app composer are currently un-
der development, with inspiration coming from
mashup platforms (Daniel and Matera, 2014) and app
generator tools, such as (Francese et al., 2015).
5.2 Application Scenario: Quality
Management and Process
Optimization in the Automotive
Industry
To demonstrate the concept of the data-driven factory
as well as the SITAM architecture, we have cooper-
ated with an OEM to develop a real-world application
scenario for the automotive industry. The scenario fo-
cuses on quality management and process optimiza-
tion as critical success factors for OEMs especially in
the automotive premium segment.
An automotive manufacturer collects big indus-
trial data, including structured sales and machine
data, sensor and text data around the product life cy-
cle. These data originally reside in isolated databases;
for instance, text reports about product and part qual-
ity from development, production and aftersales are
all gathered via different IT systems. To ensure a re-
alistic representation of source data and processes, on
the one hand, we take advantage of publicly available
data sources, such as the records of automotive com-
plaints covering the US market and maintained by the
NHTSA (NHTSA, 2014). On the other hand, we
make use of anonymized data and internal knowledge
resources of our industry partner.
On this basis, the SITAM architecture is applied
to exploit these data for quality management and pro-
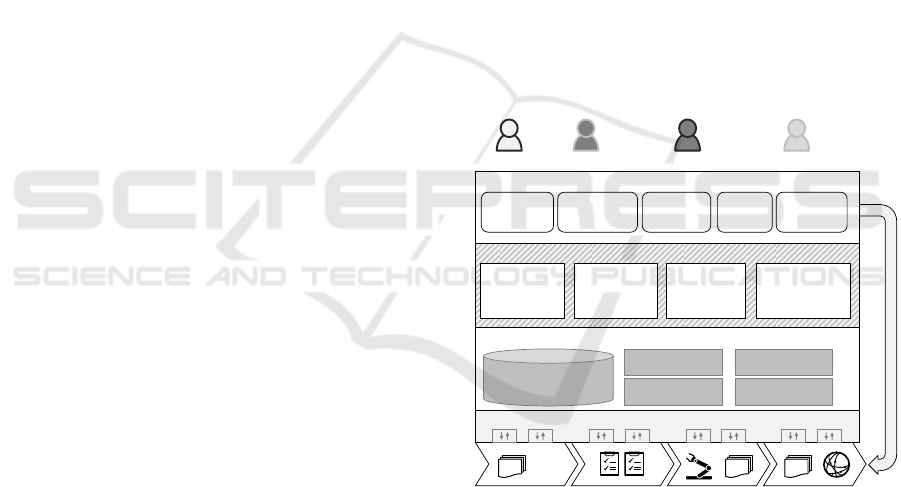
cess optimization. In the following, we give an over-
view of representative value-added services and role-
based apps across the product life cycle which are en-
abled by the SITAM architecture (see Figure 4). We
focus on car paint quality as a recurring example (all
data samples in the following are fictitious for reasons
of confidentiality).
During product development and testing, quality
data are collected through the mobile dev Q app by
engineers and test drivers on the go, including text re-
ports and image material. The aftersales Q app is
used to collect aftersales quality data for the warranty
and recovery process of damaged car parts in the form
of unstructured text reports (e.g., “customer states that
car paint is coming off after washing”, “flaking paint
on fender during extreme summer heat”). It has differ-
ent profiles for quality engineers (whose primary task
is the definition of new error codes), for quality expert
workers (whose task it is to assign error codes to dam-
aged parts) and for executives (who are interested in
comparing aggregated error code data over time). In
addition, quality data come in the form of customer
complaints and via social media crawling services.
Figure 4: Value-added services and role-based apps
in the application scenario.
After aggregating these data into the manufactur-
ing knowledge repository via the integration middle-
ware, topic recognition on the text data is performed
as an information mining step. The topics (e.g., “paint
flaking – heat”, “paint damage – washing”) are pre-
sented to a human analyst via visual clustering to pick
the most pressing ones or perform minor reclassifica-
tion. This constitutes a value-added service of recur-
ring issue identification and is performed via the topic
visualizer app, which makes use of the mobile graph
Manufacturing
Knowledge Repository
Analytics & Mobile Middleware
Quality Engineer
Value-Added Services
Dev Q
App
Aftersales Q
App
Topic Recognition
Recurring
Issue
Identification
Mashup
Dashboard
Root Cause
Identification
Shop Floor
Notifier
Automatic
Machine
Reconfiguration
To pic
Visualizer
Proactive
process
optimization
Visual Clustering
Mobile Graph
Visualizer
Error
Reports
Production
Plans
Machine
Data
Customer
Complaints
Social
Media
Shop Floor WorkerDeveloperAnalyst
Error
Reports
Role-based Apps
Integration Middleware
…
The Data-driven Factory - Leveraging Big Industrial Data for Agile, Learning and Human-centric Manufacturing
49

visualizer from the mobile middleware.
Next, the problem topics are combined with his-
torical data from the production phase, especially ma-
chine data, shop floor environment data, and struc-
tured error counts for root cause identification (e.g.,
elevated humidity in the paint shop leading to a lower
quality of paint and a higher risk of flaking when ex-
posed to harsh environmental conditions). This ana-
lytics step is executed in an analytics and data mashup
dashboard app, where data sources and analytics al-
gorithms are combined ad-hoc, but can also be stored
for recurring use.
Identified root causes and condition patterns serve
as input for proactive process optimization. It makes
use of prescriptive analytics to automatically identify
potentially problematic situations (e.g., critical hu-
midity in paint shops) during process execution and
recommend actions to on-duty workers through a
shop floor notifier app (e.g., to air the paint shops to
decrease humidity) or trigger automatic machine re-
configuration (e.g., increasing air conditioning and
heating to decrease humidity).
5.3 Evaluation and Benefits
Taking the above application scenario, we conceptu-
ally evaluate the SITAM architecture by analyzing
the fulfillment of the technical requirements of the
data-driven factory and contrasting it with the tradi-
tional information pyramid of manufacturing. More-
over, we summarize the resulting benefits of the data-
driven factory.
In the application scenario, diverse systems across
the product life cycle, such as machines, social media
sources as well as sensors, are encapsulated as ser-
vices and are uniformly represented in the SOA gov-
ernance repository to ease integration and access in
the integration middleware. By this service-oriented
abstraction, the SITAM architecture enables a flexible
integration of heterogeneous data sources as well as a
flexible service composition fulfilling requirement R
1
.
This enables agile manufacturing, the first characteris-
tic of the data-driven factory. Accessible service-based
and role-based information provisioning also works to-
wards keeping the human in the loop (human-centric
manufacturing). In contrast, a proprietary point-to-
point integration according to the information pyramid
of manufacturing would not scale up to the entire prod-
uct life cycle in terms of complexity and costs.
To merge structured and unstructured data from
different life cycle phases, e.g., aftersales quality data
and machine data in the application scenario, all data
are integrated in the manufacturing knowledge repos-
itory of the analytics middleware. Moreover, predict-
tive and prescriptive analytics are provided, for in-
stance, to derive action recommendations for process
optimization according to the application scenario.
Thus, the SITAM architecture provides a holistic data
basis encompassing the product life cycle as well as
advanced analytics for knowledge extraction ful-
filling requirement R
2
. This analytics capability pro-
vides functionalities for learning manufacturing,
such as learned improvements for the quality-optimal
design of both processes and products. It also is a pre-
requisite for agile process adaptations (agile manu-
facturing), such as the near real-time adaptation of
production conditions to prevent known product qual-
ity issues. In contrast, the information pyramid of
manufacturing is limited by separated data islands
due to strictly hierarchical information aggregation.
In the application scenario, various mobile apps
support seamless integration of employees, e.g., for
data acquisition by test drivers using the dev Q app or
for notifications of shop floor workers using the shop
floor notifier. The mobile middleware facilitates the
development of such manufacturing-specific apps us-
ing predefined manufacturing context models as well
as specific visualization components, especially for
product models. These apps can be easily deployed
on various devices using the app marketplace. In this
way, the SITAM architecture enables mobile infor-
mation provisioning and fulfills requirement R
3
of the
data-driven factory to ubiquitously integrate employ-
ees across all hierarchy levels. Thus, it provides the
framework for human-centric manufacturing in keep-
ing the human expert in the loop through data provi-
sioning and data gathering. In contrast, central control
and information aggregation lead to isolated infor-
mation provisioning in the information pyramid of
manufacturing.
To sum up, the SITAM architecture enables flex-
ible system and data integration, advanced analytics
and mobile information provisioning and thus fulfills
all technical requirements (R
1
-R
3
) of the data-driven
factory. In doing so, it exhibits the three characteris-
tics of the data-driven factory, agile manufacturing,
learning manufacturing and human-centric manufac-
turing.
6 CONCLUSION AND
FUTURE WORK
In this article, we have presented the data-driven fac-
tory, an important contribution on the way to the re-
alization of Industrie 4.0 and Smart Manufacturing.
This concept completely alters the ways in which IT
ICEIS 2016 - 18th International Conference on Enterprise Information Systems
50

systems are used and data are processed in manufac-
turing companies, thereby enabling agile, learning
and human-centric manufacturing by leveraging big
industrial data. The data-driven factory provides a
stark contrast to the traditional information pyramid
of manufacturing, which is fraught with the central
weaknesses of proprietary point-to-point integration
of IT systems, separated data islands and isolated in-
formation provisioning. Instead, the data-driven fac-
tory collects, analyzes and uses data holistically
around the product life cycle and across all hierarchy
levels of manufacturing. Thus, continuous data-
driven optimization of processes and resources with
the active participation of the ‘human in the loop’ is
facilitated.
To realize the data-driven factory, we have devel-
oped the SITAM architecture which (1) flexibly inte-
grates heterogeneous IT systems, (2) provides holis-
tic data storage and advanced analytics covering the
entire product life cycle, and (3) enables mobile in-
formation provisioning to empower human workers
as active participants in manufacturing. We have pro-
totypically implemented core components of the
SITAM architecture in the context of a real-world ap-
plication scenario concerned with quality and process
management in the automotive industry. Our concep-
tual evaluation shows that the SITAM architecture
enables the realization of the data-driven factory and
the exploitation of big industrial data across the entire
product life cycle.
In the future, we will extend our current prototype
and further investigate the benefits of the data-driven
factory on the example of additional industrial case
studies, e.g., to concretize resulting competitive ad-
vantages in specific industries.
ACKNOWLEDGEMENTS
The authors would like to thank the German Research
Foundation (DFG) as well as Daimler AG for finan-
cial support of this project as part of the Graduate
School of Excellence advanced Manufacturing En-
gineering (GSaME) at the University of Stuttgart.
REFERENCES
Aggarwal, C.C. and Zhai, C.X. (2012), “An Introduction to
Text Mining”, in Aggarwal, C.C. and Zhai, C.X. (Eds.),
Mining Text Data, Springer, Boston, pp. 1–10.
Bracht, U., Hackenberg, W. and Bierwirth, T. (2011), “A
monitoring approach for the operative CKD logistics”,
Werkstattstechnik, Vol. 101 No. 3, pp. 122–127.
Brettel, M., Friederichsen, N., Keller, M. and Rosenberg, M.
(2014), “How Virtualization, Decentralization and Net-
work Building Change the Manufacturing Landscape:
An Industry 4.0 Perspective”, International Journal of
Science, Engineering and Technology, Vol. 8 No. 1,
pp. 37–44.
Clevenger, N.C. (2011), iPad in the enterprise. Developing
and deploying business applications, Wiley, Indianap-
olis.
Daniel, F. and Matera, M. (2014), Mashups - Concepts,
Models and Architectures. Data-Centric Systems and
Applications, Springer, Heidelberg.
Davis, J., Edgar, T., Porter, J., Bernaden, J. and Sarli, M.S.
(2012), “Smart Manufacturing, Manufacturing Intelli-
gence and Demand- Dynamic Performance”, Comput-
ers & Chemical Engineering, Vol. 47, pp. 145–156.
Erl, T. (2008), SOA. Principles of service design, The Pren-
tice Hall service-oriented computing series from
Thomas Erl, Prentice Hall, Upper Saddle River.
Evans, J.R. and Lindner, C.H. (2012), “Business Analytics:
The Next Frontier for Decision Sciences”, Decision
Line, Vol. 43 No. 2, pp. 4–6.
Ferrucci, D. and Lally, D. (2004), “UIMA. An architectural
approach to unstructured information processing in the
corporate research environment”, Natural Language
Engineering, Vol. 10 No. 3-4, pp. 327–348.
Francese, R., Risi, M., Tortora, G. and Tucci, M. (2015),
“Visual Mobile Computing for Mobile End-Users”,
IEEE Transactions on Mobile Computing, to appear.
Gölzer, P., Cato, P. and Amberg, M. (2015), “Data Pro-
cessing Requirements of Industry 4.0 - Use Cases for
Big Data Applications”, in Proceedings of the Euro-
pean Conference on Information Systems (ECIS) 2015,
Paper 61.
Gröger, C., Schwarz, H. and Mitschang, B. (2014a), “Pre-
scriptive Analytics for Recommendation-Based Busi-
ness Process Optimization”, in Proceedings of the In-
ternational Conference on Business Information Sys-
tems (BIS) 2014, Springer, Cham, pp. 25–37.
Gröger, C., Schwarz, H. and Mitschang, B. (2014b), “The
Manufacturing Knowledge Repository. Consolidating
Knowledge to Enable Holistic Process Knowledge
Management in Manufacturing”, in Proceedings of the
International Conference on Enterprise Information
Systems (ICEIS) 2014, SciTePress, pp. 39–51.
Groover, M.P. (2008), Automation, production systems,
and computer-integrated manufacturing, 3
rd
ed., Pren-
tice Hall, Upper Saddle River.
Hall, M., Frank, E., Holmes, G., Pfahringer, B., Reutemann,
P. and Witten, I.H. (2009), “The WEKA Data Mining
Software: an Update”, SIGKDD Explorations, Vol. 11
No. 1, pp. 10–18.
Hjelmervik, O.R. and Wang, K. (2006), “Knowledge Man-
agement in Manufacturing: The Soft Side of
Knowledge Systems”, in Wang, K., Kovacs, G.L.,
Wozny, M. and Fang, M. (Eds.), Knowledge Enter-
prise: Intelligent Strategies in Product Design, Manu-
facturing, and Management, Vol. 207, Springer, pp.
89–94.
The Data-driven Factory - Leveraging Big Industrial Data for Agile, Learning and Human-centric Manufacturing
51

Holtewert, P., Wutzke, R., Seidelmann, J. and Bauernhansl,
T. (2013), “Virtual Fort Knox - Federative, secure and
cloud-based platform for manufacturing”, in Proceed-
ings of the CIRP Conference on Manufacturing Systems
(CMS) 2013, Elsevier, pp. 527–532.
Hoos, E., Gröger, C. and Mitschang, B. (2014), “Mobile
Apps in Engineering: A Process-Driven Analysis of
Business Potentials and Technical Challenges”, in Pro-
ceedings of the CIRP Conference on Intelligent Com-
putation in Manufacturing Engineering (CIRP ICME)
2014, Procedia CIRP Vol. 33, Elsevier, pp. 17–22.
ISA (2000), Enterprise-Control System Integration No.
ISA-95.
Kassner, L., Gröger, C., Mitschang, B. and Westkämper, E.
(2014), “Product Life Cycle Analytics - Next Genera-
tion Data Analytics on Structured and Unstructured
Data”, in Proceedings of the CIRP Conference on Intel-
ligent Computation in Manufacturing Engineering
(CIRP ICME) 2014, Procedia CIRP Vol. 33, Elsevier,
p. 35–40.
Kassner, L. and Mitschang, B. (2016), “Exploring Text
Classification for Messy Data: An Industry Use Case
for Domain-Specific Analytics”, in Proceedings of the
International Conference on Extending Database Tech-
nology (EDBT) 2016, OpenProceedings.org, to appear.
Kemper, H.-G., Baars, H. and Lasi, H. (2013), “An Inte-
grated Business Intelligence Framework. Closing the
Gap Between IT Support for Management and for Pro-
duction”, in Rausch, P., Sheta, A.F. and Ayesh, A.
(Eds.), Business Intelligence and Performance Man-
agement. Theory, Systems and Industrial Applications,
Advanced Information and Knowledge Processing,
Springer, London, pp. 13–26.
Königsberger, J., Silcher, S. and Mitschang, B. (2014),
“SOA-GovMM: A meta model for a comprehensive
SOA governance repository”, in Proceedings of the
IEEE International Conference on Information Reuse
and Integration (IRI) 2014, IEEE, pp. 187–194.
MacDougall, W. (2014), “Industrie 4.0 – Smart Manufac-
turing for the Future”, available at: http://www.gtai.de/
GTAI/Content/EN/Invest/_SharedDocs/Downloads/G
TAI/Brochures/Industries/industrie4.0-smart-manufact
uring-for-the-future-en.pdf (accessed 29.10.15).
Meehan, M. (2014), “SOA adoption marked by broad fail-
ure and wild success”, available at: http://searchsoa.tec
htarget.com/news/1319609/SOA-adoption-marked-by-
broad-failure-and-wild-success (accessed 28.10.15).
Minguez, J., Lucke, D., Jakob, M., Constantinescu, C. and
Mitschang, B. (2010), “Introducing SOA into Produc-
tion Environments - The Manufacturing Service Bus”,
in Proceedings of the 43
rd
CIRP International Confer-
ence on Manufacturing Systems (CMS), Neuer Wissen-
schaftlicher Verlag, Wien, pp. 1117–1124.
NHTSA (2014), “NHTSA Data”, available at: http://www-
odi.nhtsa.dot.gov/downloads/ (accessed 28.10.15).
Ogren, P.V. and Bethard, S.J. (2009), “Building test suites
for UIMA components”, in Proceedings of the Work-
shop on Software Engineering, Testing, and Quality As-
surance for Natural Language Processing (SETQA-
NLP), ACM, pp. 1–4.
Papazoglou, M.P., Heuvel, W.-J.v. and Mascolo, J.E.
(2015), “A Reference Architecture and Knowledge-
Based Structures for Smart Manufacturing Networks”,
IEEE Software, Vol. 32 No. 3, pp. 61–69.
Sebastian-Coleman, L. (2013), Measuring data quality for
ongoing improvement, Elsevier, Burlington.
Shi, J., Wan, J., Yan, H. and Suo, H. (2011), “A survey of
Cyber-Physical Systems”, in Proceedings of the Inter-
national Conference on Wireless Communications and
Signal Processing (WCSP), IEEE, Piscataway, pp. 1–6.
Silcher, S., Dinkelmann, M., Minguez, J. and Mitschang, B.
(2013), “Advanced Product Lifecycle Management by
Introducing Domain-Specific Service Buses”, in Cor-
deiro, J., Maciaszek, L.A. and Filipe, J. (Eds.), Enter-
prise Information Systems (ICEIS) 2013. Revised Se-
lected Papers, Lecture Notes in Business Information
Processing, Vol. 141, Springer Berlin, pp. 92–107.
Vogel-Heuser, B., Kegel, G., Bender, K. and Wucherer, K.
(2009), “Global information architecture for industrial
automation”, Automatisierungstechnische Praxis,
Vol. 51 No. 01-02, pp. 108–115.
Wang, R.Y. and Strong, D.M. (1996), “Beyond accuracy:
what data quality means to data consumers”, Journal of
Management Information Systems, Vol. 12 No. 4, pp.
5–33.
Westkämper, E. (2014), Towards the Re-Industrialization
of Europe. A concept for manufacturing for 2030,
Springer, Berlin.
Whitman, M.E. and Mattord, H.J. (2007), Principles of in-
formation security, 3
rd
ed., Thomson Course Technol-
ogy, Boston.
Zuehlke, D. (2010), “SmartFactory - Towards a factory-of-
things”, Annual Reviews in Control, Vol. 34 No. 1, pp.
129–138.
ZVEI (2015), “The Reference Architectural Model Indus-
trie 4.0 (RAMI 4.0)”, available at:
http://www.zvei.org/Downloads/Automation/ZVEI-In
dustrie-40-RAMI-40-English.pdf (accessed 28.09.15).
ICEIS 2016 - 18th International Conference on Enterprise Information Systems
52
