
A Graph and Trace Clustering-based Approach for Abstracting Mined
Business Process Models
Yaguang Sun and Bernhard Bauer
Software Methodologies for Distributed Systems, University of Augsburg, Augsburg, Germany
Keywords:
Business Process Model Abstraction, Business Process Mining, Workflow Discovery, Graph Clustering,
Trace Clustering.
Abstract:
Process model discovery is a significant research topic in the business process mining area. However, existing
workflow discovery techniques run into a stone wall while dealing with event logs generated from highly flex-
ible environments because the raw models mined from such logs often suffer from the problem of inaccuracy
and high complexity. In this paper, we propose a new process model abstraction technique for solving this
problem. The proposed technique is able to optimise the quality of the potential high level model (abstraction
model) so that a high-quality abstraction model can be acquired and also considers the quality of the sub-
models generated where each sub-model is employed to show the details of its relevant high level activity in
the high level model.
1 INTRODUCTION
Business process mining techniques aim at discover-
ing, monitoring and improving real processes by ex-
tracting knowledge from event logs recorded by enter-
prise information systems (van der Aalst et al., 2003).
The starting point of these techniques is usually an
event log which is a set of cases. A case is an instance
of a business process and has an attribute trace which
is a set of ordered events (each event is an instance
of a specific activity). In the event log both cases and
events are uniquely marked by case id and event id
respectively (van der Aalst, 2011).
As one of the most important learning tasks in
business process mining area, the current process
model discovery techniques encounter great chal-
lenges in the context of real-life event logs. Such
logs that usually contain a tremendous number of
trace behaviors (expressed by the activities and their
precedence relations in the trace) stem from the busi-
ness processes executed in highly flexible environ-
ments, e.g., healthcare, customer relationship man-
agement (CRM) and product development (Weerdt
et al., 2013). As a result, ”spaghetti-like” business
process models are often generated while mining real-
life event logs with existing workflow discovery tech-
niques. Such models are often inaccurate (in the pro-
cess mining area the fitness is utilised to express the
accuracy of a mined model which measures the pro-
portion of behaviors in the event log possible accord-
ing to the model) and difficult to be comprehended
because of their high complexity. Accordingly, two
main pioneering approaches have been developed in
the literature to solve this problem: trace clustering
technique (Weerdt et al., 2013; Bose and van der
Aalst, 2009; Bose and van der Aalst, 2010; Song
et al., 2009; Ferreira et al., 2007) and process model
abstraction-based technique (Bose and van der Aalst,
2009; Baier and Mendling, 2013; Conforti et al.,
2014).
Trace clustering techniques divide the raw event
log into several sub-logs where each sub-log contains
the traces with similar behaviors and helps gener-
ate a more accurate and comprehensible sub-model.
Generally, these techniques perform well for handling
the logs with a moderate amount of trace behaviors.
Nevertheless, the limitation of current trace cluster-
ing techniques will be revealed while dealing with
event logs containing massive trace behaviors. For
instance, the event log of a Dutch academic hospi-
tal from Business Process Intelligence Contest 2011
(BPIC 2011) contains 624 activities among which a
large number of relations are exhibited (the average
out-degree for each activity is 6.2564) and most of
the classical trace clustering methods can not bring a
significant improvement on the mining result for this
hospital log (as shown in Section 4).
Process model abstraction-based approaches
Sun, Y. and Bauer, B.
A Graph and Trace Clustering-based Approach for Abstracting Mined Business Process Models.
In Proceedings of the 18th International Conference on Enterprise Information Systems (ICEIS 2016) - Volume 1, pages 63-74
ISBN: 978-989-758-187-8
Copyright
c
2016 by SCITEPRESS – Science and Technology Publications, Lda. All rights reserved
63
Cluster
A
Cluster
B
Cluster
C
Sub-model A
1
Sub-model A
2
Sub-model A
k
Sub-model B
1
Sub-model B
2
Sub-model B
m
Sub-model C
1
Sub-model C
2
Sub-model C
n
Cluster
A
Cluster
B
Cluster
C
High level model
Raw event log E
Workflow
Discovery
“Spaghetti-like”
Business Process Model
Generate clusters
of activity
Generate sub-models
Abstract activity
A
1
Abstract activity
A
2
Abstract activity
A
k
Abstract activity
B
1
Abstract activity
B
2
Abstract activity
B
m
Abstract activity
C
1
Abstract activity
C
2
Abstract activity
C
n
Generate
Abstract Log
Event log with
abstract activities
Generate high
level model
Trace Clustering
Deal with complex and
inaccurate sub-models
Sub-model A
k
Sub-model A
2
Sub-sub-mode
1
Sub-sub-mode
2
Sub-sub-mode
p
Sub-sub-mode
1
Sub-sub-mode
2
Sub-sub-mode
q
Casual Activity
Graph G
a
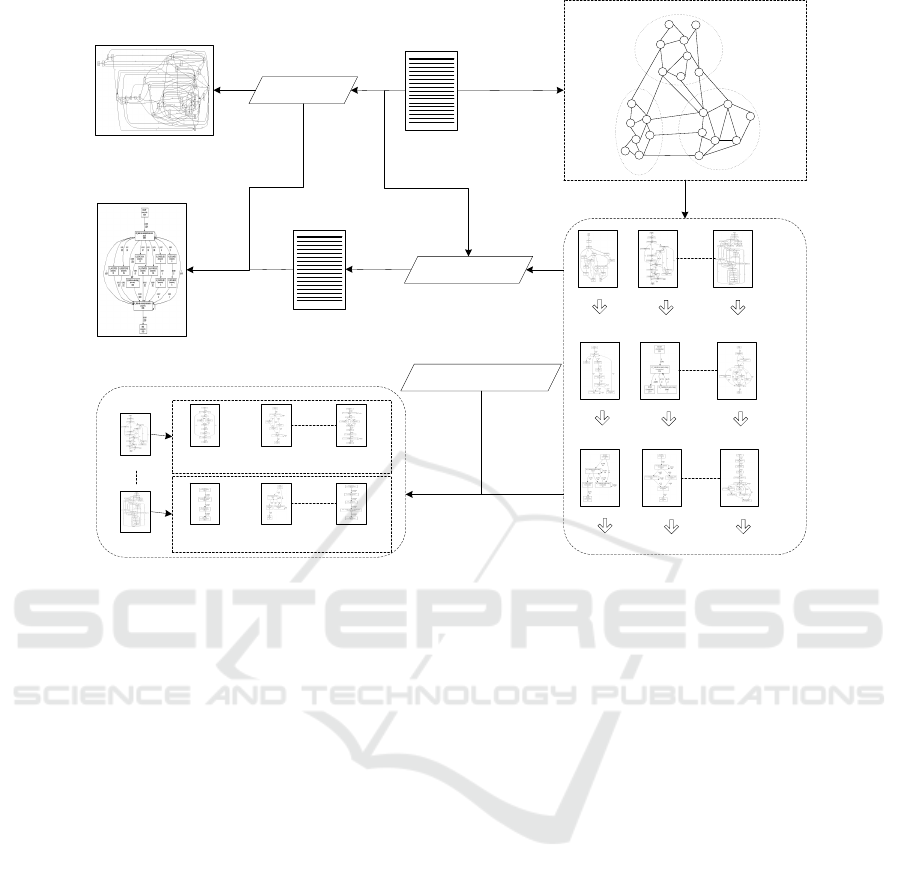
Figure 1: Illustration of the basic ideas of the approach proposed in this paper.
make the assumption that the raw models mined from
real-life logs contain low level sub-processes which
should be discovered in the form of sub-traces in
the original event logs and abstracted into high level
activities so that the insignificant low level process
behaviors can be hidden in the high level activities.
Thus, more accurate and simpler high level process
models can be obtained. However, most of the
present process model abstraction-based techniques
focus mainly on the discovery of sub-processes and
can not ensure the accuracy of the high level process
models generated.
In this paper, we put forward a new method which
inherits the characteristics of the trace clustering tech-
niques and the process model abstraction-based ap-
proaches for solving the problem of ”spaghetti-like”
process models. The proposed technique is able to
optimise the quality of the potential high level pro-
cess model through a new abstraction strategy based
on graph clustering technique (Schaeffer, 2007). As
a result, a high-quality abstraction model can be built.
Furthermore, the quality of the sub-models discov-
ered for showing the details of their related high level
activities (used for building the final high level model)
is also considered by our approach. The structure of
the main contents in this paper is organised as:
- A new strategy for abstracting the raw models
mined from real-life event logs is discussed in
Section 2.
- In Section 3.1, several important concepts that
support the method proposed in this paper are re-
viewed. In Section 3.2, a three-stage model ab-
straction method based on the strategy proposed
in Section 2 is elaborated.
- To test the efficiency of our method, we carry out a
case study in Section 4 by applying our approach
to three event logs: the repair log from (van der
Aalst, 2011), the hospital log from Business Pro-
cess Intelligence Contest (BPIC) 2011 and the log
of the loan and overdraft approvals process from
BPIC 2012.
2 BASIC IDEAS
In the real world, seemingly ”spaghetti-like” busi-
ness process models mined from event logs might still
have some rules to follow. Sometimes, the main rea-
son for the structurelessness of these mined models
is that they contain several extremely complex sub-
structures. However, the relations among these sub-
structures may be straightforward (this is proven in
the case study in Section 4). While turning to a spe-
cific event log, such kind of phenomenon mentioned
ICEIS 2016 - 18th International Conference on Enterprise Information Systems
64

above can be reflected by the existence of several clus-
ters of activities from an event log where the activi-
ties in the same cluster are densely connected and the
activities in different clusters are sparsely connected
(this is also the assumption for our method). For in-
stance, in Figure 1 an event log E contains 22 activi-
ties and a causal activity graph G can be established
by employing the activities from E as vertices and the
casual relations (Hompes et al., 2014) among these
activities as edges. The definitions about casual ac-
tivity graph and casual relations of activities are in-
troduced in detail in Section 3.1. According to Figure
1, the vertices in G can be grouped into three clusters
by considering the edge structure in such a way that
there should be many edges within each cluster and
relatively few edges among the clusters.
With the assumption mentioned above, we put for-
ward a new strategy for solving the problem of com-
plex and inaccurate process models mined from real-
life event logs. The basic idea is to generate the clus-
ters of activities firstly by following the same rule
utilised in the example shown in Figure 1. After-
wards, for each cluster one or several sub-models are
generated where each sub-model only contains the ac-
tivities from its relevant activity cluster. In the exam-
ple from Figure 1, the sub-models for cluster A are
built by using the activities from cluster A. Then, for
a complex and inaccurate sub-model, trace clustering
technique is employed to split it into several simple
and accurate sub-sub-models so that the sub-model
can be well comprehended. Finally, these sub-models
(not including the sub-sub-models) generated are ab-
stracted into high level activities with which a sim-
ple and accurate ultima high level process model is
formed. In this paper the high level process model
together with the sub-models (each sub-model is re-
lated to one high level activity in the high level model
built) are used to show the details of the whole busi-
ness process recorded in event log.
Basically, two major benefits could be acquired
from the strategy proposed above. On one hand, the
original tough problem (deal with the entire model)
met by current trace clustering techniques is trans-
formed into small sub-problems (deal with the sub-
models). Specifically, the raw mined model from
event log may contain too many behaviors which
might be far beyond the abilities of existing trace clus-
tering techniques. However, by distributing the huge
amount of behaviors from the original mined model
to several small sub-models (each sub-model contains
less behaviors but still might be complex and inaccu-
rate) the trace clustering techniques can provide better
results while being applied on these sub-models. On
the other hand, the number of activity relations among
the clusters is kept as small as possible (which means
the relations among the high level activities created
are kept as few as possible). As a result, the quality of
the potential high level process model is optimised to
a large extent because it contains a limited number of
behaviors among its activities.
3 APPROACH DESIGN
In this section, we propose a new approach that
utilises the strategy introduced in Section 2 for solv-
ing the problem of ”spaghetti-like” process models
mined from event logs. In Section 3.1, several impor-
tant basic concepts and notations related to our tech-
nique are discussed. In Section 3.2, the details of our
technique are elaborated.
3.1 Preliminaries
Event logs (van der Aalst, 2011) play the significant
part of data sources for various kinds of process min-
ing techniques. The basic concepts related to event
logs are conveyed by the following definitions.
Definition 1. (Case)
Let C be the set of cases. A case c ∈ C is defined as
a tuple c = (N
c
, Θ
c
), where N
c
= {n
1
, n
2
, . .., n
k
} is
the set of names of case attributes, Θ
c
: N
c
→ A
c
is an
attribute-transition function which maps the name of
an attribute into the value of this attribute, where A
c
is
the set of attribute values for case c.
A case is an instance of a specific business pro-
cess and uniquely identified by case id. Each case
may have several attributes such as trace, originator,
timestamp and cost, etc. As one of the most important
case attributes, the trace of a case is defined as:
Definition 2. (Trace)
Let AT be the set of activities, EV be the set of events
and each event ev ∈ EV is an instance of a particular
activity at ∈ AT . A trace is a sequence of ordered
events from EV .
Definition 3. (Event Log)
An event log is defined as E ⊆ C, for any c
1
,c
2
∈ E
such that c
1
6= c
2
.
Take a simple event log E
1
= [< a,b, c >
15
,<
a,c, b >
15
,< a,b >
3
,< a,c >
5
] for example. This log
contains 38 cases (only the case attribute trace is ex-
hibited) and four kinds of trace
1
. There are totally
1
A trace and a kind of trace are two different concepts.
Each trace belongs to a unique case. A kind of trace con-
tains several traces which have the same sequence of events.
A Graph and Trace Clustering-based Approach for Abstracting Mined Business Process Models
65

3 · 15 +3 · 15 + 2 · 3 + 2 ·5 = 106 events and three ac-
tivities (activity a, b and c) in this log.
In (Hompes et al., 2014) the fundamental theory
for activity clustering is developed. Two important
concepts that support this theory are demonstrated:
Causal Activity Relations and Causal Activity Graph.
The technique proposed in this paper will use these
concepts for generating the clusters of activities from
event logs.
Definition 4. (Direct and Casual Activity Relations)
Let AT be the set of activities of an event log E. Sym-
bol
E
represents a direct relation between two activ-
ities from AT and symbol
E
represents a causal re-
lation between two activities from AT . Let a,b ∈ AT
be two activities, φ ∈ [−1.0,1.0] be a threshold, a
E
b = true if |a
E
b| > 0, where |a
E
b| is the number
of times that a is directly followed by b in E. a
E
b = true if |a
E
b| ≥ φ, where |a
E
b| ∈ [−1.0, 1.0]
is the value of casual relation between a and b.
In our approach we utilise the
DependencyMeasure method introduced in (Weijters
et al., 2006) for calculating the value of casual
relation between any two activities which is defined
as:
|a
E
b| =
|a
E
b|−|b
E
a|
|a
E
b|+|b
E
a|+1
if a 6= b
|a
E
a|
|a
E
a|+1
if a = b
(1)
A |a
E
b| value close to 1.0 implies a high possi-
bility that there exists a direct casual relation between
a and b while a value close to –1.0 signifies a high
possibility that there exists no casual relation between
a and b. A value close to 0 means uncertainty. Take
two activities a and c from event log E
1
created above
as an example, |a
E
1
c|=15 + 5 = 20, |c
E
1
a| = 0,
so |a
E
1
c| = (20 − 0)/(20 + 0 + 1) ≈ 0.95. Let the
threshold φ = 0.9, then a casual relation is judged to
exist between a and c because |a
E
1
c| > φ.
Definition 5. (Casual Activity Graph)
Let AT be a set of activities from event log E, ϒ(AT )
denotes the set of casual activity graphs over AT . A
causal activity graph G ∈ ϒ(AT) is a tuple G = (V,L)
where V ∈ AT is the set of vertices and L ∈ (V ×V )
is the set of edges. Each edge in G represents a casual
relation between two activities.
In our method we employ an existing graph
clustering technique (based on energy model) from
(Noack, 2007) for mining the casual activity graphs
following the rule that the activities in the same clus-
ter should be densely connected and the activities in
different clusters should be sparsely connected. The
main reason for us to select this graph clustering tech-
nique is that it is able to automatically generate a suit-
able number of clusters of vertices according to the
edge structure of a graph and also has a good perfor-
mance. The basic knowledge related to graph cluster-
ing technique is well introduced in (Schaeffer, 2007).
3.2 A Three-step Algorithm
In this section a process model abstraction algorithm
that consists of three main stages is put forward. This
algorithm applies the strategy mentioned in Section
2 which considers the quality of both the potential
high level model and sub-models generated. Let Π :
(SE,STH) −→ SG be a casual activity graph building
method, where SE is the set of event logs, STH is the
set of values of thresholds for judging casual relations
among activities and SG is the set of casual activity
graphs, Γ : SG −→ SC be the graph clustering algo-
rithm from (Noack, 2007), where SC is the set of all
sets of activity clusters. The details of our method is
described in Algorithm 1.
Algorithm 1: Abstracting the raw models mined (AM).
Input: an event log E, the threshold φ for judging
the causal relations among activities, the
threshold α for judging if a high level activity
generated should be removed or not, the
threshold β for searching for merging modes,
a sub-model complexity threshold τ and a
sub-model accuracy threshold χ, a trace
number threshold κ, cluster number n.
Let G be a casual activity graph.
Let C
ac
be a set of activity clusters.
1: G ← Null
2: C
ac
← Null
3: G = Π(E,φ) # build the casual activity graph
4: C
ac
= Γ(G) # mine the activity clusters
5: Stage 1: Find multi-cluster activities and
extract sub-logs.
input: E, C
ac
.
output: a new set of activity clusters MC−C
ac
, a
set of sub-logs SSE.
6: Stage 2: Generate high level activities and high
level model.
input: SSE, E, α, β.
output: a high level model HL−M, a set of high
level activities H−SA, a set of sub-logs
H−SSE.
7: Stage 3: Deal with complex and inaccurate
sub-models from H−SSE.
input: H−SSE, τ, χ, κ, n.
output: a set of sub-models SSM.
Output: a high level model HL−M, a set of
sub-models SSM.
ICEIS 2016 - 18th International Conference on Enterprise Information Systems
66

3.2.1 Find Multi-cluster Activities and Extract
Sub-logs
In this subsection we make the assumption that a set
of activity clusters C
ac
= {c
1
, c
2
, . .. , c
m
} for event
log E has been acquired by Algorithm 1. Sometimes,
an activity a ∈ c
k
∈ C
ac
may also have a lot of casual
relations with the activities from other clusters. For
instance, in the casual activity graph G from Figure
1, the activity a that pertains to cluster C is also con-
nected to many activities in cluster A. In the graph
clustering research area most of the classical methods
developed presume that a vertice of a graph only be-
longs to one specific cluster. The graph clustering al-
gorithm utilised in our approach also has the same as-
sumption. However, it is a normal situation that some
activities in a casual activity graph should pertain to
more than one clusters according to the edge struc-
ture of the graph. Based on this fact, we develop a
new concept named Multi-cluster Activity which is
defined as:
Definition 6. (Multi-cluster Activity)
Let Φ : SG −→ SV be a graph density calculation
schema, where SG is the set of casual activity graphs
and SV is the set of values of graph density. Given a
set of activity clusters C
ac
= {c
1
, c
2
, . .. , c
n
}, an activ-
ity a ∈ c
k
∈ C
ac
is a multi-cluster activity if ∃c
m
∈ C
ac
such that Φ(G
0
m
) ≥ Φ(G
m
), where G
m
= (V
m
,L
m
) rep-
resents the casual activity graph built by using the ac-
tivities from activity cluster c
m
and G
0
m
= (V
m
∪a,L
0
m
)
is a new graph generated by adding the activity a in
G
m
.
Given a graph G = (V,L), Φ(G) = |L|/(|V | ×
(|V | − 1)), where |L| and |V | stand for the total num-
ber of edges and the total number of vertices in graph
G respectively. The main reason to use graph den-
sity for judging a multi-cluster activity is that densely
connected activities are more likely to cause com-
plex process behaviors that can’t be expressed by the
utilised workflow discovery algorithms (our approach
leave these potential complex behaviors to trace clus-
tering techniques). Our method detects all of the
multi-cluster activities in C
ac
and then distributes each
of them to the eligible activity clusters in C
ac
so that a
new set of activity clusters MC−C
ac
can be generated.
For example, let C
0
ac
= {c
1
,c
2
,c
3
} be a set of activ-
ity clusters mined from event log E
0
, c
1
= {a,b,c},
c
2
= {d,e} and c
3
= { f ,g,h}, pretend that Φ(G
c
2
) =
0.5, Φ(G
c
3
) = 0.8, Φ(G
+
c
2
) = 0.63 and Φ(G
+
c
3
) = 0.7,
where G
c
2
is the casual graph for cluster c
2
, G
c
3
for
cluster c
3
, G
+
c
2
is the casual graph generated by adding
the activity a ∈ c
1
in G
c
2
and G
+
c
3
generated by adding
the activity a in G
c
3
. According to Definition 6, a is a
multi-cluster activity because Φ(G
+
c
2
) > Φ(G
c
2
). Af-
terwards, a new activity cluster c
0
2
= {a,d,e} is gener-
ated by adding a in c
2
. Activity a should not be added
in c
3
because Φ(G
+
c
3
) < Φ(G
c
3
). Let’s presume that a
is the only multi-cluster activity found, then the new
set of activity clusters MC−C
0
ac
= {c
1
,c
0
2
,c
3
} can be
generated.
An intuitive proof about the benefit for locating
the multi-cluster activities is shown in the example in
Figure 1. We assume that the activity a in cluster C is
a multi-cluster activity corresponding to cluster A. By
adding a to cluster A the original casual graph G can
be transformed into G
0
as shown in Figure 2. In G
0
,
the interrelations between cluster A and C are further
decomposed which helps improve the quality of the
potential high level model.
Whereafter, the stage 1 of Algorithm 1 creates
a sub-log for each activity cluster in MC −C
ac
=
{mc
1
, mc
2
, . .. , mc
n
}. For example, for the activ-
ity cluster mc
k
∈ MC−C
ac
a new log E
mc
k
is built
which contains all of the sub-traces extracted from
the original event log E where each sub-trace only
includes the activities from mc
k
. For instance, let
MC−C
0
ac
= {{a,b,v,c,d},{u,v,x,z}} be a set of ac-
tivity clusters generated by stage 1 of Algorithm 1
executed on an event log E
0
= {< a,b, c,d,v,x,z >
80
,< a, c,d,u,v,x,z >
150
,< a, b,v,c,d,u,v,z >
200
} (pre-
tend that v is a multi-cluster activity). For the activity
cluster {a,b, v,c, d} ∈ MC−C
0
ac
a new sub-log SE
0
1
=
{< a,b, c,d, v >
80
,< a, c,d >
150
,< a, b,v, c,d >
200
}
can be created by extracting all the sub-traces in
E
0
where these sub-traces only contain the activities
from {a,b, v,c,d}. Similarly, the sub-log SE
0
2
= {<
v,x, z >
80
,< u,v, x,z >
150
,< u,v, z>
200
} can be gener-
ated for activity cluster {u,v, x,z}.
Cluster
A
Cluster
B
Cluster
C
Casual Activity
Graph G
a
Cluster
A’
Cluster
B
Cluster
C
Casual Activity
Graph G’
a
a
Figure 2: Further decompose the interrelations between
cluster A and cluster C.
3.2.2 Generate High Level Activities and High
Level Process Model
We presume that the set of sub-logs SSE =
{E
mc
1
, E
mc
2
, . .. , E
mc
n
} has been output by the stage
1 of Algorithm 1. Let Ψ : SE −→ SS−SE be a method
which splits an event log into several sub-logs where
each sub-log contains the traces with the same start
A Graph and Trace Clustering-based Approach for Abstracting Mined Business Process Models
67

activity and end activity, SE represents the set of event
logs and SS−SE represents the set of all set of sub-
logs. Take the simple event log E
0
= {< a, b,c >
15
,< a,d,c >
15
,< a, f >
3
,< a,e,d >
5
} as an example,
Ψ(E
0
) = {E
0
1
,E
0
2
,E
0
3
}, where E
0
1
= {< a,b,c >
15
,<
a,d, c >
15
}, E
0
2
= {< a, f >
3
} and E
0
3
= {< a, e,d >
5
}. The high level activity generation method for the
stage 2 of Algorithm 1 is depicted in Algorithm 2.
Algorithm 2: Generate high level activities (GHLA).
Input: the set of sub-logs SSE, the original log E,
a threshold α, a threshold β.
Let Λ be a trace merging technique which is
described in Algorithm 3.
Let H−SSE be a set of sub-logs where each
sub-log HE
q
∈ H−SSE is relevant to one
potential high level activity.
Let H−SA be a set of high level activities.
Let M−SSE be a set of event logs with merged
traces.
1: H−SSE ← Null
2: H−SA ← Null
3: M−SSE ← Null
4: for each log E
mc
k
∈ SSE do
5: M−SSE ← M−SSE ∪ Λ(E
mc
k
,SSE,E,β)
# generate log with merged traces.
6: end for
7: for each log ME
p
∈ M−SSE do
8: H−SSE ← H−SSE ∪ Ψ(ME
p
)
9: end for
10: for each log HE
q
∈ H−SSE do
11: H−SA ← H−SA ∪ HL−Activity(q)
# create a high level activity called
# HL−Activity(q) and put it in H−SA.
12: end for
13: for each HL−Activity(p) ∈ H−SA do
14: if |HL−Activity(p)| < α then
15: remove HL−Activity(p) from H−SA
16: remove HE
p
from H−SSE
# |HL−Activity(p)| represents the
# frequency of occurrence for the
# high level activity HL−Activity(p).
17: end if
18: end for
Output: the set of high level activities H−SA, the set
of sub-logs H−SSE.
To explain Algorithm 2 explicitly, an example
is employed here (for the rest part of this sub-
section). Let MC−C
0
ac
= {{a,b,c,d},{u,v,x,z}}
be a set of activity clusters generated by stage
1 of Algorithm 1 executed on an event log
E
0
= {< a,b, d, u,x,z >
100
,< a,b,c,d,v, x,z >
80
,< a,c,d,u,v,x,z >
150
,< a,b,v,c,d,u,x, z >
8
},
SSE
0
= {E
0
mc
1
,E
0
mc
2
} be a set of sub-logs generated
by stage 1 of Algorithm 1 with inputs MC−C
0
ac
and E
0
, where sub-log E
0
mc
1
= {< a, b,d >
100
,<
a,b, c,d >
80
,< a,c, d >
150
,< a,b >
8
,< c,d >
8
},
sub-log E
0
mc
2
= {< u, x,z >
108
,< v,x, z >
80
,<
u,v, x,z >
150
,< v >
8
}. A set of sub-logs H−SSE
0
=
{{< a,b,d >
100
,< a,b, c,d >
80
,< a,c, d >
150
}
0
,{<
a,b >
8
}
1
,{< c,d >
8
}
2
,{< u,x, z >
108
,< u,v,x,z >
150
}
3
,{< v, x,z >
80
}
4
,{< v >
8
}
5
} can be generated
if SSE
0
is directly dealt with by the steps 7−9 of
Algorithm 2 (replace the set M−SSE in step 7 by
using SSE
0
). Afterwards, according to the steps
10−12 of Algorithm 2 a set of high level activities
H−SA
0
= {HL−Activity(0)
330
, HL−Activity(1)
8
, HL−
Activity(2)
8
, HL − Activity(3)
258
, HL −
Activity(4)
80
, HL − Activity(5)
8
} is generated
where each high level activity is related to a specific
sub-log in H−SSE
0
. In our method a high level activity
will replace all the sub-traces that exist in its relevant
sub-log in H−SSE
0
in the original event log E
0
. For
instance, the high level activity HL−Activity(0)
will replace all the sub-traces from the sub-log
{< a,b, d >
100
,< a, b,c,d >
80
,< a, c,d >
150
}
0
in E
0
. Finally, a high level event log
E
0
h
= {< HL − Activity(0),HL − Activity(3) >
100
,< HL − Activity(0),HL − Activity(4) >
80
,<
HL − Activity(0),HL − Activity(3) >
150
,< HL −
Activity(1), HL − Activity(5),HL − Activity(2),HL −
Activity(3) >
8
} is acquired. The steps 13−18 of
Algorithm 2 remove all the infrequent high level
activities generated and their relevant sub-logs in
H−SSE
0
either. Removing infrequent activities which
is in accordance with the main idea of most advanced
process model mining techniques can make the
potential model mined concentrate on exhibiting the
most frequent process behaviors. In our example,
given a threshold α = 20, the high level activity
HL−Activity(1), HL−Activity(2) and HL−Activity(5)
are removed from H−SA
0
and E
0
h
because the value
of their frequency is eight which is smaller than
α. At the same time, the sub-logs {< a,b >
8
},
{<c,d >
8
} and {< v >
8
} are removed from H−SSE
0
.
Afterwards, a high level model can be built by mining
the generated high level event log E
0
h
with an existing
process model discovery algorithm (this is the way
for our method to generate a high level model). Each
sub-log in H−SSE
0
will be used to build a sub-model
for indicating the details of its relevant high level
activity.
Such a design for generating the high level activ-
ities will help maintain the precision (van der Aalst,
ICEIS 2016 - 18th International Conference on Enterprise Information Systems
68

2011) (precision quantifies the ratio of the behaviors
that can be generated by the mined models which are
also recorded in the event logs) of the potential high
level model together with the sub-models generated
compared with the precision of the model mined by
using the original log E
0
(the interested reader can
think about it more deeply). Furthermore, our method
might generate a huge amount of high level activi-
ties while encountering the event logs that have ca-
sual graphs with uniform structures. So we make the
assumption that the casual graphs of the event logs
processed by our method have structures with natural
clusters.
Three infrequent high level activities ( HL−
Activity(1), HL−Activity(2) and HL−Activity(5)) are
generated in the example mentioned above. This is
because activity v happens between activity b and c
in some traces in E
0
infrequently and v belongs to a
different activity cluster from b and c. As a result,
three kinds of infrequent sub-trace <a,b> , <v> and
<c,d > in H−SSE
0
are generated by our method. The
Algorithm 2 will remove all infrequent high level ac-
tivities and also the sub-logs related to these activities.
A lot more activities like activity v might lead to the
situation that a huge amount of process behaviors in
the original event logs will get lost because of being
distributed into many infrequent sub-logs in H−SSE
which then will be removed. In this paper we propose
a trace merging approach (called Λ which appears in
the step 5 of Algorithm 2 and helps preserve the pro-
cess behaviors recorded in the original logs as many
as possible) for fixing this problem by employing the
following definitions:
Definition 7. (merging mode)
Let SSE = {E
mc
1
, E
mc
2
, . .. , E
mc
n
} be a set of sub-logs
output by stage 1 of Algorithm 1 executed on an event
log E. Let st
1
and st
2
be two sub-traces from E
mc
k
∈
SSE, sa
1
be the starting activity of st
1
and ea
2
be the
ending activity of st
2
. The pair (st
1
,st
2
) is called a
merging mode for E
mc
k
if (1) |st
1
| < β × |E
mc
k
| and
|st
2
| < β ×|E
mc
k
| where |st
1
| represents the total num-
ber of traces in E
mc
k
which have the same event se-
quence as st
1
, |st
2
| represents the total number of
traces which have the same event sequence as st
2
and
|E
mc
k
| represents the total number of traces in E
mc
k
,
(2) st
1
and st
2
appear in the same trace from E in the
way <st
1
, . .. , st
2
>, (3) the number of traces in E
mc
k
which have sa
1
as starting activity and ea
2
as end-
ing activity at the same time is larger than or equal to
β × |E
mc
k
|.
Definition 8. (minimum merging mode)
Let (st
1
,st
2
) be a merging mode for a sub-log E
mc
k
∈
SSE, sa
1
be the starting activity of st
1
and ea
2
be
the ending activity of st
2
, < st
1
, . .. , st
2
> be a sub-
trace from the original log E. The merging mode
(st
1
,st
2
) is called a minimum merging mode if there
exists no other merging modes in the sub-trace <
st
1
, . .. |st
2
> or in the sub-trace <st
1
|. .., st
2
>, where
<st
1
, . .. |st
2
> represents a sub-trace generated by re-
moving st
2
from < st
1
, . .. , st
2
> and < st
1
|. .., st
2
>
by removing st
1
from <st
1
, . .. , st
2
>.
For the example mentioned above, given a thresh-
old β = 0.05, the pair (< a, b >, < c, d >) from E
0
mc
1
is a merging mode (there are eight of such merging
modes) because there are 330 traces in E
0
mc
1
that have
activity a as starting activity and activity d as ending
activity which is larger than β × |E
0
mc
1
| = 17.3. In the
meantime, | <a,b> | = 8 < 17.3 and | <c, b> | = 8 <
17.3. Furthermore, the way for the sub-traces <a, b>
and <c, d > to appear in the trace <a, b,v, c,d,u,x, z>
from E
0
also satisfies the condition proposed in Defi-
nition 7. The merging mode (<a,b>,<c,d >) is also
a minimum merging mode according to Definition 8.
Algorithm 3: Merging Traces (Λ).
Input: the set of sub-logs SSE, a sub-log E
mc
k
∈ SSE,
a threshold β.
Let SMD be a set of merging modes.
1: SMD ← Null
2: for each sub-trace st
p
∈ E
mc
k
do
3: if st
p
doesn’t pertain to any merging mode in
SMD then
4: if there exists another sub-trace st
q
∈ E
mc
k
and (st
p
,st
q
) is a merging mode then
5: put (st
p
,st
q
) in SMD
6: put the related sub-trace < st
p
, . .. , st
q
>
from E in E
mc
k
7: remove st
p
and st
q
from E
mc
k
8: remove the sub-traces that appear be-
tween st
p
and st
q
in < st
p
, . .. , st
q
> from
their original places in SSE
9: end if
10: else
11: continue
12: end if
13: end for
Output: the sub-log E
mc
k
with merged traces.
With the two definitions created above, the de-
tails of the trace merging technique Λ is described in
Algorithm 3. Here we still use the last example to
explain how Λ works. As is shown that three infre-
quent high level activities are generated by running
the Algorithm 2 directly starting from step 7 in our
example. One intuitive method to solve this prob-
lem is to find all minimum merging modes in SSE
0
and then merge the sub-traces in the same merging
A Graph and Trace Clustering-based Approach for Abstracting Mined Business Process Models
69

mode (reflected by the steps 2−13 of Algorithm 3
and the steps 4−9 of Algorithm 2). For example,
eight merging modes (< a,b >, < c,d >)
8
for E
0
mc
1
can be constituted (given a threshold β = 0.05) and
each pair of the sub-traces should be merged into a
single sub-trace < a,b, v,c, d > (eight of such merged
sub-traces can be generated). Then, a new set of sub-
logs M−SSE
0
= {ME
0
1
,ME
0
2
} can be formed, where
ME
0
1
= {<a, b,d >
100
,<a,b,c,d >
80
,<a,c,d >
150
,<
a,b, v,c, d >
8
} and ME
0
2
= {< u,x,z >
108
,< v, x,z >
80
,< u,v, x,z >
150
} (ME
0
2
doesn’t contain the kind of
sub-trace < v > any more because all of them are
merged into the kind of sub-trace < a,b, v,c, d > in
ME
0
1
). Afterwards, by using the steps 7−18 of Al-
gorithm 2 to deal with the M−SSE
0
a new set of
sub-logs H−SSE
0
= {{< a,b,d >
100
,< a,b,c, d >
80
,< a,c, d >
150
,< a,b, v,c, d >
8
}
0
,{< u,x,z >
108
,<
u,v, x,z>
150
}
1
,{<v, x,z>
80
}
2
} and a new set of high
level activities H−SA
0
= {HL−Activity(0)
338
,HL−
Activity(1)
258
,HL−Activity(2)
80
} can be generated.
Now no infrequent high level activities exist in H−SA
0
any longer.
3.2.3 Deal With Complex and Inaccurate
Sub-models
In this subsection we presume that a set of sub-logs
H−SSE has been output by the stage 2 of Algorithm
1. For each sub-log in H−SSE a sub-model is mined
with existing workflow discovery technique to depict
the details of the sub-log’s relevant high level activ-
ity. In our approach, the business process recorded in
an event log is expressed by the generated high level
model and the sub-models together. However, the
strategy (mentioned in Section 2) used in our method
try to decrease the number of behaviors in the poten-
tial high level model by hiding most of the original
process behaviors inside the high level activities gen-
erated. As a result, the sub-models for the high level
activities might still be complex and inaccurate. Trace
clustering technique is utilised for solving this prob-
lem.
Let Ω : S−E → S−M be a workflow discovery al-
gorithm, where S−M is the set of process models and
S−E is the set of event logs, Θ
accuracy
: (S−E,S−
M) → SV
accuracy
be a process model accuracy eval-
uation method, where SV
accuracy
is the set of accu-
racy values of the mined process models, Θ
complexity
:
S−M → SV
complexity
be a process model complexity
evaluation method, where SV
complexity
is the set of
complexity values of the mined process models. Let
T
cluster ing
: (S−E,SV
cnumber
) → SS−E be a trace cluster-
ing algorithm, SS−E is the set of all sets of sub-logs
and SV
cnumber
is the set of numbers of the clusters gen-
erated. The main procedure for dealing with the low-
quality sub-models mined is depicted in Algorithm 4.
Algorithm 4: Deal with low-quality sub-models.
Input: the set of sub-logs H−SSE, a sub-model
complexity threshold τ and a sub-model
accuracy threshold χ, a trace number
threshold κ, cluster number n.
Let SSM, SSM
c
be two sets of sub-models.
Let S−E
c
be a set of sub-logs.
Let m
1
, m
2
be two variants of float type.
Let m
3
be a variant of int type.
1: SSM ← Null, SSM
c
← Null
2: S−E
c
← Null
3: m
1
← 0, m
2
← 0
4: m
3
← 0
5: for each sub-log SE ∈ H−SSE do
6: if Θ
accuracy
(Ω(SE), SE) < χ ||
Θ
complexity
(Ω(SE), SE) > τ &&
|SE| ≥ κ then
7: S−E
c
= T
cluster ing
(SE, n)
8: for each sub-log SE
c
∈ S−E
c
do
9: SSM
c
← SSM
c
∪ Ω(SE
c
)
10: m
1
← m
1
+ Θ
accuracy
(Ω(SE
c
),SE
c
)|SE
c
|
11: m
3
← m
3
+ |SE
c
|
12: end for
13: m
2
← m
1
/m
3
# calculate weighted average
# accuracy
14: if m
2
≥ Θ
accuracy
(Ω(SE), SE) then
15: for each sub-model SM
c
∈ SSM
c
do
16: SSM ← SSM ∪ SM
c
17: end for
18: else
19: SSM ← SSM ∪ Ω(SE)
20: end if
21: m
1
← 0, m
3
← 0, SSM
c
← Null
22: else
23: SSM ← SSM ∪ Ω(SE)
24: end if
25: end for
Output: the set of sub-models SSM.
According to Algorithm 4, a sub-log SE from
H−SSE that leads to a low-quality sub-model M (the
quality is judged by using the sub-model accuracy and
complexity thresholds χ and τ in the step 6 of Algo-
rithm 4) will be divided into n sub-sub-logs by us-
ing the trace clustering technique if the number of the
traces inside SE is larger than or equal to a threshold
κ. Afterwards, for each sub-sub-log a sub-sub-model
is built (in the step 9 of Algorithm 4). If the weighted
average accuracy of the sub-sub-models generated is
larger than or equal to the accuracy of the original
ICEIS 2016 - 18th International Conference on Enterprise Information Systems
70

sub-model then these sub-sub-models are added to the
set of sub-models SSM which will be finally output
by Algorithm 4 (Algorithm 4 will not use the sub-
sub-models if their weighed average accuracy is lower
than the accuracy of their related original sub-model).
If a sub-log SE
0
from H −SSE leads to a good-quality
sub-model M
0
then add M
0
in SSM (step 23 of Algo-
rithm 4).
The authors in (Weerdt et al., 2013) develop a met-
ric called Place/Transition Connection Degree (PT-
CD) for quantifying the complexity of a Petri net
which is defined as:
PT−CD =
1
2
|a|
|P|
+
1
2
|a|
|T |
(2)
In Equation 2, |a| represents the total number of
arcs in the process model, |P| is the number of places
and |T | is the number of transitions. The greater the
PT-CD is, the more complicated the model will be.
In this paper, we utilise the Heuristics Miner
(HM) (Weijters et al., 2006) for generating the process
models. The ICS fitness developed in (de Medeiros,
2006) is utilised for evaluating the accuracy of the
mined heuristic net. Then, the Heuristic Net to Petri
Net plugin in ProM 6
2
is used for transforming the
heuristic net mined into a Petri net. Afterwards, the
PT-CD is employed for evaluating the complexity of
the Petri net obtained. The trace clustering technique
GED from (Bose and van der Aalst, 2009) is utilised
for dividing the sub-logs in H−SSE into sub-sub-logs
(step 7 of Algorithm 4).
4 CASE STUDY
We tested the effectiveness of our approach on three
event logs: the repair log (Repair) from (van der
Aalst, 2011), the hospital log (Hospital) from BPIC
2011 (in our experiment an artificial start activity and
end activity are added in the traces from the hos-
pital log) and the log of the loan and overdraft ap-
provals process (Loan) from BPIC 2012. The basic
information about the three logs is shown in Table
1. The quality information of the models mined from
the three logs by using HM is listed in Table 2. Ex-
cept for Place/Transition Connection Degree (PT-CD)
mentioned in the last section, another process model
complexity metric is also used for evaluating the com-
plexity of the mined models in our experiment which
is Extended Cardoso Metric (E-Cardoso) (Lassen and
van der Aalst, 2009).
Firstly, six classical trace clustering techniques
are executed on the three logs which are 3-gram
2
http://www.promtools.org.
Table 1: Basic information of the evaluated logs.
Log Traces Events Event types
Repair 1000 10827 12
Loan 13087 262200 36
Hospital 1143 150291 624
Table 2: Evaluation results for the models mined by using
the log Repair, Loan and Hospital.
Log ICS E −Cardoso PT −CD
Repair 0.6768 31 2.3656
Loan 0.7878 148 3.1478
Hospital 0.6058 2108 2.703
(Song et al., 2009), MR and MRA (Bose and van der
Aalst, 2010), ATC (Weerdt et al., 2013), GED (Bose
and van der Aalst, 2009) and sequence clustering
(SC) (Ferreira et al., 2007). For each trace cluster-
ing approach six sub-logs are generated for every of
the three logs utilised. The assessment results on
these techniques are shown in Table 3. The metric
W
t
− ICS stands for the weighted average ICS fit-
ness based on the number of traces and W
e
− ICS
represents the weighted average ICS fitness based
on the number of events. For example, let S−E =
{E
1
,E
2
,E
3
,E
4
,E
5
,E
6
} be a set of sub-logs output by
a trace clustering technique carried out on event log
E. For a sub-log E
k
∈ S−E, |E
k
|
t
represents the total
number of traces in E
k
, |E
k
|
e
represents the total num-
ber of events in E
k
and ICS
E
k
represents the value of
ICS fitness for the sub-model mined from sub-log E
k
.
Then, the W
t
−ICS for the sub-logs in S−E is equal to
(
∑
6
k=1
|E
k
|
t
× ICS
E
k
)/
∑
6
k=1
|E
k
|
t
and the W
e
− ICS is
equal to (
∑
6
k=1
|E
k
|
e
× ICS
E
k
)/
∑
6
k=1
|E
k
|
e
. According
to the evaluation results shown in Table 3, most trace
clustering techniques perform well on the log Repair
which contains the least trace behaviors among the
three logs. Nevertheless, for the logs Loan and Hos-
pital which have more trace behaviors most trace clus-
tering techniques employed could not bring a signifi-
cant improvement on the accuracy of the mined mod-
els (especially for the log Hospital).
Whereafter, the approach proposed in this paper
is evaluated by using the three logs mentioned above.
The threshold φ for judging the casual relations is set
to zero (such a setting will help find more complete
activity clusters), the threshold α for judging whether
a high level activity generated should be removed or
not is set to 20, the threshold β for searching for the
merging modes is set to 0.05, the sub-model complex-
ity threshold τ (for PT-CD) is set to 2.5, the sub-model
accuracy threshold χ (for ICS fitness) is set to 0.8, the
trace number threshold κ is set to 100 and the number
of clusters for the trace clustering technique GED is
A Graph and Trace Clustering-based Approach for Abstracting Mined Business Process Models
71

Table 3: Evaluation results for the six classical trace cluster-
ing techniques executed on the log Repair, Loan and Hospi-
tal.
Log Method W
t
− ICS W
e
− ICS
Repair 3-gram 0.9299 0.9326
MR 0.8123 0.814
MRA 0.8056 0.8055
ATC 0.9971 0.996
GED 0.7908 0.7907
SC 0.9823 0.9802
Loan 3-gram 0.7965 0.7282
MR 0.7828 0.6984
MRA 0.8181 0.7285
ATC 0.7653 0.5665
GED 0.8038 0.7992
SC 0.9255 0.9164
Hospital 3-gram 0.6153 0.69
MR 0.5785 0.6622
MRA 0.5629 0.6844
ATC 0.7583 0.705
GED 0.6003 0.6837
SC 0.7354 0.7129
set to 6. The quality information of the sub-models
generated is shown in Table 4, the quality informa-
tion of the three high level models (for the log Repair,
Loan and Hospital) output by our technique is shown
in Table 5 and the basic information of the three high
level logs created by our technique is shown in Table
6.
According to Table 6, the generated high level
logs H-Repair and H-Hospital contains fewer activi-
ties than their related raw event logs Repair and Hos-
pital. The main reason is that the activities in the orig-
inal repair log and hospital log can form high qual-
ity activity clusters (more activity relations inside the
cluster and fewer among the clusters). In the exper-
iment about 1% events from log Hospital and 0.5%
events from log Loan are removed together with the
infrequent high level activities generated and for the
log Repair no events are removed (very few events are
removed because of the effects of the trace merging
technique proposed in Section 3).
According to Table 5, all of the three high level
models generated have high accuracy which benefits
from the abstraction strategy put forward in Section
2. For the high level activities in the three built high
level models, the average accuracy of their relevant
sub-models is also generally good.
5 RELATED WORK
Trace clustering technique is one of the most effective
approaches for dealing with the negative impacts from
high variety of behaviors recorded in event logs. Sev-
eral classical trace clustering approaches have been
proposed in the literature. In (Song et al., 2009) the
authors put forward an approach which is able to ab-
stract the features of the traces from event logs into
five profiles that includes activity profile, transition
profile, case attributes profile, event attributes profile
and performance profile. Afterwards, these profiles
are converted into an aggregate vector so that the dis-
tance between any two traces can be measured. The
main advantage of this technique is that it considers
a complete range of metrics for clustering traces. In
(Bose and van der Aalst, 2010) and (Bose and van der
Aalst, 2009) the context-aware trace clustering tech-
niques are proposed which try to improve the output
results of trace clustering by employing the context
knowledge that can be acquired from event logs. In
(Bose and van der Aalst, 2010) the authors point out
that the feature sets based on sub-sequences of traces
are context-aware and can express some process func-
tions. The traces that have many common conserved
features should be put in the same cluster. The authors
in (Bose and van der Aalst, 2009) develop an edit
distance-based trace clustering algorithm. The con-
text knowledge mined from event logs are integrated
in the calculation procedure for the cost of edit opera-
tions. The Markov trace clustering method is put for-
ward in (Ferreira et al., 2007). This method calculates
a potential first-order Markov model for each cluster
based on an expectation-maximization algorithm. A
trace is sent to a cluster which has a Markov model
that can generate this trace with a high probability. In
(Weerdt et al., 2013) a novel technique named active
trace clustering is presented. This technique tries to
optimise the fitness of each cluster’s underlying pro-
cess model during the run time without employing the
vector space model for the clustering process. It sim-
ply distributes the traces to the suitable clusters by
considering the optimization of the combined accu-
racy of the potential models for these clusters. Most
trace clustering techniques perform well for dealing
with the event logs with a moderate amount of trace
behaviors. However, such techniques can not assure
a good result while being executed on the logs with
massive behaviors (as is shown in the case study in
Section 4).
Process model abstraction approach is also effec-
tive for dealing with the ”spaghetti-like” business pro-
cess models mined. In (Bose and van der Aalst, 2009)
the authors develop a two-step approach for mining
ICEIS 2016 - 18th International Conference on Enterprise Information Systems
72

Table 4: The weighted average quality of the sub-models generated by our method.
Log W
t
− ICS W
e
− ICS W
t
− E−Cardoso W
e
− E−Cardoso W
t
− PT−CD W
e
− PT−CD
Repair 0.9738 0.9687 11.57 12.46 2.0688 2.0929
Loan 0.9514 0.9297 21.934 26.4995 2.1729 2.2238
Hospital 0.8891 0.902 467.84 465.2 3.1257 3.0956
Table 5: The quality information of the high level models
generated for each log by our technique.
Log ICS E −Cardoso PT−CD
Repair 0.978 33 2.483
Loan 0.9671 137 3.378
Hospital 0.95 192 2.4328
Table 6: Basic information of the generated high level logs.
H-Log Traces Events Event types
H-Repair 1000 2700 10
H-Loan 13087 40783 44
H-Hospital 1143 37740 65
hierarchical business process models. This approach
searches for the sub-traces that repeatedly happen in
event logs. Two kinds of such sub-traces are defined
which are tandem arrays and maximal repeats. This
approach firstly searches for all the tandem arrays and
the maximal repeats in the event logs and then replace
them in the original event logs by using high level ac-
tivities (each high level activity is an abstraction of a
tandem array or a maximal repeat found) so that the
high level event logs can be generated. Finally, the
high level models (more accurate and simpler) could
be mined by using existing workflow discovery algo-
rithms executed on the high level logs. The authors
in (Baier and Mendling, 2013) indicate that the low
level events recorded in the event logs may be too
granular and should be mapped to the high level ac-
tivities predefined in the enterprise process specifica-
tions. Hence, they put forward a mapping method that
combines the domain knowledge captured from these
specifications. With the high level activities generated
the better models on the higher abstraction level can
be built. The authors in (Conforti et al., 2014) present
an automated technique for mining the BPMN mod-
els with subprocesses. This technique analyses the
dependencies among the data attributes attached to
events. The events that are judged to have high depen-
dencies will be put in the same subprocesses. Most
of the classical process model abstraction approaches
presented focus mainly on searching for the subpro-
cesses and can not assure the quality of the built high
level models. It is possible that the high level activi-
ties in the underlying abstracted models may still have
a large amount of relations among each other.
6 CONCLUSION
In this paper we proposed a new method which com-
bines the characters of the classical model abstrac-
tion techniques and the trace clustering techniques
for solving the problem of inaccurate and complex
process models mined. This method is able to opti-
mise the quality of the underlying high level models
through an efficient abstraction strategy and also con-
siders the quality of the sub-models generated through
trace clustering techniques. Finally, the details of the
business processes recorded in the event logs are re-
vealed by the high level models built together with the
generated sub-models where each sub-model shows
the details of its relevant high level activity. Though
the results of the case study we demonstrated the ef-
fectiveness of our technique.
Our future work will mainly be focused on devel-
oping new trace clustering techniques with higher per-
formance to help deal with the complex and inaccu-
rate sub-models generated for the high level activities.
We will also validate our method on some other real-
life cases.
REFERENCES
van der Aalst, W., van Dongen, B. F., Herbst, J., Maruster,
L., Schimm, G. and Weijters, A. J. M. M. (2003).
Workflow Mining: A Survey of Issues and Aproaches.
In Data and Knowledge Engineering, 47(2): 237–267,
2003.
van der Aalst, W. (2011). Process Mining: Discovery, Con-
formance and Enhancement of Business Processes.
Springer-Verlag Berlin Heidelberg, 1nd edition.
Weerdt, J. D., vanden Broucke, S., Vanthienen, J., and Bae-
sens, B. (2013). Active Trace Clustering for Improved
Process Discovery. IEEE Transactions on Knowledge
and Data Engineering, 25(12):2708–2720.
Bose, R. and van der Aalst, W. (2009). Context Aware Trace
Clustering: Towards Improving Process Mining Re-
sults. In Proceedings of the SIAM International Con-
ference on Data Mining, pages 401–412.
Bose, R. and van der Aalst, W. (2010). Trace Cluster-
ing Based on Conserved Patterns: Towards Achiev-
ing Better Process Models. In Business Process
Management Workshops, volume 43 of Lecture Notes
in Business Information Processing, pages 170–181.
Springer Berlin.
A Graph and Trace Clustering-based Approach for Abstracting Mined Business Process Models
73

Song, M., Gnther, C. and van der Aalst, W. (2009). Trace
Clustering in Process Mining. In Business Process
Management Workshops, volume 17 of Lecture Notes
in Business Information Processing, pages 109–120.
Springer Berlin.
Ferreira, D. R., Zacarias, M., Malheiros, M.and Ferreira, P.
(2007). Approaching Process Mining with Sequence
Clustering: Experiments and Findings. In Business
Process Management (BPM 2007), volume 4714 of
Lecture Notes in Computer Science, pages 360–374.
Bose, R. and van der Aalst, W. (2009). Abstractions in Pro-
cess Mining: A Taxonomy of Patterns. In Business
Process Management (BPM 2009), volume 5701 of
Lecture Notes in Computer Science, pages 159–175.
Baier, T. and Mendling, J. (2013). Bridging Abstraction
Layers in Process Mining: Event to Activity Mapping.
In BPMDS 2013 and EMMSAD 2013, volume 147
of Lecture Notes in Business Information Processing,
pages 109–123.
Conforti, R., Dumas, M., Carcia-Banuelos, L. and Rosa,
M. L. (2014). Beyond Tasks and Gateways: Dis-
covering BPMN Models with Subprocesses, Bound-
ary Events and Activity Markers. In Business Process
Management (BPM 2014), volume 8659 of Lecture
Notes in Computer Science, pages 101–117.
Schaeffer, S. E. (2007). Graph Clustering. In Computer
Science Review, 1(1):27–64, 2007.
Hompes, B. F. A., Verbeek, H. M. W. and van der Aalst,
W. (2014). Finding Suitable Activity Clusters for De-
composed Process Discovery. In Proc. of the 4th Int’l.
Symp. on Data-driven Process Discovery and Anal-
ysis, volume 1293 of CEUR Workshop Proceeding,
pages 16–30.
Weijters, A., van der Aalst, W. and Alves de Medeiros,
A. K. (2006). Process Mining with the Heuristics Al-
gorithm. In BETA Working Paper Series, 166, 2006.
Noack, A. (2007). Energy Models for Graph Clustering. In
J. Graph Algorithms Appl, 11(2):453–480, 2007.
de Medeiros, A. A. (2006). Genetic Process Mining.
In PhD. thesis, Eindhoven University of Technology,
2006.
Lassen, K. B. and van der Aalst, W. (2009). Complexity
Metrics for Workflow Nets. In Inform. Software Tech-
nol., 51:610–626.
ICEIS 2016 - 18th International Conference on Enterprise Information Systems
74
