
Evacuation Simulation under Different Conditions using a Safest
Path Routing Algorithm
Denis Shikhalev
1
, Renat Khabibulin
1
, Ulrich Kemloh
2
and Sergey Gudin
3
1
The State Fire Academy of EMERCOM of Russia, Moscow, Russia
2
Jülich Supercomputing Center, Forschungszentrum Jülich GmbH, Jülich, Germany
3
Ghent University, Ghent, Belgium
Keywords: Pedestrians Dynamics, Evacuation Strategies, Safest Evacuation Route.
Abstract: In this contribution we propose a safest path route algorithm for determination of the safest path directions
of pedestrians in case of fire. The model and the algorithms are implemented in an open source framework
(JuPedSim) which is a research platform to simulate pedestrian dynamics. We found that increasing the
importance of the obstruction criteria (responsible for people’s density) leads to a reduction of the total
evacuation time. The proposed algorithm allows the even distribution of the evacuees to all available
emergency exits, when there is an uneven distribution of people on the escape routes while avoiding a place
with fire hazards. We simulate the evacuation of a shopping centre and showed that the application of the
algorithm can reduce the total evacuation time up to 63% depending on the settings of the algorithm.
1 INTRODUCTION
In the last few decades, large fires in shopping malls
were the reason of many people's death. A few of
them are listed below:
December 25, 2000. A fire occurred in a
central shopping Centre (Luoyang, China). The
fire killed 309 people;
August 01, 2004. A fire occurred in a
supermarket (Asunción, Paraguay). The fire
killed 464 people;
May 28, 2012. A fire occurred in a Villagio
Mall (Doha, Qatar). The fire killed 19 people,
including 13 children.
One of distinguishing features of shopping malls
is the uneven distribution of people in the building.
It can influence an organization’s evacuation process
and leads to an unbalanced use of emergency and
exits routes. A significant number of people are
accumulated in supermarkets and shops of home
appliances compared to other shops of a shopping
mall.
An analysis of some existing escapes route
systems from different countries (Shikhalev and
Khabibulin, 2013) showed that only a third of the
systems were able to determine the direction of the
escape routes using a scientifically founded method.
The studies of many authors (Carattin, 2011;
Kobes, Helsloot et al., 2010; Samochine, 2004;
Sandberg, 1997) indicate the following problems in
the area of evacuation management in shopping
malls:
Uneven distribution of people inside shopping
malls ;
Organisation problems in the evacuation
process, done by the staff of shopping malls;
Lack of information about possible (available)
evacuation directions.
Therefore, the lack of both models and
algorithms of information and analytical support for
evacuation managements leads to the fact that a
decision maker cannot objectively evaluate the
whole range of hazards and determine safe routes for
people during an emergency evacuation.
To solve these problems, a mathematical model
of a safest path route algorithm was developed. The
algorithms are used to calculate the safest path for
people in a danger zone, and to direct them to a safer
area (Shikhalev, Khabibulin et al, 2014).
In a first estimation the model showed a positive
impact on the evacuation time and overall on the
people’s safety during evacuation simulations
(Shikhalev, Khabibulin et al, 2014). Nevertheless, it
is needed to complete a full estimation of all features
of the model as well as determine the best
combination of properties for evacuation
simulations.
62
Shikhalev, D., Khabibulin, R., Kemloh, U. and Gudin, S.
Evacuation Simulation under Different Conditions using a Safest Path Routing Algorithm.
In Proceedings of the 18th International Conference on Enterprise Information Systems (ICEIS 2016) - Volume 2, pages 62-69
ISBN: 978-989-758-187-8
Copyright
c
2016 by SCITEPRESS – Science and Technology Publications, Lda. All rights reserved
In this paper we consider the results of
evacuation simulations using the algorithm.
Simulations were performed using the Jülich
Pedestrian Simulator, JuPedSim (Kemloh, Chraibi et
al, 2015) with various numbers of people and
different objects.
This work is structured as follow:
In the second section we introduce the model and the
algorithm. In the third section, we present computer
simulations and analyses. Some concluding remarks
are given in the last section.
2 DESCRIPTION OF THE
SAFEST PATH ROUTE
ALGORITHM
The safest path route algorithm is applied for
calculation of the safest path for people from
different points of a building to the exterior of the
building. Originally the safest path route algorithm
was created for a shopping mall. The main tasks of
the algorithm are to calculate a safest route and
direct people by a path (current or newly defined).
The algorithm of Floyd-Warschall (Floyd, 1962)
was applied for calculating the safest path to the
nearest gate. Normally, Floyd-Warschall’s algorithm
finds the shortest path between all pairs of edges in a
graph. A physical distance is used as the weight of
the edges. For our task, we used a complex criterion
φ as the weight of the edges. φ is calculated using
Equation 1:
222
)()()(
iii
lba ⋅+⋅+⋅=
γβαϕ
(1)
at:
a → min, i=1,…,n
b → min, i=1,…,n
l → min, i=1,…,n
where:
a – an obstruction criterion;
b – a timeliness criterion;
l – a length criterion.
α, β, γ – the weight coefficient at a, b, l .
The obstruction criterion is determined by the
ratio of the people’s density on a section of the
escape route network, to the maximum people’s
density that does not cause adverse effects to
humans. The timeliness criterion is directly linked to
fire hazards (high temperature, a large amount of
smoke, low visibility, toxic products of combustion
etc.). The length criterion is the relative length of the
current section. It is calculated as the ratio of current
escape route length, to the maximal escape route
length in a building. The coefficients (α, β, γ) are
added to regulate the importance of the individual
criteria. More details about the criterion and
manners of its computing are found in previous
work (Shikhalev, Khabibulin et al, 2014).
Under sections of escape route, we consider the
crossing of two (or more) escape routes in the
corridors of a shopping mall. Hence a section of an
escape route corresponds to an edge in the graph of a
shopping mall, and a place of cross of two (or more)
escape routes corresponds to a vertex.
We used the JuPedSim simulator for computer
implementation of the algorithm. The Generalized
Centrifugal Force Model (GCFM) is applied into the
simulator to simulate an evacuation process
(Chraibi, Seyfried et al, 2010). GCFM belongs to the
class of forces based models (Helbing and Molnar,
1995) and describes the movement of people at the
operational level (Hoogendorn, Bovy et al, 2002) i.e.
defines basic rules for the pedestrians such as
acceleration, braking and stop. Motion of the
pedestrians is determined by a so-called "social
power" (Helbing and Molnar, 1995). Calibration of
the basic parameters of GCFM (attractive and
repulsive forces, the size of the semi-axes of the
ellipse depending on the density and velocity of the
people flow etc.) were performed in (Burghardt,
2009; Meunders, 2011). Verification and validation
of the GCFM, as well as a more detailed description
is given in (Chraibi, Seyfried et al, 2010; Chraibi,
2012; Kemloh, 2012).
At each step of the simulation, the evacuees are
sent through the shortest path, to the nearest
emergency exit in the building i.e. a shortest path
route algorithm (ShPA) is used to determine the
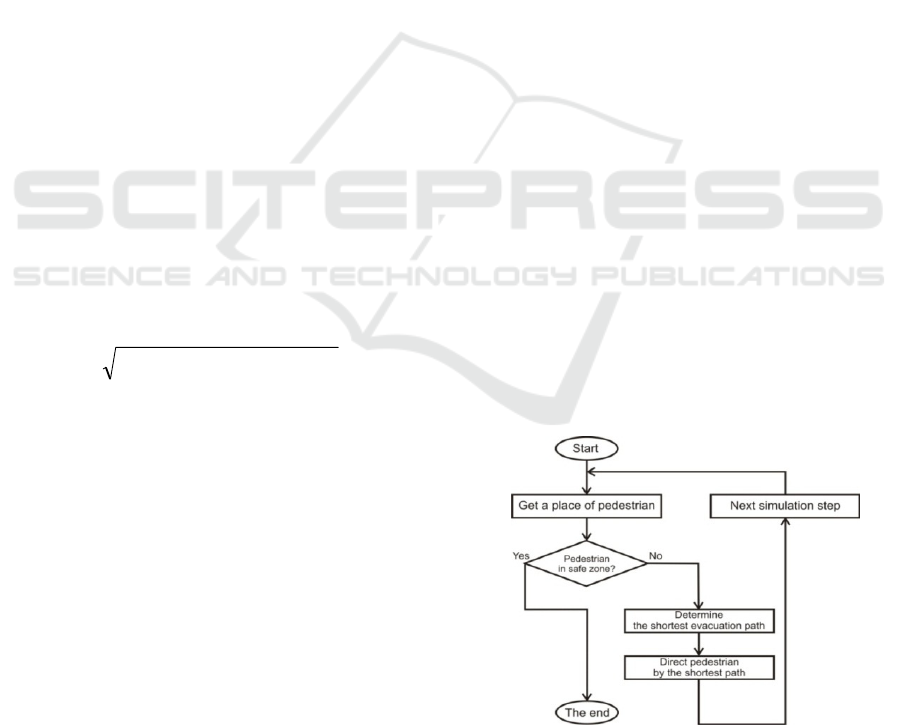
shortest escape route (Fig. 1).
Figure 1: The shortest path route algorithm (ShPA).
However, there is a need to change the ShPA
with regards to the problem of determination of the
Evacuation Simulation under Different Conditions using a Safest Path Routing Algorithm
63
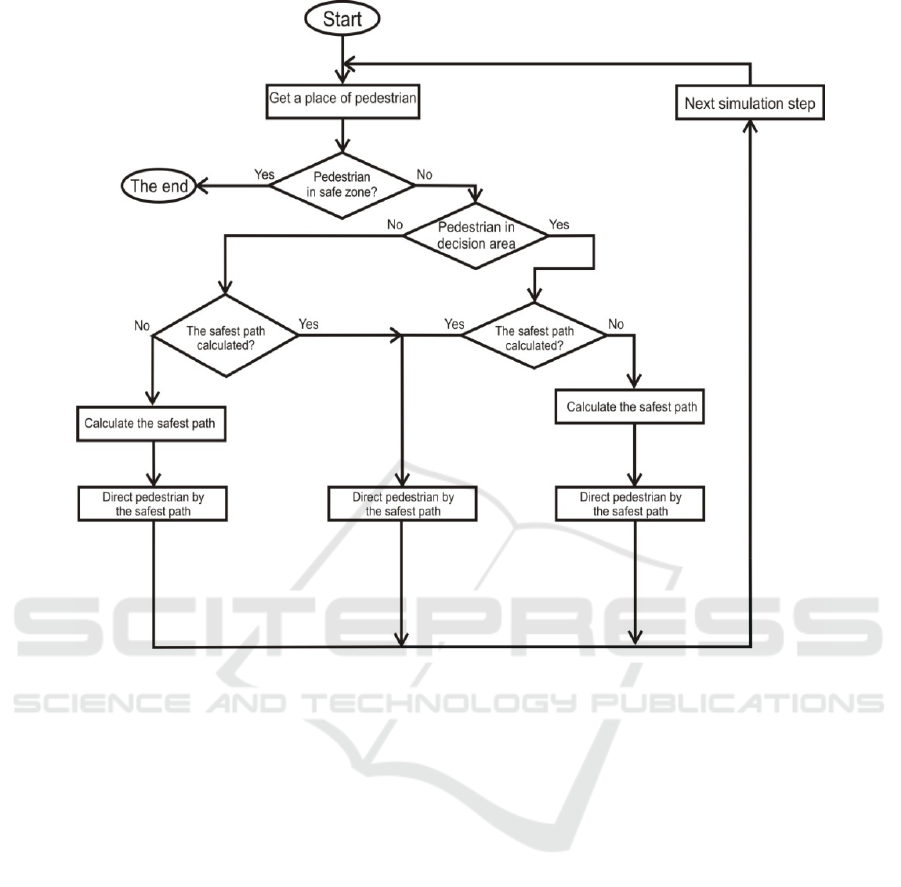
Figure 2: The safest path route algorithm (SaPA).
safe evacuation routes. For this purpose, a safest
path route algorithm (SaPA) was developed (Fig. 2)
An update frequency (UF) was added into the
SaPA for the possibility of regulating how often the
algorithm will be refreshed. Thus, a UF value of 5
means that the safest path will be calculated once for
every 5 seconds and the direction of movement will
also be updated (in decision areas) after every 5
seconds.
The shortest path is given for all evacuees in an
initial stage (pre-evacuation). Then the safest path is
computed for each node (decision area) according to
the UF. In other words, the decision area is a place
where two or more routes crossed. It is possible
from this place (decision area), to direct the
pedestrians by a new path, for example, by applying
dynamic indicator (Shikhalev and Khabibulin,
2013). If a current path is not a safest path anymore,
a re-routing will happen in the decision area.
The safest path route algorithm was implemented
into JuPedSim as a separate module and it can be
chosen from other routing algorithms such as a
quickest or shortest path algorithms.
The main purpose of simulation is to evaluate the
effectiveness of the safest path route algorithm. This
evaluation is done by comparing the performance of
the shortest path route algorithm and the safest path
route algorithm.
Thus, the following research problems should be
answered during simulation:
How are the a-criteria and b-criteria changed in
the process of evacuation and under what
quantitative values of criteria does the process
of re-routing happens?
Which are the effects of re-routing pedestrians?
How do weight coefficients affect the course of
the evacuation process?
How does the update frequency affect the
course of the evacuation process?
When it is advisable to apply the safest path
route algorithm?
To answer these questions, it is necessary to
conduct a preliminary assessment of the adequacy of
the developed algorithm. From there, we perform a
computer simulation of the evacuation process on
the topology of an existing shopping mall, as an
example.
ICEIS 2016 - 18th International Conference on Enterprise Information Systems
64
3 SIMULATION AND ANALYSIS
In this section we provide simulation results and its
analysis.
3.1 Preliminary Assessment
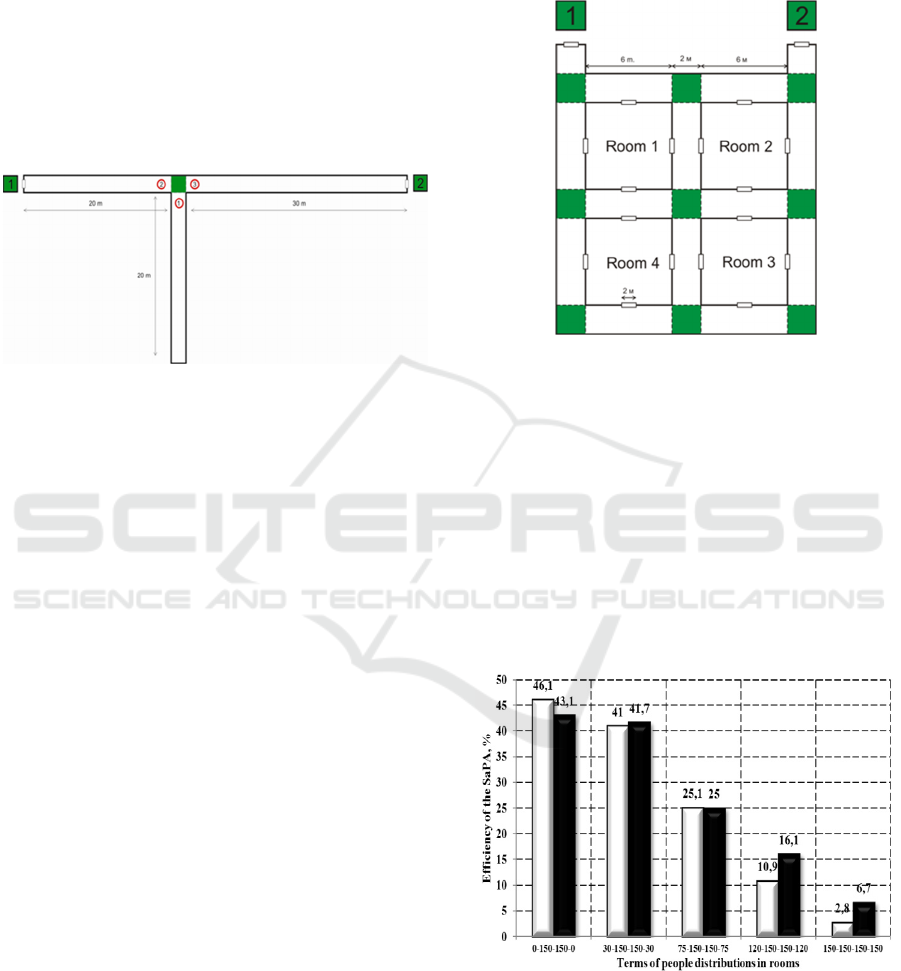
Several series of simulations at the T-junction of
escape routes (Fig. 3) were carried out within a
preliminary assessment of the SaPA as well as on the
abstract model of the building (Fig. 4).
Figure 3: Objects of simulation within a preliminary
assessment – T-junction.
Simulation results at the T-junction identified
one of the features of the SaPA: the safest path route
algorithm behaves itself as the shortest path route
algorithm when there are no congestions or high-
density of pedestrians. It was also found that the
usage of weight coefficients has an impact on the
time of re-routing during evacuation. Weight
coefficients (0,9-0-0,1) lead to the re-routing that
occurs both with few and many pedestrians. In its
turn, weight coefficients of 0,6-0-0,4 allow to re-
route flows when we have a high number of
pedestrians. Moreover, re-routing occurs only at the
maximum configured number of people in
simulation. (250 per., 6.25 pers./m
2
in a case when
the weights are not applied). Re-routing moments
and duration of re-routing become longer when the
importance of a-criterion is increased.
The results obtained in the T-junction
simulations led us to several conclusions:
The safest path route algorithm behaves as the
shortest path route algorithm in the case where
there are no congestions or high-density of
pedestrians;
The application of weight coefficients
influences the course of the evacuation process
where the escape routes sections are of
different geometrical size.
In order to achieve the minimal evacuation
time and prevent pedestrians’ congestions, it is
necessary to increase the importance of a-
criteria. Reducing the importance of a-criteria
leads to an increase in evacuation time;
It is possible to regulate (zoom or zoom out) a
moment of re-routing of evacuation flows by
applying different weight coefficients.
Figure 4: Objects of simulation within a preliminary
assessment – Abstract model of the building.
After simulations at T-junction we continue in
the abstract model (fig. 4). Simulation results in the
abstract model allow us to state the following facts.
Firstly, for uneven distribution of people during
evacuation, the SaPA can immediately distribute
pedestrians evenly to the emergency exits. This in
turn significantly affects the evacuations time.
Efficiency of the SaPA (fig. 5) reduces when there is
an uneven distribution of people. Under efficiency
we understand the ratio of evacuation time with the
SaPA to evacuation time with the ShPA.
Figure 5: Efficiency Distribution of the SaPA depending
on terms of people distributions. (0-150-150-0 value
corresponds to the people distribution in rooms 1,2,3 and
4, respectively (Fig. 4)). White – scenario 1, black -
scenario 2.
Secondly, there is a negative efficiency of the
SaPA at 4%. This happened in the case where we
Evacuation Simulation under Different Conditions using a Safest Path Routing Algorithm
65
had an uneven distribution of a small number of
people (up to 50 people). Having reviewed the
evacuation process in decision area, a reason of the
negative efficiency of the SaPA was found. This is
due to the update frequency of the SaPA which was
equal to 1. There were many re-routing of
pedestrians while they followed the decision areas
(geometric size of decision area is 2 meters by 2
meters). Pedestrians were sometimes directed to
different exits. This in turn, had to slow down the
speed of pedestrians and as a result, increase the
evacuation time. Thus, an optimal value of the
update frequency should be investigated and
determined. The simulation results in the abstract
model led us to conclude these facts:
Weight coefficients do not play any role when
there are two identical routes (by both
geometric characteristics and number) from
decision area to the exit;
A SaPA update frequency of 1 has a negative
impact on evacuation process given a small
number of pedestrians;
The SaPA allows evenly "download" sections
of evacuation routes when there is an uneven
distribution of pedestrians. Other words the
SaPA directs pedestrians by routes which are
not using during evacuation but can be.
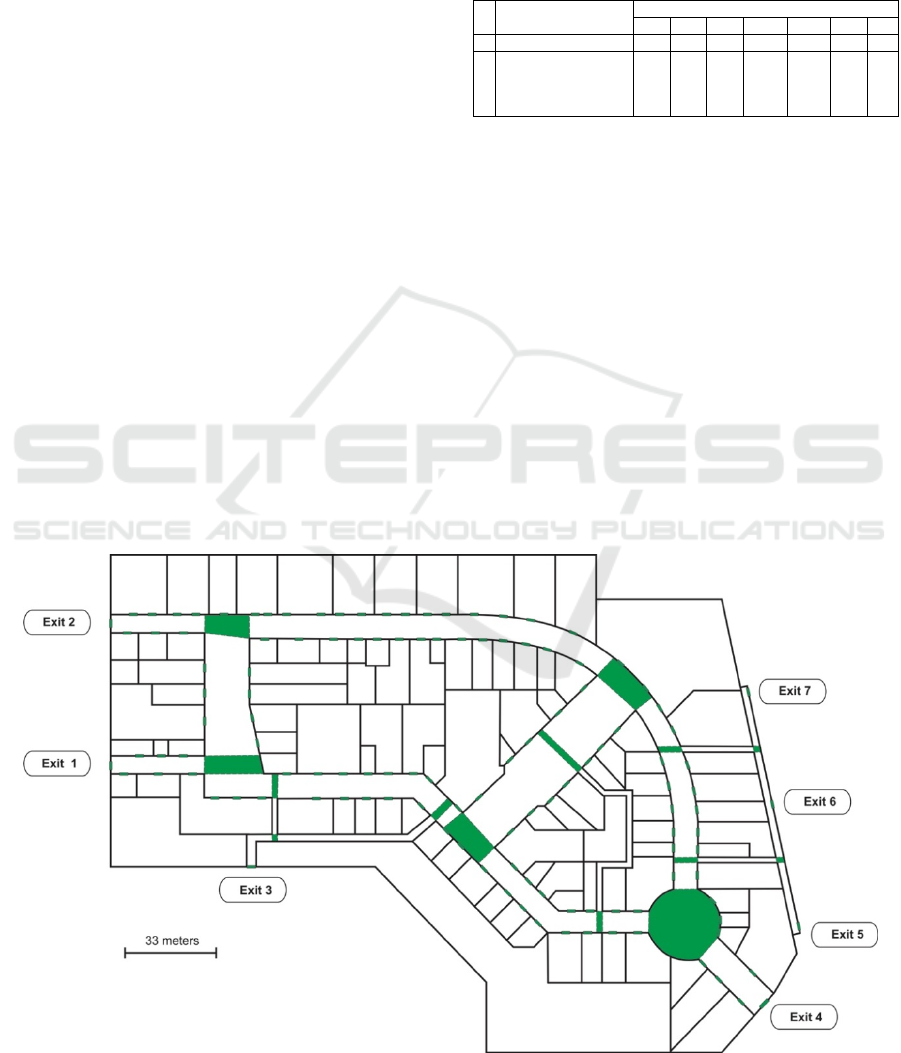
3.2 Simulation of a Shopping Mall
After preliminary assessment we performed
simulations in a shopping mall. The plan is shown in
figure 5. The color represents the decision areas.
Some geometric characteristics of the evacuation
exits and evacuation route sections in the front of
evacuation exits are shown in Table 1.
Table 1: Geometric characteristics of the evacuation exits.
№
Parameter
Evacuation exit
1 2 3 4 5 6 7
1 Width, m. 3,0 3,0 1,5 4,0 2,0 2,0 2,0
2
Width of evacuation
route section in the
front of evacuation
exit, m.
6,4 6,4 2,0 10,1 2,2 2,2 2,2
The number of people in evacuation simulation
was chosen in the rate of 1 person per 1 m
2
of retail
premises (total number of evacuees in 2609 person).
The influence of the update frequency on the
evacuation process was considered in the first series
of simulation. The simulation results are shown in
figure 7.
Analysis of figure 7 shows that for many people,
the closest emergency exit is №7, but based on its
geometrical characteristics, it is not preferable
because of its small width (See Table. 1). However,
most of the pedestrians were distributed between
exits 1, 2, 4 which are preferable due to their
geometrical dimensions (exit width). Thus, the
direction of all pedestrians to the shortest emergency
exits is not always justified and often leads to a
significant increase of total evacuation time.
Figure 6: Layout of shopping mall.
ICEIS 2016 - 18th International Conference on Enterprise Information Systems
66

Figure: 7: People distribution to emergency exits. A -
ShPA; B - SaPA with update frequency equal 5 (result of
minimal evacuation time); C - SaPA with update
frequency equal 13 (result of maximal evacuation time).
Application of the SaPA allows to reduce evacuation
time up to 63% depending on the update frequency
of the algorithm.
Assessment of the update frequency of the
algorithm showed that the preferred frequency is 5.
That is why the frequency used for further studies
will be 5.
The simulation results in the T-junction suggest
that using different weight coefficients can reduce the
evacuation time. An analysis of the effect of weight
coefficients on pedestrian’s distribution to emergency
exits was conducted in the next stage of simulation.
The simulation results are shown in Figure 8.
Results confirmed previous findings about the
effect of the weight coefficients on evacuation process.
It should be noted that using weight coefficients of 0.7-
0-0.3 or 0,6-0-0,4 leads to the same results as not using
weight coefficients at all. Nevertheless, these
conditions (weights: 0,7-0-0,3; 0,6-0-0,4; without
weight coefficients) contribute to reducing evacuation
time in comparison with ShPA by 21%.
The main difference between the weights of 0,7-
0-0,3 or 0,6-0-0,4, however, as between all the
weight coefficients is the people’s distribution
according to emergency exits.
Figure 8: Weight coefficients vs. evacuation time.
Figure 9 presents the data with more details on
the distribution of people to emergency exits.
Figure: 9. The pedestrian distribution to emergency exits
depending on the weights. A – Weight coefficients are
0,9-0-0,1. B - weight coefficients are 0,8-0-0,2. C - weight
coefficients are 0,7-0-0,3. D - weight coefficients are 0,6-
0-0,4. E – without weight coefficients.
Figure 9 shows that the largest reduction of the
evacuation time was achieved when pedestrians
were directed to wider exits and in contrast the
maximum evacuation time was achieved by
"loading" narrow exits.
It was also interesting to consider the fairly
frequent assertion of researchers in the field of
human behaviour, that people in a fire will follow
the escape routes they used to get into the building
(Kobes, Helsloot et al, 2010; Samoshin, 2004;
Sandberg, 1997). It is likely that visitors enter a
building on the gate leading from the metro stations,
parking places, etc. Corresponding exits are 1, 2 and
4 in figure 6.
To carry out the simulation exits (3, 5, 6 and 7)
are blocked, because it is unlikely that they can be
used by most pedestrians entering the building.
Different cases were simulated and investigated
particularly when all of the exits (1, 2, and 4) are
opened and then when one of the exits is blocked.
The simulation results for different positions of the
emergency exits are shown in figure 10.
Figure 10: Dependence of the evacuation time to an
algorithm (SaPA vs. ShPA). White – SaPA. Black – ShPA.
Evacuation Simulation under Different Conditions using a Safest Path Routing Algorithm
67

The simulation results show that the direction of
all pedestrians only through the main evacuation
exits can significantly reduce the evacuation. For the
last part of simulation we elaborated four evacuation
strategies:
Strategy 1. Applying the SaPA with weight
coefficients equal 0,9-0-0,1 provided that all
exits are opened;
Strategy 2. Applying the SaPA with weight
coefficients equal 0,9-0-0,1 provided that only
the main exits are opened;
Strategy 3. Applying the ShPA provided that all
exits are opened;
Strategy 4. Applying the ShPA provided that
only the main exits are opened.
Figure 11 shows the simulation results with
mentioned strategies. Minimal evacuation time was
achieved when the strategy 1 was chosen. The SaPA
is still preferable than the ShPA only if main
emergency exits are available. However, for cases
where the only possibility is to direct people through
the shortest path, it is necessary to use strategy 4.
Figure 11: Ratio of evacuation time to an evacuation
strategy.
4 CONCLUSIONS AND FUTURE
WORK
In this paper we presented the results of full
assessment of the safest path route algorithm in the
framework of evacuation simulations. It was found
that the weights of 0,9-0-0,1 should be applied to
prevent congestions during evacuations, when
people are of high density. For the algorithm, an
update frequency of 5 should be chosen to timely
direct the pedestrians to safe evacuation paths. The
algorithm is suitable for cases when there are no
widely dispersed emergency exits, uneven
distribution of evacuation flows to the exits as well
as to prevent congestions of high density of people
in evacuation.
Obtained results allow as talk about effectiveness
of proposed algorithm. However an experimental
assessment is required for its application in a real
evacuation process.
The following phenomena should be investigated
within the frame of an experimental assessment:
people's reaction to dynamic indicators;
do pedestrians follow the routes which would
be offered;
how staff responsible for evacuation
organization will operate with dynamic
indicators;
A plan of future research is to create a decision
support system for emergency evacuation in a
shopping mall based on obtained results.
ACKNOWLEDGEMENTS
The simulation results of this paper would never
have appeared without sincere assistance of member
of the «Civil security and traffic» division of Jülich
Supercomputing Centre at the Forschungszetrum
Jülich GmbH.
REFERENCES
Burghardt, S., 2009. Analyse und vergleichende
Untersuchung zum Fundamentaldiagramm a Treppen.
Masterthesis. Bergische Universität Wuppertal.
Carattin, E., 2011. Wayfinding architectural criteria for the
design of complex environments in emergency
scenarios. In Advanced research workshop
proceedings. Santander, Universitad de Cantabria.,
Spain.
Chraibi, M., Seyfrid, А. and Schadschneider, А., 2010.
Generalized Centrifugal Force Model for pedestrian
dynamics. Physical review E.
Chraibi, M., 2012. Validated force-based modeling of
pedestrian dynamics. PhD thesis. Forschungszentrum
Jülich, Jülich, Germany.
Floyd, R., 1962. Algorithm 97: Shortest Path.
Communications of the ACM 5.
Helbing, D., Molnar, P., 1995. Social force model for
pedestrian dynamics. Physical review E.
Hoogendorn, S. P., Bovy, P. and Daamen, W., 2002.
Microscopic pedestrian wayfinding and dynamics
modelling. Pedestrian and Evacuation Dynamics.
Kemloh, U., 2013. Route choice modeling and runtime
optimization for simulation of building evacuation.
PhD thesis. Forschungszentrum Jülich, Jülich,
Germany.
Kemloh Wagoum, A.U., Chraibi, M. & Zhang, J. 2015
JuPedSim: An open framework for simulating and
analyzing the dynamics of pedestrians. In 3rd
ICEIS 2016 - 18th International Conference on Enterprise Information Systems
68

Conference of Transportation Research Group of
India.
Kobes, M., Helsloot, I., et al., 2010. Building safety and
human behavior in fire: A literature review. Fire
Safety Journal.
Meunders, A., 2011. Kalibrierung eines Mikroskopischen
Models für Personenströme zur Anwendung im
Project Hermes. Masterthesis. Bergische Universität
Wuppertal, Wuppertal, Germany.
Molnar, P., 1995. Modellierung und silmulation der
dynamik von Flussgagerstromen. Dissertation.
Universität Stuttgart, Stuttgart, Germany.
Samochine D.A., 2004. Towards an understanding of the
concept of occupancy in relation to staff behaviour in
fire emergency evacuation of retail store. PhD thesis.
University of Ulster, Belfast, UK.
Sandberg, А., 1997. Unannounced evacuation of large
retail-stores. An evaluation of human behavior and the
computer model Simulex.
Shikhalev, D., Khabibulin, R., 2013. Escape route systems
at shopping malls. Fire and explosion safety journal.
Shikhalev, D., Khabibulin R., 2013. Patent (in Russia) on
December 27, 2013 №136212 «Dynamic indicator».
Shikhalev, D., Khabibulin, R., Kemloh U., 2014.
Proceedings of conferences. Development of a Safest
Path Algorithm for Evacuation Simulation in Case of
fire. Proceedings of IV international conferences on
agents and artificial intelligence – ICAART 2014.
Evacuation Simulation under Different Conditions using a Safest Path Routing Algorithm
69
