
Analyzing the Acoustic Urban Environment
A Geofencing-centered Approach in the Curitiba Metropolitan Region, Brazil
N
´
adia P. Kozievitch
1
, Luiz C. Gomes-Jr
1
, Tatiana M. C. Gadda
1
, Keiko V. O. Fonseca
1
and Monika Akbar
2
1
Federal University of Technology, Curitiba, PR, Brazil
2
University of Texas at El Paso, El Paso, Texas, U.S.A.
Keywords:
Noise, Geofencing, GIS.
Abstract:
The industrial development and Brazilian economic context led to important structural changes, among others,
the increase of population migration (rural to urban spaces), number of private vehicles (due to tax reduction
and state subsidies for new cars and fuel), among others. Such changes impact not only the urban mobility at
big cities but also the urban life quality, which is directly affected by pollutant emissions and noise. In order
to limit emission impacts on sensitive population (children, elderly people, for example), city managers can
enforce bounds on emissions and noise pollution generated by the city traffic in specific regions defined by
geographical boundaries. This paper aims to contribute to the challenge of managing urban noise by exploring
and analyzing the data with a geofencing approach. In particular, we present a exploratory data analysis
toward a case study in Curitiba (1,800,000 inhabitants, a southern Brazilian city) aiming at analyzing possible
sources of noise based on a particular data set of noise measurements, geographical information data, traffic,
transportation and city licensing data.
1 INTRODUCTION
Since the late nineteenth century, noise has been the
subject of complaints, regulation, and legislation. By
the early 1900s, till today, cities have fought noise
from factories, steam trains, automobiles, loud neigh-
borhood, among others (Bijsterveld, 2008). Noise
pollution in large urban areas can be directly linked to
the traffic flow on roads and the types of vehicles, as
well as several other sources (Rodrigues, 2010). The
data analysis related to traffic flow as well as inde-
pendent variables might impact urban management,
the adoption of modals based on electric vehicles, the
location of schools and hospitals, among others.
Controlling noise pollution can be achieved by
two strategies: (i) coercion: to enforce the installation
of noise control devices, in situations where compli-
ance with the law is not observed; and (ii) prevention:
to establish policies that disallow the concentration of
activities in already polluted areas.
Through the concept of exploratory data analysis
and geofencing, we can (i) explore patterns or clues
from the available data (without any pre-conceived
ideas), and (ii) restrict the analysis from a geograph-
ical perspective (such as the metropolitan region of
a city). The objective is to restrict location-relevant
information to a geographic “fence” or boundary
around the information’s demarcation area (Green-
wald et al., 2011). The understanding of the related
topics, however, is a non trivial task since it requires
skills and knowledge of various domains (computa-
tional, urban planning, architecture, networks, cities
domain, engineering, etc.), along with technologies
to support the analysis process.
In particular, a group of cities, the C40 cities
1
,
had set ambitious targets to improve urban life quality
and protect their environment. Curitiba has developed
and implemented mass transport corridors, densifi-
cation of land-use along these corridors, and mobil-
ity solutions using Bus Rapid Transit (BRT) systems,
and became a model of sustainable city based on ur-
ban concepts that have shaped the city landscape. In
spite of its urban planning model, in Curitiba, the ge-
ofencing concept has not been explored to minimize
noise and particulate emissions coming from its Pub-
lic Transportation System (buses). The impacts of a
virtual perimeter is not fully understood, in particular,
due the complexity of noise measurements and anal-
1
http://www.c40.org Last visited on 30/05/2015.
78
Kozievitch, N., Gomes-Jr, L., Gadda, T., Fonseca, K. and Akbar, M.
Analyzing the Acoustic Urban Environment - A Geofencing-centered Approach in the Curitiba Metropolitan Region, Brazil.
In Proceedings of the 5th International Conference on Smart Cities and Green ICT Systems (SMARTGREENS 2016), pages 78-85
ISBN: 978-989-758-184-7
Copyright
c
2016 by SCITEPRESS – Science and Technology Publications, Lda. All rights reserved

ysis (Zannin et al., 2003). A variety of factors, such
as emission sources, available data, architecture char-
acteristics,and climate conditions could directly affect
the analysis and possible simulation of noise impact.
This paper presents the concepts, applications,
and challenges towards a exploratory data analysis of
noise through the concept of geofencing. The objec-
tive here is not to understand specific details (such
as mathematical models), or integrate environment-
related parameters (such as temperature or wind), but
to understand sources and obstacles which create im-
pact from a general overview. The main goal is
to discover what the data can tell us about the ob-
served noise with the help of visualization and dis-
play techniques of GIS perspective. The rest of this
document is organized as follows: Section 2 con-
tains an overview of a motivating example, Section
3 presents the related work. The methodology is pre-
sented within Section 4. Conclusions and future work
are presented in Section 5.
2 A MOTIVATING EXAMPLE
Noise pollution is a serious environmental problem
faced by several cities in Brazil (Zannin et al., 2003;
Oliveira et al., 1999; Arndt et al., 2010; Rodrigues,
2010).
Curitiba has 1.8 million people inside a total area
of 430,9 km
2
, according to the Brazilian Institute of
Geography and Statistics (IBGE)
2
. This area encom-
passes 75 neighborhood districts. Although noise in
Curitiba has been studied under distinct perspectives
(Zannin et al., 2002; Calixto et al., 2003; Zannin et al.,
2003), we believe that new clues about possible noise
sources can be derived from the analysis of new do-
mains.
A formerly traditional residential area of Curitiba,
with about 12,000 inhabitants, the Batel district is cur-
rently full of restaurants and options for nightlife. In
the 18th century, the current Batel Avenue was one
of the ways used by drivers. In the early 20th cen-
tury, the region already had two breweries, two yerba
mate processing plants, soap factories, and a small
trade. One of the main mass transportation axis (ex-
press bus lanes) crosses the region, establishing an ur-
ban canyon of skyscrapers with the express bus lanes
inside the deep valley. Curitiba was already stated as
a city which has problem with noise pollution (Arndt
et al., 2010), and according to (LNZ Soluc¸
˜
oes em
Vibrac¸
˜
oes e Ac
´
ustica, 2011), Batel is one of the most
noisy region compared to all other regions in Curitiba.
2
http://www.ibge.gov.br Last visited on 14/05/2015.
In order to investigate the reason for this, sev-
eral data sources (e.g., health facilities, education fa-
cilities, streets, city hall noise measures, particular
noise measures, bus lines), within different time range
(from 1890 till 2014), were integrated and analyzed.
The noise measure report compared the data
against the Municipal Law Number 10.625, published
in 19/12/2002, which establishes noise limits
3
. The
limits are fixed as follows: (i) daytime: from 07h:01
to 19h; (ii) evening: from 19h01 to 22h; (iii) noctur-
nal: from 22h01 to 07h.
Considering the information listed above, sev-
eral questions might arise, such as why some loca-
tions produce more noise during the day compared
to night and vice versa, or why specific locations
produce more noise compared to others. The ques-
tions can be explored under different domains, such as
GIS (through spatial locations), architecture (impact
of noise on different building types) and mathmat-
ics (through statistical models (Calixto et al., 2003)).
Different domains might present different background
concepts (theory, software, practice), along with do-
main limitations, which, if integrated, might provide
better answers.
Briefly, the efforts of integrating different domains
may vary in several directions: (i) from the GIS per-
spective, the challenge is how to explore data with
efficiency (and to enable any future integration with
other systems); (ii) from the integration perspective,
the challenge is not to have a bottleneck; (iii) from
the hardware perspective (for receiving noise data,
for example), the challenge is how to detect limita-
tions and standardize calibrations; (v) from the ped-
agogical perspective, the challenge is how to explore
all this structure and have a interdisciplinary learning
environment; (vi) from the software perspective, the
challenge is how to adapt an interface which explores
different points of view of analyzing the information.
3 RELATED WORK
3.1 Exploratory Data Analysis
Exploratory Data Analysis (EDA) is a philosophi-
cal approach to data analysis (NIST/SEMATECH,
2012). The posed question is: what data can tell us
about certain relationships, properties or structures.
There are no imposed techniques to apply to the data
set but graphical visualization plays an important role
in this approach (Hartwig and Dearing, 1979). The
3
http://multimidia.curitiba.pr.gov.br/2010/00086318.pdf
Last visited on 11/25/2015.
Analyzing the Acoustic Urban Environment - A Geofencing-centered Approach in the Curitiba Metropolitan Region, Brazil
79

non-inferential approach in data analysis encourages
the openness perspective required to integrate new
domains. The availability of processing power and
data storage provide new tools for handling massive
amout of data processing allowing flexible search of
evidences in the available data through designed ex-
periments (Martinez et al., 2010).
3.2 Geofencing
Geofencing is a virtual perimeter for a real-world ge-
ographic area (Ravada et al., 2013). A geofence could
be a radius around a store or point location, or a pre-
defined set of boundaries, like zip code boundaries.
Geofencing is still on-going research (Ryoo et al.,
2012; Sheth et al., 2009), but basically it explores the
containment of data “within” or “inside” an area. A
lot of relevant techniques in GIS (such as geometry
location, spatial indexing, and spatial query process-
ing) can be explored from a database perspective.
From the GIS perspective, geofencing is explored
through the definition of points (latitude/longitude),
along with lines, polygons, and geometries defined
across the data. But indeed, the same information
can be visualized within different categories (Ro-
driguez Garzon and Deva, 2014) (as shown in Ta-
ble 1).
Table 1: The different geofencing categories (Ro-
driguez Garzon and Deva, 2014).
Category Adressing Instances Example
Scheme
Spatial Geometric Circles, Polygons, ”Region of Berlin”
Geofence Polylines
Hierarchy- Symbolic Country, City, ”Germany/Berlin/
based Street, Ernst-Reuter-Platz”
Geofences Building...
Network- Symbolic Cell-Ids, ”BSSID of WLAN ”
based WLAN-(B) in a McDonalds
Geofences SSID,... restaurant”
Semantic Geometric Combination of ”Close to a
Geofences and Symbolic the above McDonalds
restaurant”
Theoretically, geofencing can be formalized as a
combination of states and transition-based geofence
models, created by system notifications (such as in-
coming calls, emails, breaking news or software
update notifications) (Rodriguez Garzon and Deva,
2014). In particular, we adopted the geofencing ap-
proach in order to take advantage of physical limits
within districts and cities.
3.3 The Acoustic Model
Sound is produced by sources (the noise emitting el-
ements, having a geometry and properties which vary
for each case), modified by obstacles (barriers to the
propagation of sound, absorbing it or reflecting it in
varying percentages, depending on their nature and
their position in the vicinity of sources), and per-
ceived by receivers (the elements which are disturbed
by the noise, that is, buildings, installations, and peo-
ple, or a combination of them). Sound (along with
other parameters such as weather condition, level of
air pollution, noise pollution, traffic condition) are
widely monitored by sensors. One of the caveat of
sensor data is that the data captured by sensors do
not include information on the cause of the data.
Thus, sensor data alone is not sufficient for draw-
ing meaningful conclusion. In recent years, the idea
of using citizens as sensors are gaining momentum
(Mostashari et al., 2011). From the academic per-
spective, researchers are also proposing frameworks
to effectively combine geofencing with mobile tech-
nologies to infer state of the user (Chen et al., 2014).
From the urban noise modeler’s point of view, the
mentioned parameters are impacted by the following
acoustic modeling aspects: (i) the propagation and
(ii) the combination of effects from sources. These
two aspects are useful to other environmental prob-
lems (Oliveira et al., 1999). Further details about
mathematical formulations to understand the impact
of noise decay can be checked at (Oliveira et al.,
1999; Rodrigues, 2010; Arndt et al., 2010) (Calixto
et al., 2003). But indeed, the analysis is performed
on a delimited area, combining the propagation and
combination to a buffer polygon (through GIS), traced
around the original interest area at a defined distance.
The noise impact inside a region under consider-
ation can be estimated according to (Oliveira et al.,
1999): (i) the noise considered by each economic ac-
tivity; (ii) the traffic noise; (iii) the sound attenuation;
(iv) the combination of the previous steps in order to
obtain the noise generated by all sources.
Traffic noise poses also as one of the main prob-
lems for city managers to solve. Suitable measures
for noise reduction includes asphalt type, grass cov-
ered tramways, noise barriers, soundproof windows,
night driving bans for trucks (Louen et al., 2014),
as well as, speed reduction zones (Madireddy et al.,
2011) and electro-mobility solutions (Verheijen and
Jabben, 2010).
Road traffic-induced air pollution is also one of
the main sources of air pollution affecting environ-
mental living quality in urban areas (Duclaux et al.,
2002). However, the phenomenon of road traffic air
pollution shows considerable variation within a street
canyon, or horizontal and vertical obstacles.
Linking up dispersion models with a GIS environ-
ment is a mean to resolve this shortcoming. Providing
information about traffic pollution or noise, and find-
ing out its distribution is therefore a crucial starting
SMARTGREENS 2016 - 5th International Conference on Smart Cities and Green ICT Systems
80
point for planning effective measures to improve air
quality or traffic noise.
4 OVERVIEW OF THE
METHODOLOGY
The methodology used for the exploratory data anal-
ysis comprised the following steps: (i) the acqui-
sition/characterization of the data sources; (ii) the
data integration and processing; (iii) the data analy-
sis (along with hypothesis and limitations); and (iv)
the definition of parameters/challenges which impact
the proposed problem solution.
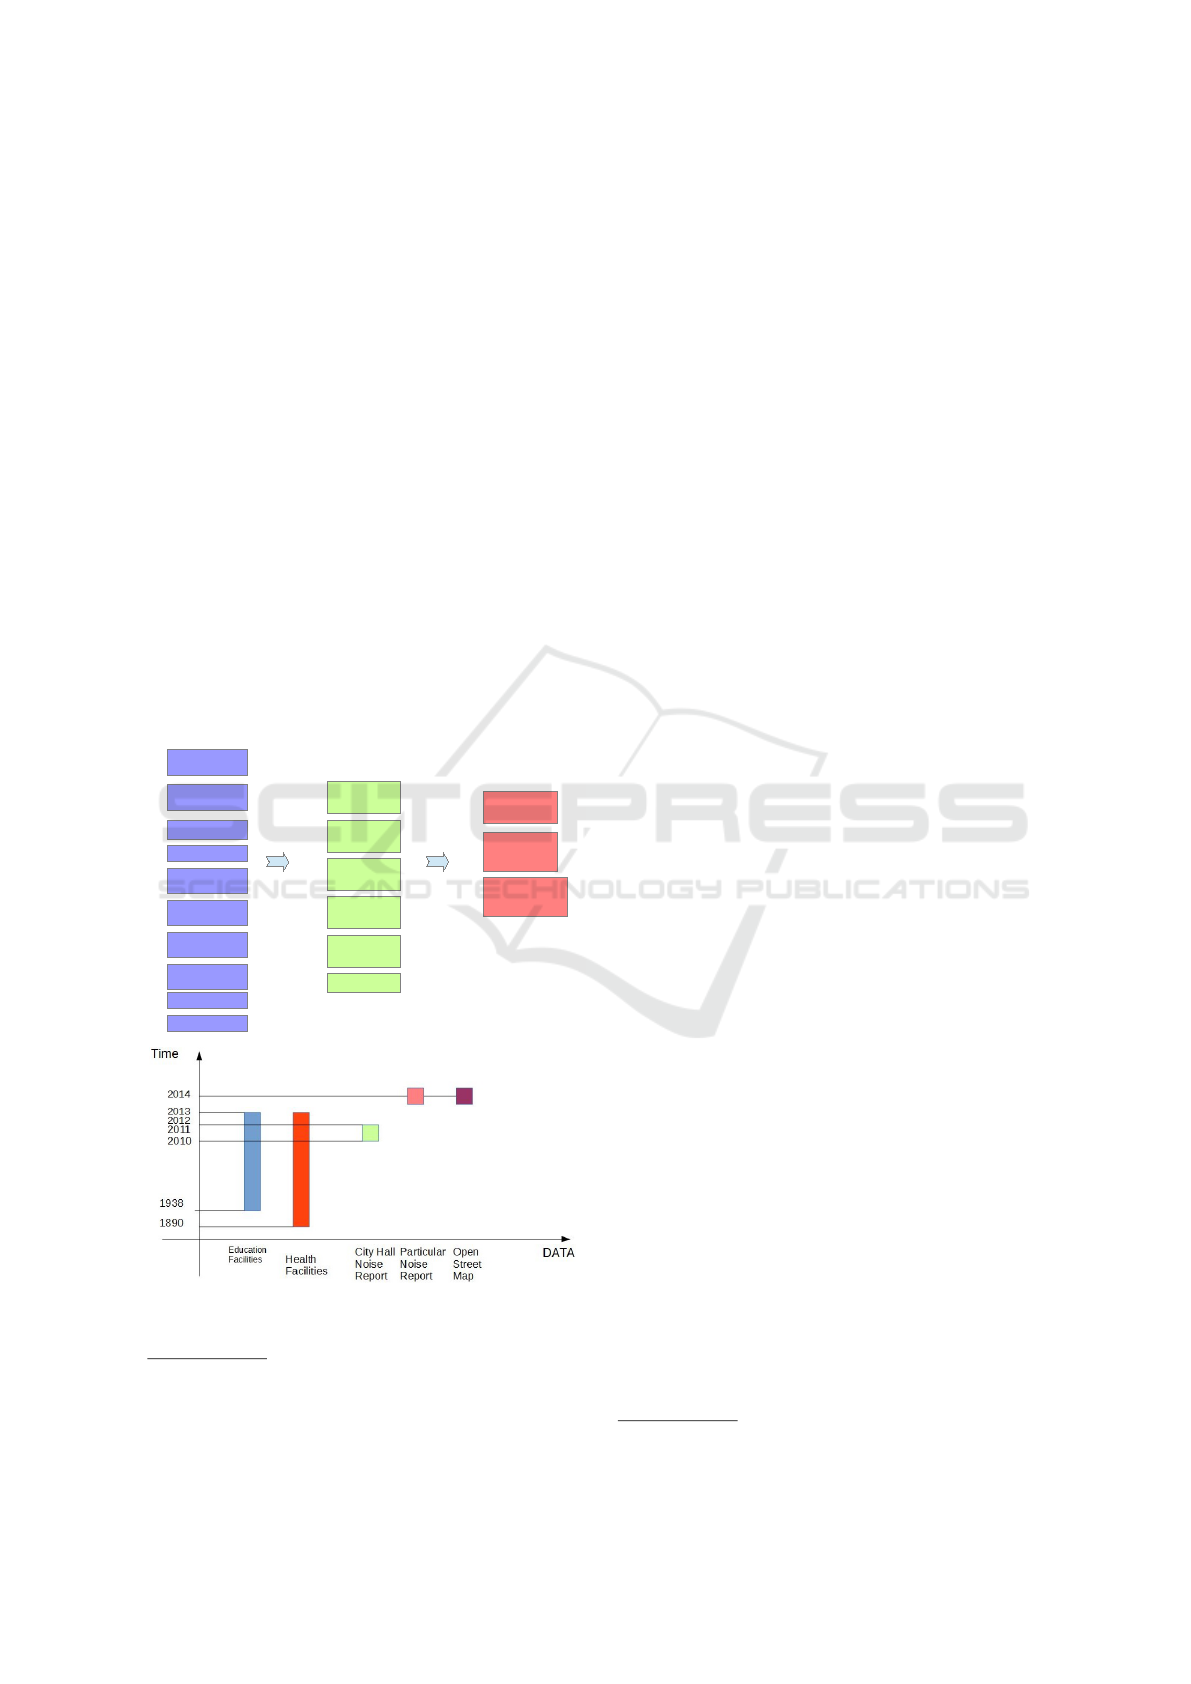
4.1 Data Sources
The dataset used is based on Instituto de Planeja-
mento de Curitiba (IPPUC), the city mall of Curitiba
4
,
along with data from Open Street Map
5
. Figure 1-top
shows the input sources, with data ranged from 1890
Inputs Intermediary Results Outputs
Education
Facilities
Health
Facilities
Bus Lines
Shoppings
Noise Measures
Exposure
Area
Bus Stops
Bus Lines /
Noise Measure
Locations
Schools /
Noise Measure
Locations
Open Street
Maps
Google
Maps
Shoppings /
Noise Measure
Locations
Bus Lines /
Noise Measure
Locations
Complete List
Of Impacted
Facilities
Hospitals /
Noise Measure
Locations
Noise Measure
Locations/
Time Impact
Complete List
Of Impacted
Facilities
Challenges
To be Addressed
Streets
Churches
...
Figure 1: Schematic of the data model (top); and (B) Time
Range of the input data (bottom).
4
http://www.curitiba.pr.gov.br/DADOSABERTOS/ Vis-
itado em 15/05/2015.
5
http://www.openstreetmap.org Last visited on
14/05/2015.
till 2014 (as shown in Figure 1-bottom). Details are
listed below.
Education Facilities - The region has 15 education
facilities (such as Col
´
egio Nossa Senhora de Sion -
Sede, Col
´
egio Estadual J
´
ulia Wanderley, Escola Osny
Macedo Saldanha, Campus de Artes e M
´
usica da
UFPR, Faculdade Fapar, Centro de Educac¸
˜
ao Infan-
til Engenheiros do Saber, among others). The data
creation ranges from 1938 (Col
´
egio Nossa Senhora
de Sion - Sede) till the last update in 2013, having as
source the IPPUC
6
. Education facilities present some
categories, such as CEI (portuguese acronym for Mu-
nicipal center of Early Childhood Education, divided
between private and the ones who has a contract
with the state government), UEI (portuguese acronym
for Integrated Education Unit), State Schools, Private
Schools, and Higher Education Institutions.
Health Facilities - The region has exactly eight
health facilities (namely Hospital da Cruz Vermelha
Brasileira, Hospital Geral de Curitiba, Clinica Cen-
tral de Oftalmologia, Hospital de Olhos do Paran
´
a,
Hospital Santa Cruz and Hospital Vita Batel). The
data creation ranges from 1890 till the last update in
2013, having as source the Instituto de Planejamento
de Curitiba (IPPUC). Note that the older health facil-
ity - Hospital Geral de Curitiba, was initially created
at 1890, and moved to the actual location in 1920.
Bus Lines - The region has 21 bus lines (such
as InterHospitais, Circular Centro (Anti-Hor
´
ario),
Port
˜
ao-Cabral, Interbairros I (hor
´
ario), Interbairros I
(anti-hor
´
ario), Cic-Tiradentes (Manh
˜
a), Ctba-Campo
Largo, among others). The 21 lines are divided within
8 bus categories (“Circular Centro” (1 type), “Con-
vencional” (8 types), “Expresso” (1 type), “Interbair-
ros” (2 types), “Interhospitais” (1 type), “Linha Di-
reta” (2 types), “Metropolitano” (5 types) and “Tron-
cal” with one type).
Street Data - The street data was explored both with
the data obtain from IPPUC and Open Street Map.
Noise Measures - The first noise source explored data
between 2010 and 2011 (LNZ Soluc¸
˜
oes em Vibrac¸
˜
oes
e Ac
´
ustica, 2011), having Batel as the district with
higher noise measures within the city. Eight locations
are explored for measuring noise: Sensor 10 (Rua
Gonc¸alves Dias, 406), Sensor 11 (Rua Bispo Dom
Jose, 2365), Sensor 12 (Rua Hermes Fontes, 506),
Sensor 13 (Av. do Batel, 1750), Sensor 14 (Rua Fran-
cisco Rocha, 510), Sensor 15 (Av. do Batel, 1230),
Sensor 16 (Rua Benjamin Lins, 555), and Sensor 17
(Rua Pasteur, 260).
The eight locations produced the noise measures
listed in Table 2. The last two columns from the ta-
ble list the noise law limit for that region, and how
6
http://www.ippuc.org.br/ Last visited on 14/05/2015.
Analyzing the Acoustic Urban Environment - A Geofencing-centered Approach in the Curitiba Metropolitan Region, Brazil
81
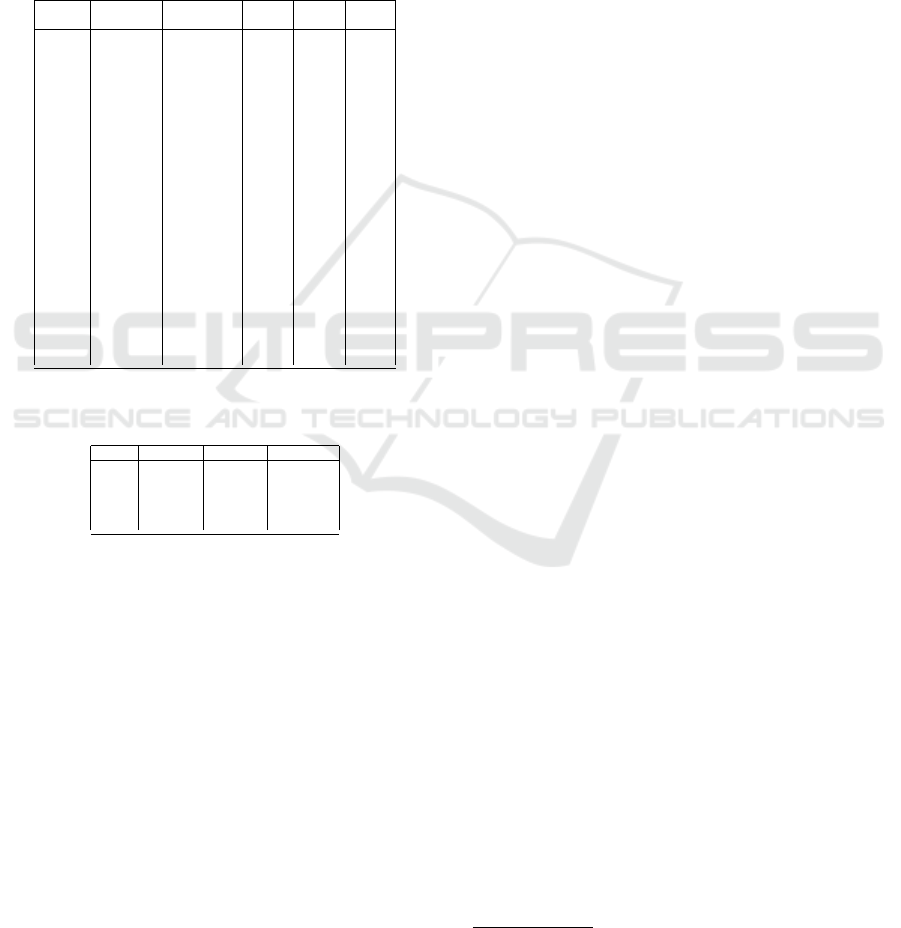
the noise measure percentage is above law. Note that
(i) locations 13 and 14 produce more noise during the
day and night and (ii) locations 11,13, and 14 pro-
duce more noise compared to the others. For the
comparison, only the Equivalent Continuous Sound
Level (Leq) was considered, under SAD69 database
and UTM coordinates. The equipment used was Icel
DL4200 type 2 and 01 dB Solo type 1. The report al-
ready stated that the majority of noise is related to the
traffic within the region.
Table 2: Noise Measures within the Batel neighborhood.
Sensor Period of Date Hour Noise Law
the day Limit
13 Daytime 2010-12-22 09:27 76.7 55
14 Daytime 2010-12-22 09:00 74.4 55
11 Daytime 2010-12-21 09:20 74.3 55
12 Daytime 2010-12-21 09:00 63.2 55
16 Daytime 2010-12-22 10:51 70.8 65
15 Daytime 2010-12-21 09:43 67.3 65
10 Daytime 2010-12-21 09:43 67.3 65
17 Daytime 2010-12-22 10:35 62.8 65
13 Evening 2011-04-14 17:34 73.2 55
14 Evening 2011-04-14 17:05 70.2 55
11 Evening 2011-04-14 18:21 67.8 55
12 Evening 2011-04-14 17:26 62.5 55
10 Evening 2011-04-14 18:41 69.3 65
15 Evening 2011-04-14 18:41 69.3 65
16 Evening 2011-04-11 18:31 68.2 65
17 Evening 2011-04-11 18:51 65.5 65
11 Nocturnal 2010-12-20 23:25 74 45
14 Nocturnal 2010-12-21 23:39 71.4 45
13 Nocturnal 2010-12-21 23:20 70.9 45
12 Nocturnal 2010-12-20 23:00 57.2 45
16 Nocturnal 2010-12-22 23:05 68.9 55
10 Nocturnal 2010-12-20 23:47 67.6 55
15 Nocturnal 2010-12-20 23:47 67.6 55
17 Nocturnal 2010-12-22 23:02 59.1 55
Table 3: Number of noise complaints within the Batel
neighborhood, within years 2010 and 2014.
Year Daytime Evening Nocturnal
2010 69 24 50
2011 84 18 59
2012 78 29 42
2013 58 28 31
2014 48 15 64
The drawback of having just one sample over time
divided between two years sent us to the second noise
dataset. The second source registers citizen com-
plaints against noise within years 2010 till 2014 (ob-
tained from the city hall of curitiba - Table 3). The
average is 58 complaints by month, having February
as the worst month (average of 75 complaints, gen-
erally the month of the Brazilian Carnival). In Cu-
ritiba, 50% of the citizen complaints are related to
noise. The majority are related to bars and cars with
high volume music. Within this source, Batel is the
5th district with more noise complaints (with 58% of
complaints during the day) and is located next to the
most noisy district (Downtown).
4.2 Data Integration and Processing
The complete IPPUC dataset along with the noise
source 1 (extracted from (LNZ Soluc¸
˜
oes em
Vibrac¸
˜
oes e Ac
´
ustica, 2011)) and noise source 2
(within data from the city mall) were inserted in a
PostGIS
7
database. Different sources were created
as different tables in the database. Later, specific ta-
blespaces and indexes were created in order to opti-
mize the access. Since semantic errors were present
(different sources presented different street names for
the same location, for example (Barczyszyn, 2015)),
geolocation and specified time range were used to cor-
relate the data.
4.3 Data Analysis
The objective was apply a geofencing around the dis-
trict of Batel, and using the available datasets, locate
the less impacted area and the most impacted area
within the district. The data analysis process used
the QGIS visualization tool
8
. The integration of the
8 intermediary input GIS layers (illustrated in Fig-
ure 1-A) produced intermediary results, such as the
relation of bus lines × noise measure locations, the
impacted schools and hospitals in the region, the im-
pact of shopping centers within the region, along with
the how the time distribution of each facility impacted
the final analysis. Note that we decided to combine
different source of data, in order to explore different
domains of information.
As final outputs, the exploratory analysis identi-
fied the exposure area and the complete list of im-
pacted facilities. Figure 2 lists the main schools,
health facilities, bus stations and the main streets.
The exposure area was limited to Batel neighborhood
(centralized in the figure). The complete list of im-
pacted facilities can be visualized at the same figure.
If we consider a 300 meters radius from the point
of measurements of noise, for example, four colleges,
three private CEIs, three state schools, five hospitals,
and two churches are impacted, as shown in Figure 2
(right). Within this approach, note that the upper part
of the district (next to sensor 12) is still the less noisy
region, comprised within a residential area.
If we increase the radius to 600 meters, all
schools, hospitals and churches are impacted within
the district, through the day, afternoon, and night.
This approach suggests that all the district is affected
by the noise.
The integration of the second noise source (Fig-
ure 3, left) stresses that complaint regions remain the
same along the years, with an average of 121 registers
per year. This source reinforces that the region around
sensor 12 is less noisy, and the top right region is the
region with the majority of citizen complaints (even
7
http://www.postgis.net Last visited on 15/05/2014.
8
http://www.qgis.org Last visited on 15/05/2015.
SMARTGREENS 2016 - 5th International Conference on Smart Cities and Green ICT Systems
82
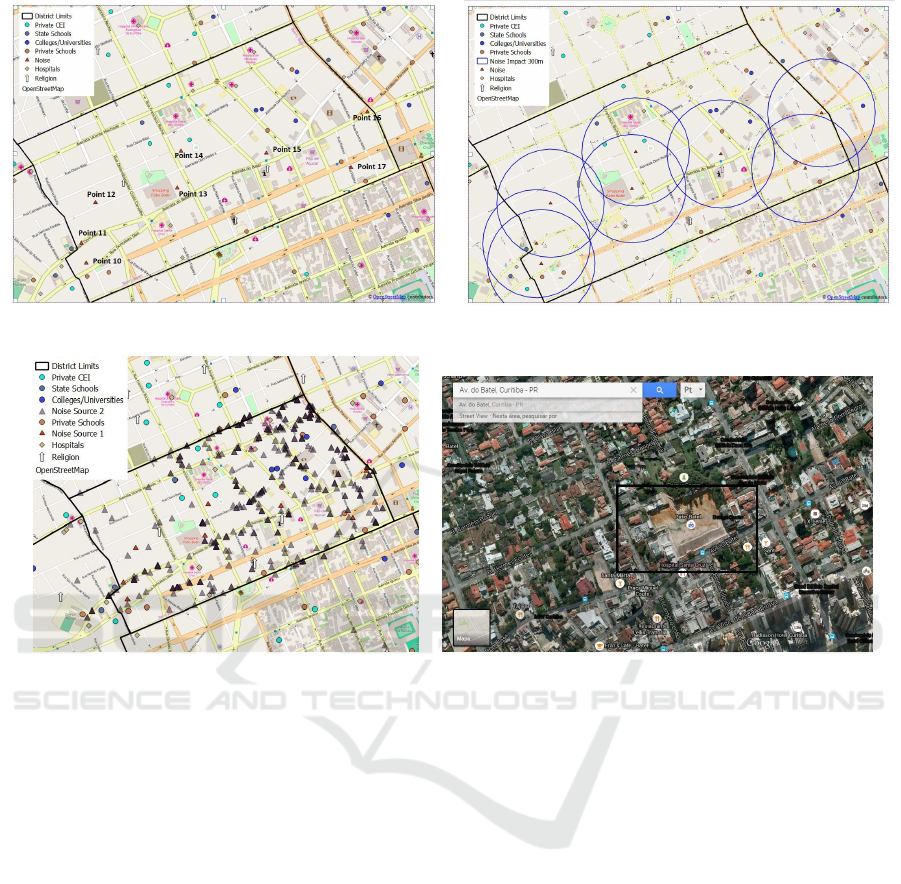
Figure 2: The eight noise measure locations (left) and the impacted schools in 300 meters radius (right).
Figure 3: Additional noise source data from all years (left) and the same neighborhood location provided by Google Earth
(right).
the concentration of black triangles are superimposed
within the Figures). Note that this is a residential area
with a lot of bars, and has a physical perimeter with
the downtown district, which is the top one on the list
of the noise complaints. In summary, Batel geofence
from is impacted by a “noisy” district, the downtown
district.
Along with the impacted region, authors also
wanted to explore other factors, such as bus lines. The
initial hypothesis considered was that the region was
noisy due to a high number of bus lines. Nevertheless,
the data indicates toward other direction: the locations
with higher noise measures did not present an expres-
sive number of line buses within their range. Mea-
sure point 10, for example, has 5 lines within the same
area (V.Sandra, Tramontina, Jd.Social-Batel, R. XV-
Barigui, Camp. Siqueira-Batel); measure point 11 has
exactly the 5 lines as measure point 10, but some have
duplication (due to the two-way street); measure point
13 has the same 5 lines of point 10; measure point 14
is impacted by only one bus line (Interbairros I anti-
hor
´
ario); measure point 15 is impacted by the union
of bus lines from point 10 and 14; and point measure
16 is impacted also by the same bus lines presented
in point 10. Briefly, if we remove the point measure
14, all the locations are impacted by almost the same
bus lines. Note that the bus categories already listed
in phase one stated that this region is not impacted by
the biggest type of bus available in curitiba (the “ex-
presso”, a biarticulated bus with 28 meters).
Figure 3 (right) explores the same region under
Google Satellite. Note that Figure 3 provides a new
visual information: when the region was analyzed
by Google, the new shopping P
´
atio Batel (within the
black square) was still under construction. The build-
ing construction started back in 2008 and opened only
in 09/09/2013 - exactly at the same time range in
which the the noise data samples were collected. If
Google had already updated the satellite information
till the end of this paper publication, it would be rather
difficult to navigate historically through time to un-
derstand the same point of view.
In summary, the integration of several sources,
along with a summarized visual analysis stated that
district is impacted by noise, but there are less noisy
regions (around sensor 12) and worst noisy regions
Analyzing the Acoustic Urban Environment - A Geofencing-centered Approach in the Curitiba Metropolitan Region, Brazil
83

(top right area). Note that all surrounded facilities
(hospital, schools, among others) are impacted day
and night by noise created by constructions, traffic,
and bars. Once the impacted areas were identified,
and the period of the day which they are impacted,
short term solutions could include measures toward
citizen life quality, such as noise barriers and sound-
proof windows. In particular, from the computer sci-
ence perspective, remains some challenges of inte-
grating sources (such as Google Earth), applications
and methodologies which contribute to the analysis.
4.4 Important Parameters to Consider
for Solving the Geofencing Problem
The challenges and difficulties of exploring noise im-
pacts through a GIS perspective are as follows:
• Integration with Different Sources: (i) within
the noise measures data sample, several chal-
lenges arise, such as the non-correlation of ad-
dresses and coordinates, the use of different
equipments for the samples and a non-regular
data sampling over time; (ii) the complete data
characterization itself is a challenge, due to is-
sues such as the non matching of locations and
the comparison of latitude/longitude, UTM co-
ordinates and addresses; (iii) the standardization
of the data and schemes; (iv) and the integra-
tion with different data sources, such as Google
Satellite, and images might help to understand the
historical spatio-temporal gaps which alphanu-
meric data sources might not answer (such as the
construction of a shopping that was accidentally
captured by Figure 3), among others. Solutions
might include manual intervention, frameworks,
linked data (Moura and Davis Jr., 2013), and
data sources quality ranking (with metrics such as
PageRank (Brin and Page, 1998)).
• Updated Data: Different data sources might have
different time ranges for updating the data. Their
maintenance over time might be costly, and even-
tually manual intervention is necessary. Some so-
lutions include the use of linked data (Moura and
Davis Jr., 2013) and Volunteered Geographic In-
formation (VGI) (Mcdougall, 2011).
• Methodology Issues: evaluate noise measure
values with a consistent period of time (consid-
ering different periods of day, but maintaining the
pattern of noise/period samples and equipments);
specify a criteria for choosing the noise mea-
sure locations; find a standard schema to integrate
the data; consider different strategies for evalu-
ating the environmental noise in a city (Brown
and Lam, 1987) including those based on crowd-
sourcing (Schweizer et al., 2011);
• Hardware Issues: different hardware calibra-
tions, along with the information that hard-
ware without maintenance might impact final re-
sults (Schweizer et al., 2011);
• Spatio-temporal Data Issues: data might not
comprise the complete spatio-temporal windows
(as shown in Figure 1), and the relationship se-
mantics and spatial location might be an issue
over time (such as perimeters which impact other
regions). Solutions include the adoption of mov-
ing objects databases (Erwig et al., 1999), and
RDF triples as implementation technique (Moura
and Davis Jr., 2013).
• Domain Knowledge: depending on the analyzed
problem (along with the data limitations), the ex-
ploratory data analysis is not enough to solve a
question: additional domain knowledge is neces-
sary (such as the construction year of the biggest
buildings in the area).
5 CONCLUSION
Research in urban noise pollution is not recent, but
the exploration through different domains is still an
ongoing effort. The possibility of implementing mod-
els within GIS and integrating them with different
sources provides planners with a powerful and flex-
ible tool for analyzing the land use, and deciding on
new business permits and living quality. This paper
presents the concepts, applications, and challenges of
exploring noise through the concept of geofencing.
Later these definitions are explored in a practical case
study, within the Curitiba metropolitan region, Brazil,
with data analysis aimed at supporting noise and pol-
lution control. Future work includes the study of the
noise impact decay, the integration of additional data,
and the use of personalization and recommendation
techniques in order to explore the data.
ACKNOWLEDGEMENTS
We would like to thank the Curitiba City Municipal-
ity, IPPUC, and RNP.
REFERENCES
Arndt, L. T., Philips, J. W., and Barbosa, W. A. (2010). Sis-
tema de informac¸
˜
oes geogr
´
aficas para mapeamento do
SMARTGREENS 2016 - 5th International Conference on Smart Cities and Green ICT Systems
84

ru
´
ıdo urbano. In SIMGEO ’10, pages 001–0010.
Barczyszyn, G. L. (2015). Integrac¸
˜
ao de dados geogr
´
aficos
para planejamento urbano da cidade de Curitiba (In-
tegration of geographic data for the urban planning of
the city of Curitiba). Universidade Tecnol
´
ogica Fed-
eral do Paran
´
a.
Bijsterveld, K. (2008). Mechanical Sound: Technology,
Culture, and Public Problems of Noise in the Twen-
tieth Century. The MIT Press.
Brin, S. and Page, L. (1998). The anatomy of a large-scale
hypertextual web search engine. In Proceedings of the
Seventh International Conference on World Wide Web
7, WWW7, pages 107–117, Amsterdam, The Nether-
lands. Elsevier Science Publishers B. V.
Brown, A. and Lam, K. (1987). Urban noise surveys. Ap-
plied Acoustics, 20(1):23–39.
Calixto, A., Diniz, F. B., and Zannin, P. (2003). The statis-
tical modeling of road traffic noise in an urban setting.
Cities, 20:1–74.
Chen, R., Chu, T., Liu, J., Chen, Y., Chen, L., Xu, W., Li,
X., Hyyppa, J., and Tang, J. (2014). Development
of a contextual thinking engine in mobile devices. In
UPINLBS ’14, pages 90–96.
Duclaux, O., Frejafon, E., Schmidt, H., Thomasson, A.,
Mondelain, D., Yu, J., Guillaumond, C., Puel, C.,
Savoie, F., Ritter, P., Boch, J., and Wolf, J. (2002). 3d-
air quality model evaluation using the lidar technique.
Atmospheric Environment, 36(32):5081 – 5095.
Erwig, M., Guting, R., Schneider, M., and Vazirgiannis, M.
(1999). Spatio-temporal data types: An approach to
modeling and querying moving objects in databases.
GeoInformatica, 3(3):269–296.
Greenwald, A., Hampel, G., Phadke, C., and Poosala, V.
(2011). An economically viable solution to geofenc-
ing for mass-market applications. Bell Lab. Tech. J.,
16(2):21–38.
Hartwig, F. and Dearing, B. (1979). Exploratory Data Anal-
ysis. 07. SAGE Publications.
LNZ Soluc¸
˜
oes em Vibrac¸
˜
oes e Ac
´
ustica (2011). Di-
agn
´
ostico de Ru
´
ıdos Urbanos - Relat
´
orio Final. Tech-
nical report, Prefeitura Municipal de Curitiba - Sec-
retaria Municipal do Meio Ambiente .
Louen, C., Wehrens, A., and Vall
´
ee, D. (2014). Analysis of
the effectiveness of different noise reducing measures
based on individual perception in germany. Trans-
portation Research Procedia, 4:472–481.
Madireddy, M., De Coensel, B., Can, A., Degraeuwe,
B., Beusen, B., De Vlieger, I., and Botteldooren, D.
(2011). Assessment of the impact of speed limit
reduction and traffic signal coordination on vehi-
cle emissions using an integrated approach. Trans-
portation research part D: transport and environment,
16(7):504–508.
Martinez, W., Martinez, A., and Solka, J. (2010). Ex-
ploratory Data Analysis with MATLAB, Second Edi-
tion. Chapman & Hall/CRC Computer Science &
Data Analysis. Taylor & Francis.
Mcdougall, K. (2011). The potential of citizen volunteered
spatial information for building sdi. In GSDI-11 Con-
ference.
Mostashari, A., Arnold, F., Maurer, M., and Wade, J.
(2011). Citizens as sensors: The cognitive city
paradigm. In CEWIT ’11, pages 1–5.
Moura, T. H. V. M. and Davis Jr., C. A. (2013). Linked
geospatial data: desafios e oportunidades de pesquisa.
In XIV Brazilian Symposium on GeoInformatics.,
pages 13–18. SBC.
NIST/SEMATECH (2012). E-Handbook of Statistical
Methods, available at http://www.itl.nist.gov/div898/
handbook/.
Oliveira, M. P. G., Medeiros, E. B., and Davis, Jr., C. A.
(1999). Planning the Acoustic Urban Environment: A
GIS-centered Approach. In GIS ’99, pages 128–133,
New York, NY, USA. ACM.
Ravada, S., Ali, M., Bao, J., and Sarwat, M. (2013). Acm
sigspatial gis cup 2013: Geo-fencing. In SIGSPA-
TIAL’13, pages 584–587, New York, NY, USA. ACM.
Rodrigues, F. (2010). Metodologia para investigac¸
˜
ao de
relac¸
˜
ao entre ru
´
ıdo de tr
´
afego e condic¸
˜
oes opera-
cionais do fluxo em centros . PhD thesis, Instituto
Alberto Luiz Coimbra de P
´
os-Graduac¸
˜
ao e Pesquisa
de Engenharia - UFRJ.
Rodriguez Garzon, S. and Deva, B. (2014). Geofencing
2.0: Taking location-based notifications to the next
level. In UbiComp ’14, pages 921–932, New York,
NY, USA. ACM.
Ryoo, J., Kim, H., and Das, S. (2012). Geo-fencing:
Geographical-fencing based energy-aware proactive
framework for mobile devices. In Quality of Service
(IWQoS), 2012 IEEE 20th International Workshop on,
pages 1–9.
Schweizer, I., Darmstadt, T., Probst, F., B
¨
artl, R., Darm-
stadt, T., M
¨
uhlh
¨
auser, M., Darmstadt, T., Schulz, A.,
and Darmstadt, T. (2011). Noisemap - real-time par-
ticipatory noise maps. In PhoneSense’2011.
Sheth, A., Seshan, S., and Wetherall, D. (2009). Geo-
fencing: Confining wi-fi coverage to physical bound-
aries. In Pervasive ’09, pages 274–290. Springer-
Verlag.
Verheijen, E. and Jabben, J. (2010). Effect of electric cars
on traffic noise and safety. Bilthoven: RIVM.
Zannin, P. H. T., Calixto, A., Diniz, F. B., and C., J. A.
(2003). A survey of urban noise annoyance in a large
brazilian city: the importance of a subjective analysis
in conjunction with an objective Environmental Im-
pact Assessment Review, 23:245–255.
Zannin, P. H. T., Diniz, F. B., and Barbosa, W. A. (2002).
Environmental noise pollution in the city of Curitiba,
Brazil . Applied Acoustics, 63(4):351 – 358.
Analyzing the Acoustic Urban Environment - A Geofencing-centered Approach in the Curitiba Metropolitan Region, Brazil
85
