
Long Path Industrial OCT
High-precision Measurement and Refractive Index Estimation
Tatsuo Shiina
Graduate School of Advanced Integration Science, Chiba University, 1-33 Yayoi-cho, Inage-ku, Chiba, Japan
Keywords: OCT (Optical Coherence Tomography), Industry, Long Path, High Accuracy, Refractive Index, Group
Index.
Abstract: Long-path optical coherence tomography was developed for industrial use. The system is compact and easy
variable to change the measurement speed and range. In this study, its precision and long-path were
designed as 1μm and 100mm, respectively. Refractive index of water was analysed by changing the
temperature. The results well coincided with the theoretical curve of group index of refraction.
1 INTRODUCTION
Recently, needs of high-precision optical
measurement devices are increased in the industrial
field due to the technology development of outer
shape measurement and in-vivo measurement of
materials. 3 dimensional outer shape measurement
based on optical measurement technology is
essential to the industrial field. Recently non-contact
optical probe takes the place of the contact type on
the 3 dimensional measurement. Many of principles
for it are proposed and commercialized.
The traditional high-precision measurement
technology is optical interference technology in
industrial field. These technology installs laser and
white-light source into it. Laser interferometer, laser
displacement meter, and white-light interferometer
are commercialized. In these high-precision optical
measurement devices, long path measurement is
included. Combinational lens such as telescopic lens
is essential to evaluate and analyse their lenses
matching to optimize their performance. In the case
of crystal growth and material compounding
operation, the feedbacks from the interior condition
sensing to the temperature and concentration
controls are important. On the other hand, the long
path measurement on the laser and white-light
interferometers utilizes linear stage, and they are
lack of repeatability. Furthermore, these apparatuses
are large and expensive. They have restriction to
use.
The optical coherence tomography : OCT ,
which is developed in medical field, is recently
adapted to the industrial use. The OCT technology is
the low coherent interferometer and obtains the
cross-sectional image by non-invasive and non-
destructive measurement, Mainly it is used in
ophthalmology.(Danielson 1991, Huang 1991,
Brezinski 1999) The combination of super
luminescent diode : SLD and optical fiber
interferometer adds the flexibility of measurement to
the device and also compactness. In this study, a
portable OCT scanner has been developed for
industrial use.(Shiina 2003, 2009, 2014) In this
report, to improve the repeatability on the long path
measurement, we state the development of long path
industrial OCT, which has the rotational optical path
change mechanism. It can repeat the measurement,
and also change the measurement range by adjusting
the rotational radius of mechanism. We evaluate the
accuracy and applied it to the refractive index
measurement. We aimed the concrete accuracy of
1μm within the measurement range of 100mm to
verify the measurement result with the five-figure
accuracy.
2 LONG PATH INDUSTRIAL OCT
The low coherence interferometer changes its
reference path length, and interferes it with the
sample path, where the same optical path length
inside the specimen. Due to the optical path change,
interior information of the specimen is visualized.
Shiina, T.
Long Path Industrial OCT - High-precision Measurement and Refractive Index Estimation.
DOI: 10.5220/0005842903430348
In Proceedings of the 4th International Conference on Photonics, Optics and Laser Technology (PHOTOPTICS 2016), pages 345-350
ISBN: 978-989-758-174-8
Copyright
c
2016 by SCITEPRESS – Science and Technology Publications, Lda. All rights reserved
345
Therefore, it is important to scan precisely the
optical path change. Our long path industrial OCT
utilizes the rotational optical path change
mechanism. The rotation radius and speed decides
the measurement range and scan rate, respectively.
This scanning mechanism consists of a rotating
corner reflector and a fixed mirror. The optical path
change is represented by equation (1).
(1)
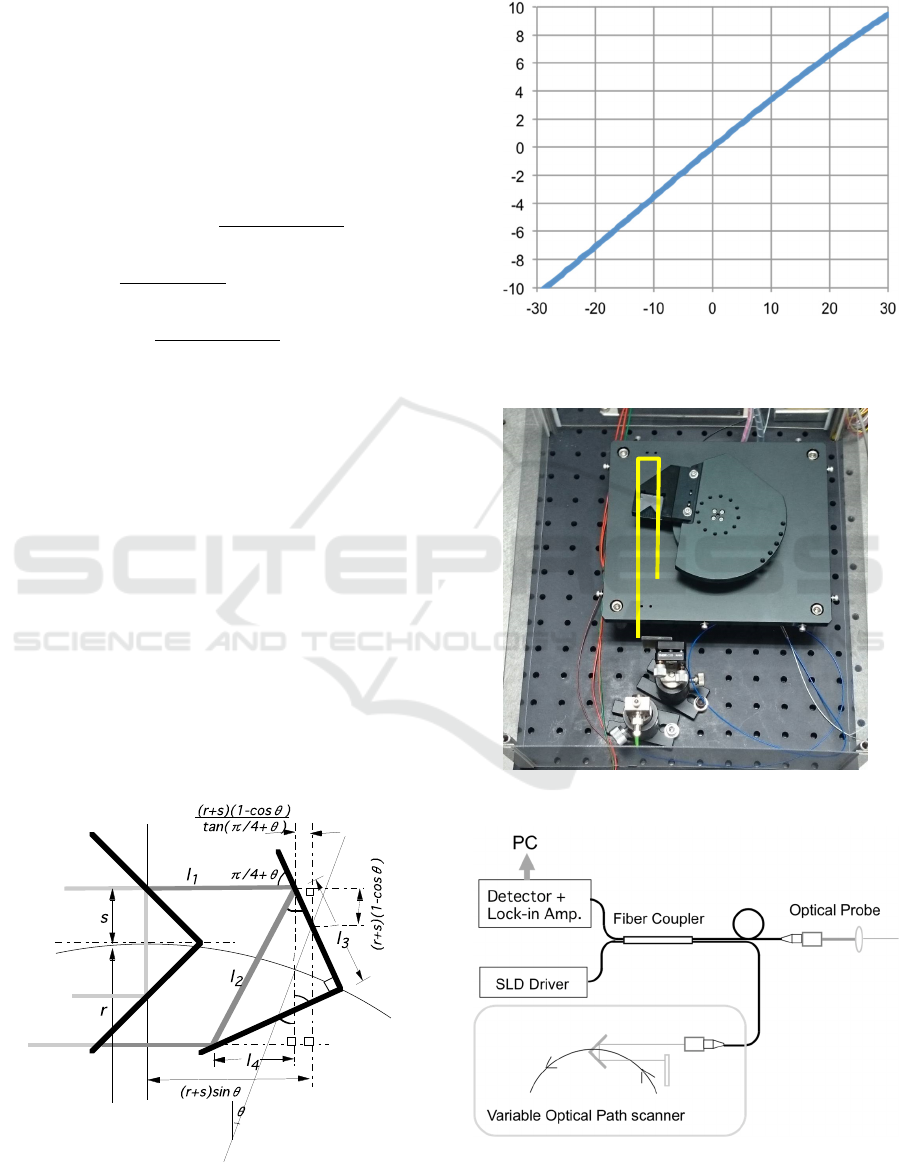
Figure 1 shows the geometrical arrangement of
the mechanism with the optical path of l
1
– l
4
.
θ
is
rotation angle [deg], r is rotation radius, s is the
offset length from the optical axis. The fixed mirror
reflects the thrown beam to the same path. The
optical path change becomes the approximately
linear motion. The optical path change of the
rotation radius of 10mm is shown in Fig.2. The
actual motion has the distortion from the linear
motion. It becomes an ogive. The distortion is about
1 – 2% within the rotation angle of +/-20 deg. The
long path industrial OCT has a rotation disk of
60mm radius, of which measurement range reaches
100mm.(Fig.3) A servo motor is installed. To
stabilize the rotation, the rotation disk is balanced its
weight. The motor has a rotary encoder to monitor
Figure 1: Optical path change by rotating reflector.
the rotation jitter.The optical setup of the long path
industrial OCT is illustrated in Fig.4.
Figure 2: Optical path length.
Figure 3: Optical path change mechanism.
Figure 4: Structure of long path industrial OCT.
l
All
= l
1
+
l
2
+
(l
1
− l
4
) − 2s
= 2l
1
+ l
2
(1 − sin 2
θ
) − 2s
l
1
= (r + s)sin
θ
−
(r + s)(1− cos
θ
)
tan(
π
/4+
θ
)
l
2
=
l
3
cos(
π
/4+
θ
)
l
3
= 2s+
(r + s)(1− cos
θ
)
sin(
π
/4+
θ
)
l
4
= l
2
sin(2
θ
)
Reflector Angle [deg]
Optical Path Change [mm]
OSENS 2016 - Special Session on Optical Sensors
346
The interferometer consists of an optical fiber
coupler. SLD beam (Anritsu Co. Ltd) is divided by
the coupler, one goes to the reference path and the
other goes to the measurement path, which has the
optical probe to focus it to the specimen. Both of
reflected beam are combined and cause the
interference within the same coupler, and detected
by the photodiode.
3 ACCURACY EVALUATION
The SLD source of 800nm-band is installed into the
long path industrial OCT. As the rotation radius of
the reflector is 60mm, the measurement range
reaches 100mm. Here it is restricted to 80mm by the
reflector size. The rotation speed is 200rpm. The
interference signal is detected as the Gaussian
envelope through amplifiers and filter circuits.
At first, the system was evaluated its accuracy.
The sample is a mirror on the linear stage. By
alternating the measurement length, the interference
position was obtained. The linear stage (Mitsutoyo
Co. Ltd) is 1m long and its accuracy was 5μm.
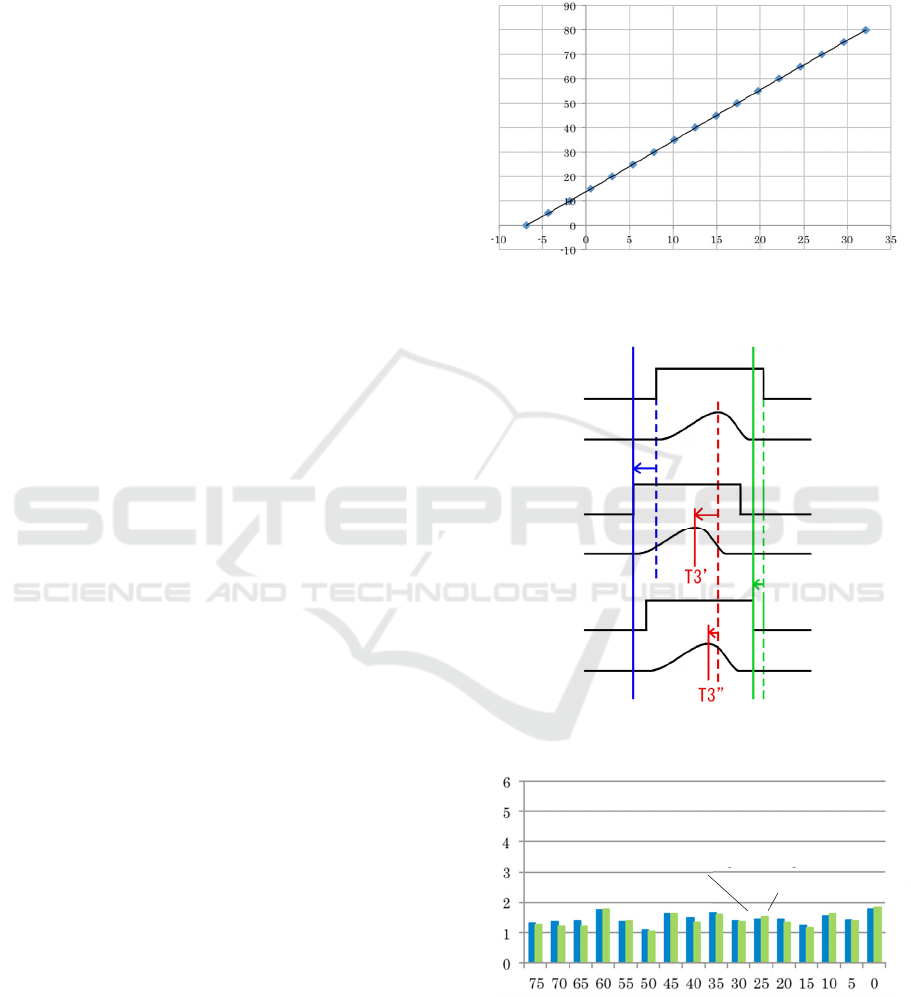
Figure 5 shows the experimental result. The Z-phase
signal of the rotary encoder is utilized as trigger and
becomes the zero position through the measurement
range of 80mm. The optical path change becomes
approximately linear change. In the measurement,
T1, T2, and T3 [ms] were obtained. T1 and T2 are
rise-up and fall-down times of A-phase signal of the
rotary encoder when the peak position as time T3 of
the interference-envelop signal appeared.
The rotation motor controls its rotation with 6-
pole coils, and its rotation speed slightly fluctuates.
Therefore, T1 – T3 has a little bit fluctuations. It
should be compensated. How to compensate it is
explained in Fig.6. As T1 average of 10 times
measurement is standard, T3 value is corrected,
which is called T1 correct. As T2 average of 10
times measurement is standard, T3 value corrected,
which is called T2 correct.
Converting the measured interference signal time
to the position, its average time is taken the place of
the optical path length with equation (1). Each value
of Fig.5 is corrected T3 average on each path length.
The approximation line is slightly s-curve (ogive). In
this study, 3
rd
approximate curve is adapted on this
corrected result. Standard variation of 10 times
measurement at each path length is summarized in
Fig.7. To search the peak position of the interference
signal, moving average and center search program,
which pursued due to the interference signal height,
are used. T2 correct on the center search program
minimized the standard variation as 1.43μm. The
goal value of 1μm was not accomplished, while we
decided it the extensional accuracy to progress the
experiment.
Figure 5: Experimental result and 3
rd
approximation line.
Figure 6: Jitter correction for reflector rotation.
Figure 7: Jitter correction result at each measurement
points.
Optical Path [mm]
Optical Path [mm]
RMS Deviation
[
]
T1
correct
T2
correct
T1 Average
T2 Average
A-Phase signal
Interference
si
g
nal
Moving Average
Center Program
Long Path Industrial OCT - High-precision Measurement and Refractive Index Estimation
347
4 REFRACTIVE INDEX
MEASUREMET
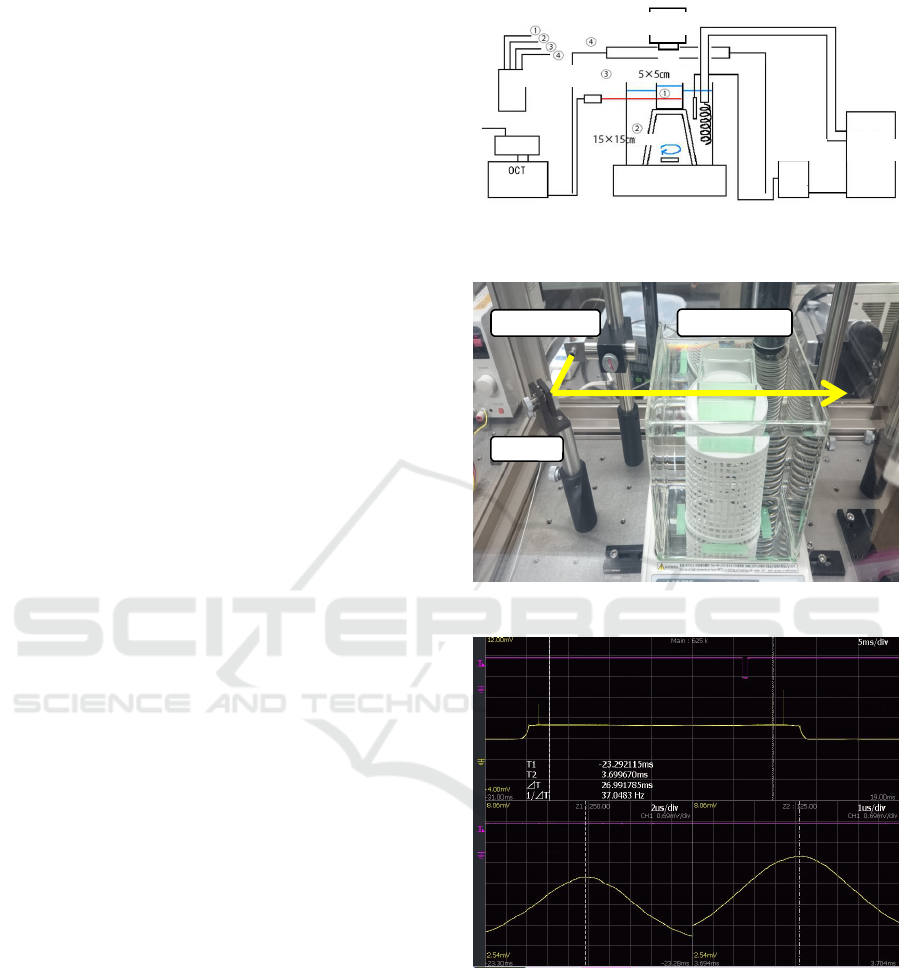
4.1 Apparatus
As the application of the long path industrial OCT,
the refractive index measurement was conducted.
The experimental set up and water tank
measurement part are shown in Fig.8 and Fig.9,
respectively. The measurement target is 5cm x 5cm
water tank (small tank). 15cm x 15cm water tank
(large tank) has a cooler terminal, and control the
water temperature including the inner small tank. In
the measurement, water temperature is lowered, and
the refractive index, which depend on the
temperature, was calculated by measuring the optical
path change between the inside glass walls of the
small tank. To stabilize the controlled temperature
inside the small tank, a stirrer rotates the large tank
water slowly. The temperature distribution of the
small tank was monitored by a thermo camera.
The OCT measurement probe was set to enter the
small tank within the measurement range. The
interference signals of the small tank were obtained
at four positions from its glass walls (each side of
the walls). Figure 10 shows the interference signals.
The refractive index was calculated by the optical
path length between the inner water-sides of the
small tank walls. The temperature was controlled
from the 25 to 2 degrees at the step of 0.5 degrees.
T2 correct with the center search program was
adapted into the refractive index calculation to fix
the maximum interference signal and to compensate
the rotation jitter. As the concrete calculation, 3
rd
approximation curve on Fig.5 was utilized, that is,
the refractive index was estimated by changing the
3
rd
approximation curve to the linear equation.
Here, the 3
rd
approximation curve is represented
as follows,
y =−0.00010456x
3
+ 0.0035485x
2
+ 2.0526x +13.845
(2)
while the linear change equation obtained by the
whole measurement range is expressed as follows.
y = 2.0636
+
14.023
(3)
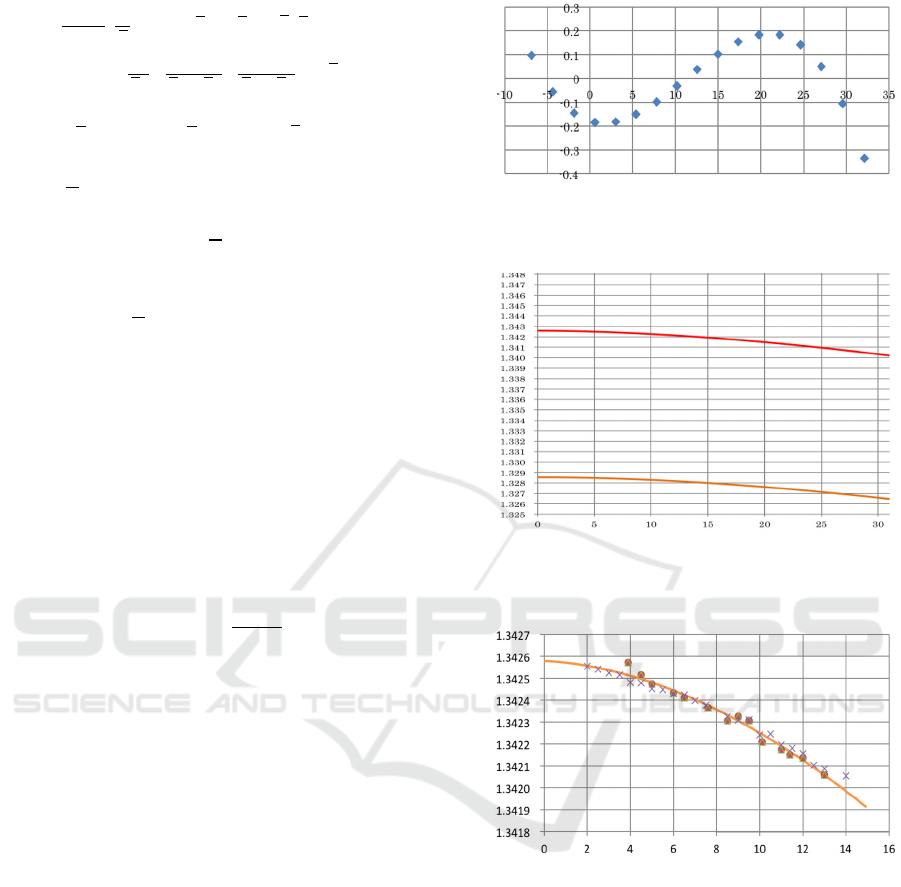
To change the equation (2) to the equation (3) is
conducted by calculating the difference between
them, which is shown in Fig.11. The optical path
length of 12mm became the center and the distortion
of ogive from the linear line was balanced. The
difference was changed as the distortion value to the
linear one.
Figure 8: Water refractive index measurement by long-
path OCT.
Figure 9: Measurement of water refractive index.
Figure 10: Interference Signals on long-path OCT.
4.2 Group Index Estimation
The refractive index depends on material density,
temperature, and incident wavelength. Absolute
refractive index equation shown as equation (4) is a
regression formula due to the above parameters
based on Lorentz-Lorentz equation.
Cooler
Thermo
Camera
SLD
Stirrer
Thermo-
meter
Thermo
Controller
OCT Probe
Water Tank
Mirro
r
Inner Signal①
Inner Signal②
Inner Signal①
Inner Signal②
Outer Signal②
Outer Signal①
OSENS 2016 - Special Session on Optical Sensors
348
n
2
+1
n
2
+ 2
⋅
1
D
= a
0
+ a
1
D + a
2
T + a
3
λ
2
T
+
a
4
λ
2
+
a
5
λ
2
−
λ
UV
2
+
a
6
λ
2
−
λ
IR
2
+ a
7
D
2
(4)
D = D / D
0
, T = T / T
0
,
λ
=
λ
/
λ
0
where n is the absolute refractive index of pure
water,
D
is density scale represented by the ratio
between the pure water density D and the standard
density D
0
[kg/m
3
],
T
is temperature scale
represented by the ratio between the pure water
temperature T [K] and the standard temperature
T
0
(=273.15K).
λ
is wavelength scale represented by
the ratio between the wavelength in vacuum λ and
the standard wavelength
λ
0
(=0.589μm). a
0
– a
7
are
optimized coefficients and
λ
UV
and
λ
IR
are UV / IR
resonances. [7]
The OCT light source (here, SLD light source)
has wide spectrum. It disperses in a material, and
difference of speed (group index) due to the
refractive index occurs. That is, the refractive index
estimated by the OCT system becomes group index
of refraction
n
g
. It is expressed as equation (5).
n
g
= n(
λ
) −
λ
dn(
λ
)
d
λ
(5)
Figure 12 shows the absolute index calculated by
the equation (4) and the group index calculated by
the equation (5) against the wavelength of
859.681nm, which is same as the experiment. The
experimental results were compared with this group
index.
The estimated experimental result is shown in
Fig.13. The measurement was conducted by
lowering the temperature from the room temperature
to 2 degrees. In the figure, the results are represented
as average and the center search program with 10
times measurement. Both of the estimations well
matched with the theoretical value of group index.
The maximum errors from the theoretical curve of
the average and the program were 0.00070 and
0.00057, respectively. Both of the estimations get
the five-figured accuracy. The maximum error
occurred on the longest path length. It is caused by
the 3
rd
approximation curve we used.
Figure 11: debiation between 3rd approximation and linear
motion.
Figure 12: Absolute refractive index and calculated group
refractive index.
Figure 13: Group refractive index of experiment and
theoretical values.
5 SUMMARY
In this study, we set our goal to the high-precision of
1μm in the measurement range of long path length
of 100mm. It means five-figured accuracy. As a
result, the measurement accuracy achieved 1.43μm
as standard variation. The main reason not to get less
than 1μm accuracy is indetermination of the linear
stage we used (5μm). The rotation motor has the
rotation jitter of 0.00036 degrees as standard
variation. It is equal to 0.74μm of the fluctuation of
Angle [deg]
RMS Deviation [μm]
No
r
mal
Ref
r
active Index
Tempe
r
a
t
u
r
e
[
de
g
]
Group
Temperature [deg]
Group Refractive Index
× Average
● Center Program
Long Path Industrial OCT - High-precision Measurement and Refractive Index Estimation
349

the optical path difference. It means that the
experimental result has room for improvement. At
the next step, we prepare the high-precision linear
stage to verify the high accuracy of our long path
system.
In this report, the refractive index of pure water
was estimated successfully with the five-figured
accuracy. This application is not only to the pure
water, but also to the mixed liquid solution to
confirm the mixing ratio and the concentration. By
scanning the OCT probe against the optical axis, the
concentration distribution and its fluctuation of the
liquid solution and temperature distribution can be
evaluated.
The measurement range can be enlarged by
magnifying the rotation radius. The rotation disk,
however, is difficult to rotate stably. In this study,
plural reference paths make it possible to expand the
measurement range with the same accuracy with this
experiment.(Harvey 1998) We seek the
improvement of the measurement range and its new
applications.
REFERENCES
Danielson B. L. and Boisrobert C. Y. 1991, “Absolute
optical ranging using low coherence interferometry”,
App. Opt. Vol. 30, No.21 pp.2975-2979.
Huang D., Swanson E. A., Lin C. P., Schuman J. S.,
Stinson W. G., Chang W., Hee M. R., Flotte T.,
Gregory K., Puliafito C. A., J. G. Fujimoto, 1991,
“Optical Coherence Tomography”, Science, Vol. 254,
pp.1178-1181.
Brezinski M. E. and Fujimoto J. G., 1999, “Optical
Coherence Tomography: High-Resolution Imaging in
Nontransparent Tissue”, IEEE J. Quant. Electron., Vol.
5, No. 4, pp.1185-1192.
Shiina T., Moritani Y., Ito M., and Okamura Y.,
2003, "Long optical path scanning mechanism for
optical coherence tomography", Applied Optics,
Vol.42, No. 19, pp.3795-3799.
Shiina T., Miyazaki H., and Honda T., 2009, “Factory
built-in type simplified OCT system for industrial
application”, IEEJ C、Vol.129, No.7, pp.1276-1281,
(Japanese).
Shiina T., 2014, “Optical Coherence Tomography for
industrial application” Handbook of Optical
Metrology 2
nd
Edition, CRC Press.
Harvey A. H., Gallagher J. S., and J. M. H. L.,
1998, ”Revised Formulation for the Refractive Index
of Water and Steam as a Function of Wavelength,
Temperature and Density”, J. Phys. Chem. Ref. Data,
Vol.27, pp.761-774.
Shiina T., PCT/JP2010/070844.
OSENS 2016 - Special Session on Optical Sensors
350
