
High Sensitive Long Period Fiber Grating Biosensor for Cancer
Biomarker Detection
Giuseppe Quero
1
, Marco Consales
1
, Renato Severino
1
, Patrizio Vaiano
1
, Alessandra Boniello
1
,
Annamaria Sandomenico
2
, Menotti Ruvo
2
, Anna Borriello
3
, Laura Diodato
3
, Simona Zuppolini
3
,
Michele Giordano
3
, Immacolata Cristina Nettore
4
, Annamaria Colao
4
, Paolo Emidio Macchia
4
,
Flavio Santorelli
5
, Antonello Cutolo
1
and Andrea Cusano
1
1
Optoelectronics Group, Dept. of Engineering, University of Sannio, Benevento, Italy
2
Istituto di Biostrutture e Bioimmagini, Consiglio Nazionale delle Ricerche (IBB-CNR) and
Centro Interuniversitario di Ricerca sui Peptidi Bioattivi (CIRPeB), Napoli, Italy
3
Institute for Polymers, Composites and Biomaterials (IPCB) -CNR, Portici, Italy
4
Department of Clinical Medicine and Surgery, University of Napoli “Federico II”, Napoli, Italy
5
Hospital Consulting SpA, Bagno a Ripoli, Firenze, Italy
Keywords: Long Period Fiber Grating (
LPG), Optical Fiber Biosensor, Reflection Type LPG, Thyroglobulin.
Abstract: We report an innovative fiber optic biosensor based on Long Period Gratings (LPGs) working in reflection
configuration for real time monitoring of human Thyroglobulin (Tg), a protein marker of differentiated
thyroid cancer. A standard LPG is first transformed in a practical probe working in reflection mode, and
then it is coated with a single layer of atactic polystyrene (aPS) in order to increase its surrounding
refractive index sensitivity and to provide, at the same time, the desired interfacial properties for a stable
anti-Tg antibody. The functionalized reflection-type LPG biosensor clearly demonstrates the effectiveness
and sensitivity of the developed biosensing platform, allowing the real time and label-free detection of Tg in
the needle washouts of fine-needle aspiration biopsies, at concentrations useful for pre- and post-operative
assessment of the biomarker levels. Analyte recognition and capture were confirmed with a parallel on fiber
ELISA-like assay using, in pilot tests, the biotinylated protein and HRP-labeled streptavidin for its
detection. Dose-dependent experiments showed that the detection is linearly dependent on concentration
within the range between 0 and 4 ng/mL, while antibody saturation occurs for higher protein levels.
1 INTRODUCTION
The ever increasing incidence of cancer diseases is
imposing the development of highly sensitive and
effective tools for the real-time detection of
associated biomarkers for early diagnosis and
optimal treatment. This is particularly needed for the
diagnosis of papillary thyroid cancer, whose
incidence has dramatically increased over the past
few years in the United States and is predicted to
increase in the next years, recording a greater
frequency in the female population (Weir et al.,
2015). Papillary thyroid cancer is the most common
malignancy of the thyroid. Although it has favorable
long-term outcome, an early stage diagnosis is
fundamental to reduce morbidity and mortality. The
frequency of lymph nodes involvement is 27% to
46% at initial diagnosis and the recurrence rate is
3% to 30% during post-operative follow-up.
Distinguishing lymph nodes metastasis from benign
reactive lymphadenitis is therefore critical to rank
the malignancy risks in patients with papillary
thyroid cancer (Moon et al., 2013).
Thyroglobulin (Tg) is a thyroid specific 660 kDa
dimeric protein used by thyroid follicular cells as
precursor for biosynthesis of thyroid hormones.
Serum Tg levels are elevated in patients with goiter
and in several other clinical conditions, and to date,
the measurement of Tg is the mainstay in the post-
surgical follow-up of differentiated thyroid cancer
Quero, G., Consales, M., Severino, R., Vaiano, P., Boniello, A., Sandomenico, A., Ruvo, M., Borriello, A., Diodato, L., Zuppolini, S., Giordano, M., Nettore, I., Colao, A., Macchia, P., Santorelli,
F., Cutolo, A. and Cusano, A.
High Sensitive Long Period Fiber Grating Biosensor for Cancer Biomarker Detection.
DOI: 10.5220/0005846705610569
In Proceedings of the 9th International Joint Conference on Biomedical Engineering Systems and Technologies (BIOSTEC 2016) - Volume 5: HEALTHINF, pages 561-569
ISBN: 978-989-758-170-0
Copyright
c
2016 by SCITEPRESS – Science and Technology Publications, Lda. All rights reserved
561

(Pacini and Pinchera, 1999), As thyroid-specific
protein, its levels in lymph nodes are normally very
low and an increased Tg level in the needle washout
has been associated with metastasis of lymph nodes
in patients affected by differentiated thyroid
carcinoma (Giovanella et al., 2013). Its
determination is currently based on immunometric-
chemiluminescent or radioimmunometric assays
(Spencer and Lopresti, 2008).
In recent years, efforts to define and optimize
diagnostic and biosensing tools that incorporate such
features are significantly increased. Molecular
biosensors are preferred as clinical diagnostic tools
than other traditional methods because of real-time
measurement, rapid diagnosis, multi-target analyses,
automation, and reduced costs. A few works have so
far been proposed regarding Tg detection using a
biosensor platform. In 2008 Choi et al. detected Tg
in a cocktailed mixture of proteins by using the
competitive protein adsorption/exchange reactions,
namely Vroman effect. Implemented on a
microfluidic system, the target protein displaced a
pre-adsorbed weak-affinity protein on one surface of
the device, while another pre-adsorbed high-affinity
protein on an adjacent surface was not displaced.
Differential measurement using surface plasmon
resonance (SPR) phenomenon allowed Tg detection
(Choi and Chae, 2009). Recently Dantham et al.
(Dantham et al., 2013) reported the detection of
single human Tg protein molecule from the
resonance frequency shift of a whispering gallery
mode-nanoshell hybrid resonator upon adsorption on
the nanoshell. However, although the high
sensitivity of the proposed devices, the absence of a
bioreceptor featuring high specificity and affinity,
which can then discriminate between target and non-
target molecules, prevented the use of such systems
in clinical and diagnostic applications.
Moreover in the last years, the continuous
demand for lower limits of detection combined with
cost effectiveness and reliability features has been
the driving force for the successful demonstration of
optical label free biosensors with impressive figures
of merit (Fan et al., 2008; Hoa et al., 2007). Relative
principles of operation include SPR (Chung et al.,
2006; Teramura and Iwata, 2007), interferometry
(Weisser et al., 1999; Schneider et al., 1997), optical
waveguide-based biosensors (Website, http://
www.neosensors.com), optical ring resonators (Chao
et al., 2006; Ren et al., 2007; Hanumegowda et al.,
2005), fiber-based biosensors (Lee and Fauchet,
2007; Skivesen et al., 2007; Chryssis et al., 2005;
DeLisa et al., 2000; Zhang et al., 2005). Among the
others, fiber optic optrodes constitute a valuable
platform for label biosensing because of its intrinsic
biocompatibility, compact size, multiplexing
capability, remote operation and easy integration in
medical needles. In particular, in this work we
selected optical fiber LPGs as evanescent wave-
based biosensors for the measurements of local
refractive changes due to molecular binding
occurring at the sensor surface (Pilla et al., 2011;
Pilla et al., 2012, Del Villar et al., 2005; Cusano et
al., 2006, Pilla et al., 2009).
An LPG consists of a periodic modulation of the
refractive index (RI) at the core of an optical fiber
that results in the coupling of the light between core
and cladding modes (James and Tatam, 2003).
Thanks to the giant sensitivity to surrounding
refractive index (SRI) changes, LPGs represent a
very promising technological platform, which can be
employed in a wide number of chemical and
biological applications (Chiavaioli et al., 2014;
Eftimov, 2010; Baldini et al., 2012; Tripathi et al.,
2012; Smietana et al., 2015; Falciai et al., 2001;
Falate et al., 2005; Chen et al., 2007; Ramachandran
et al., 2002).
One of the peculiarities of LPGs platforms is
their operation in transmission mode which makes
the device sensitive to the bending, therefore
requiring the development of appropriate strain-free
packages to host the LPG device. In particular, the
bending applied on the LPG can introduce
unexpected variations in the spectrum of the
transmitted optical signal, thus complicating the
sensor signal interpretation. In addition the
capability to work in reflection mode addresses the
mentioned issues and allows the easy integration of
the reflective optrode in the vials containing the
biological solution and represents a more practical
and robust solution to be employed for concrete
biological applications (Huang et al., 2013; Quero et
al., 2015; Alwis et al., 2013; Cao et al., 2013).
In this work, we present the development of a
reflection-type LPG biosensor able to perform the
real time detection of thyroid cancer biomarkers in
the needle washouts of fine-needle aspiration
biopsies. After fabrication, the reflection-type LPG
is functionalized with a hydrophobic coating of a
specific bioreceptor, in our case an anti-Tg
monoclonal antibody and the protein is detected in
label-free experiments. Results clearly demonstrate
the effectiveness and sensibility of the biosensing
platform, allowing the in vitro detection of sub
ng/ml concentrations of human purified Tg. To
validate the potential translation of such LPG-based
biosensor into the clinical practice, detection
experiments on clinical samples have been carried out.
SmartMedDev 2016 - Special Session on Smart Medical Devices - From Lab to Clinical Practice
562
2 FABRICATION PROCESS
2.1 Reflection-type LPG Transducer
Fabrication
A customized LPG (Λ=370μm) UV-written in a
standard single-fiber was used for the biosensor
fabrication. To realize a more practical probe which
has to be immersed into laboratory vials containing
the biological samples under test, the crucial step is
the development of an LPG working in reflection
configuration. The first steps regarding the
fabrication of the reflection-type LPG (RT-LPG)
probe is the cut of the fiber inside which the LPG is
inscribed and the integration of a completely
reflecting layer (i.e. a mirror) on the fiber facet (see
Figure 1). A key aspect of this step is the
identification of the precise LPG position within the
fiber. This is of primary importance in order to cut
the fiber just after the grating, and to avoid the
formation of interference fringes within the
attenuation bands, typical of self-interfering LPGs
(Alwis et al., 2013).
Once identified the LPG position, a high
precision fiber cleaver (Fujikura CT-30) was used to
cut the optical fiber just after the grating, followed
by the integration of an Ag reflecting layer on the
facet of the cut fiber. To this aim, a silver mirror
reaction (Tollen’s test) was adopted (Yin et al.,
2002).
1620 1630 1640 1650 1660 1670
-35
-30
-25
-20
-15
-10
-5
Wavelength [nm]
Reflectance [dB]
Transmission spectrum
Reflection before mirror formation
Reflection after mirror formation
LPG
LPG
Cut position
Reflecting layer
(a)
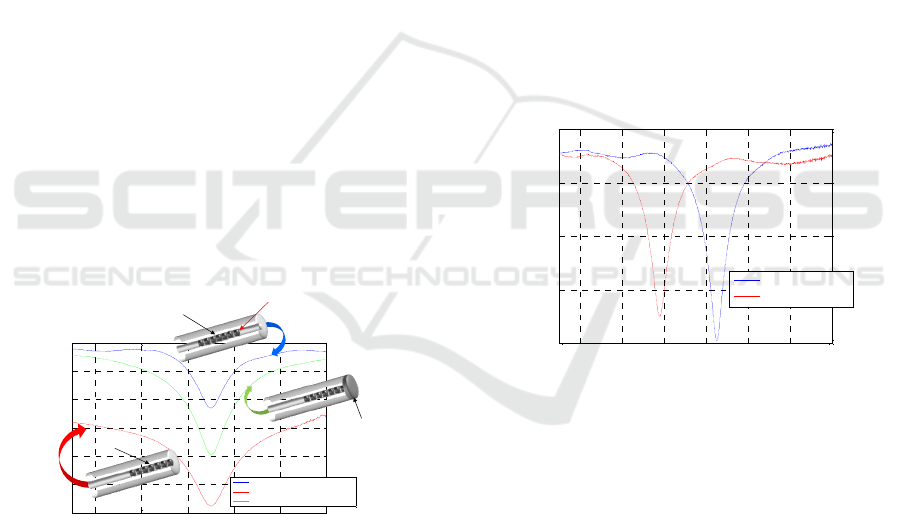
Figure 1: LPG spectra acquired in air before the fiber cut
(blue curve), just after the fiber cut (red curve) and after
the mirror integration (green curve) and schematics of the
reflection-type LPG fabrication steps (in the insets).
Figure 1 shows the LPG spectra acquired just
before the optical fiber cut (i.e. in transmission
configuration), after the fiber cut (i.e. in reflectance
configuration before the mirror formation) and after
the mirror formation at the fiber end-face. It can be
seen that a significant baseline reduction occurs after
the cut (red curve), mainly due to the fact that light
passing through the LPG is mostly transmitted at the
fiber/air interface, and only a small portion (~3-4%)
of it is reflected back into the fiber. Nevertheless, as
soon as the Ag layer is formed at the fiber
termination, almost all the initial power is recovered
(green curve). We point out that the use of
reflection-type LPGs not only is of fundamental
importance to transform an LPG-based sensor in a
more practical probe for concrete biomedical
applications, but also improves the resonance
visibility (see Figure 1) due to the double passing of
light through the grating.
2.2 Overlay Deposition
The last fabrication step relied on the aPS overlay
deposition onto the RT-LPG surface using the dip-
coating (DC) technique. In particular, the aPS
overlay deposition was performed via the DC
process by means of an automated system (NIMA
Technology Micro-Processor Interface IU 4) at an
immersion/extraction speed of 100 mm/min (Pilla et
al., 2011; Pilla et al., 2009).
1580 1600 1620 1640 1660 1680 1700
-25
-20
-15
-10
-5
Wavelength [nm]
Reflectance [dB]
LPG bare
LPG aPS-coated
(a)
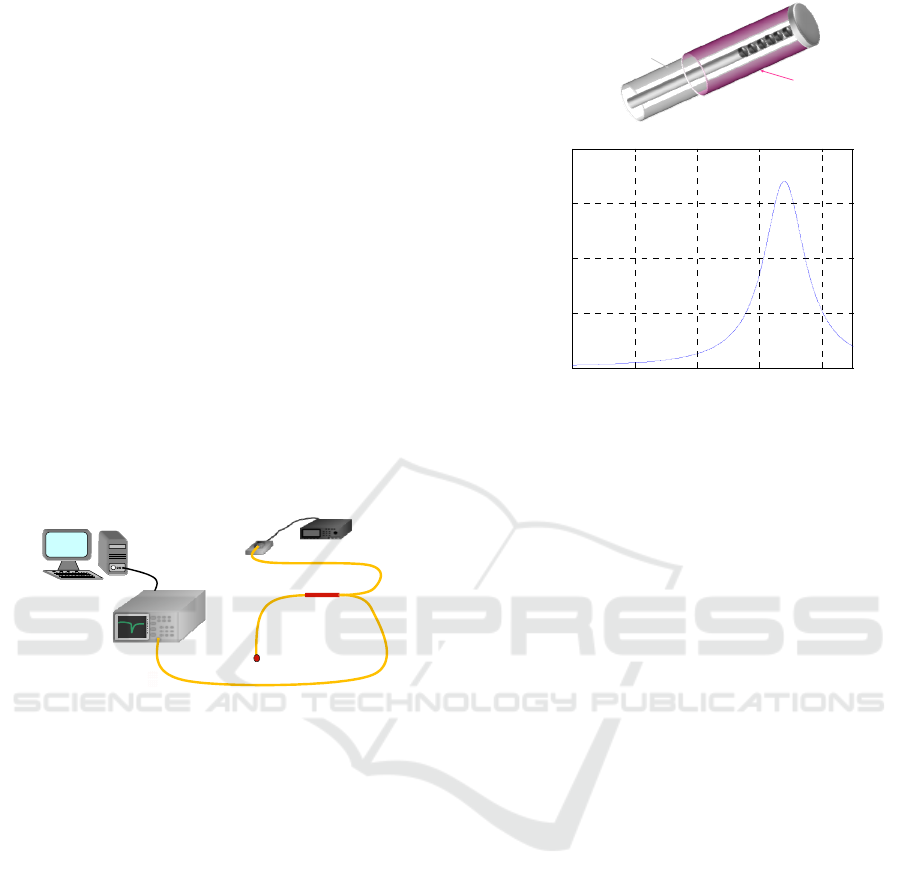
Figure 2: Spectra of the bare (blue line) and aPS-coated
(red line) RT-LPG.
Figure 2 reports the spectral position of the sixth
order cladding mode in the bare RT-LPG (blue
curve) and after the aPS overlay deposition (red
curve). All the spectra were recorded with the device
surrounded by air.
The aPS overlay thickness was chosen on the
basis of a preventive design process (carried out by
means of a virtual environment for the analysis and
simulation of nano-scale coated LPGs) in order to
optimize the device sensitivity in correspondence of
an SRI=1.340, which approaches the RI of the buffer
solution used in our binding experiments. The
optimized thickness overlay allows the modal
transition phenomena to take place and makes the
reflection-type LPG very high sensitive for a
SRI=1.340 is 310 nm.
High Sensitive Long Period Fiber Grating Biosensor for Cancer Biomarker Detection
563
The spectral characterization of the fabricated
LPG versus SRI has been carried out by submerging
the probe into aqueous glycerol solutions
characterized by different RI in the range 1.335-
1.460, in order to validate the fabrication process
success and the SRI sensitivity in correspondence of
an SRI=1.340. To this aim, an optoelectronic set-up
(see Figure 3) comprising a broadband light source
(with bandwidth 1200-1700 nm), a 2x1 directional
coupler and an optical spectrum analyzer (OSA,
ANDO AQ6317C, wavelength resolution 10 pm,
dynamic range 60 dB) was used for the acquisition
of the LPG reflection spectrum at the different
stages of the device fabrication and characterization.
The OSA is connected to a personal computer and
controlled by a LabView plug-in, enabling the
automatic acquisition of the RT-LPG spectra.
Acquired spectra are then automatically filtered and
elaborated by a MATLAB script that provides the
central resonance wavelengths (λc) of each
spectrum.
PC
ANALIZZATORE DI
SPETTROOTTICO
(OSA)
SORGENTE ABANDA LARGA
DUT
FIBEROPTICCOUPLER
2X1
Figure 3: Schematic interrogation set-up.
During the biological experiments the RT-LPG
spectra is automatically acquired every 45 seconds,
thus providing a continuous and real time
monitoring of the interaction kinetics of the
biological molecules on the RT-LPG surface.
2.3 Surrounding Refractive Index
(SRI) Sensitivity Characterization
The spectral characterization of the fabricated LPG
versus SRI has been carried out by submerging the
probe into aqueous glycerol solutions characterized
by different RI in the range 1.335-1.460.
As reported in Figure 4b, the obtained SRI
sensitivity (|∂λc/∂SRI|) exhibits the typical
resonance-shaped behavior of transition mode LPG,
thus confirming the fabrication process success. At
the same time, it can be seen that the SRI sensitivity
in correspondence of an SRI=1.340 is equals to
~1700 nm/RIU.
1 1.1 1.2 1.3 1.4
0
500
1000
1500
2000
SRI
SRI Sensitivity [nm/RIU]
(
Opticalfiber
aPS layer
(c)
(a)
(b)
Figure 4: a) Schematic view of the final RT-LPG
transducer and b) Experimental SRI sensitivity
(|∂λc/∂SRI|) vs. SRI curve for the cladding mode LP
07
.
3 CHARACTERIZATION OF THE
TG/ANTI-TG MAB
INTERACTION
As a Tg bioreceptor we choose one of the several
commercially available anti-Tg monoclonal
antibodies because such reagents are generally
characterized by extremely high specificity and
affinity for the target molecules. The affinity of the
monoclonal antibody for Tg was however assessed
using both traditional immunoenzymatic and real-
time assays. An indirect ELISA was firstly
performed by adsorbing Tg on multiwell plates and
adding increasing amounts of the mouse anti-Tg
monoclonal antibody (Figure 5a). Following the
detection step with an anti-mouse antibody
conjugated with HRP, increasing chromogenic
signals (corresponding to increased bound analyte)
were recorded with increasing antibody
concentration. As shown in Figure 5a, a strong and
saturable binding signal was observed even at low
antibody concentrations. Saturation started at 100
pM mAb. Fitting of data points by a non-linear
algorithm, where we assumed a 1:1 binding
stoichiometry, provided a Dissociation constant
(KD) of 72 pM, a value indicative of the high
affinity of the antibody for the specific analyte. The
presence of high concentrations of BSA in the assay
(1% w/w, that is 10 mg/mL), also provided a very
strong indication of selectivity. Indeed blank signals
SmartMedDev 2016 - Special Session on Smart Medical Devices - From Lab to Clinical Practice
564
were negligible and after subtraction a 2.0 AU
residual signal was measured at saturation. To
further characterize the binding between the
antibody and Tg, we next performed a label free
binding assay using an SPR-based instrument
(BIAcore). The anti-Tg antibody and Tg were
thereby immobilized on the surface of the sensor
chip (1120 and 650 RU immobilization level,
respectively. Not shown). In one experiment with
the Tg-derivatized chip, mAb solutions at increasing
concentrations, between 0.25 and 1.5 nM, were
injected.
0 200 400 600 800 1000
0.0
0.5
1.0
1.5
2.0
anti-Tg mAb, pM
Abs
450nm
(a)
(b)
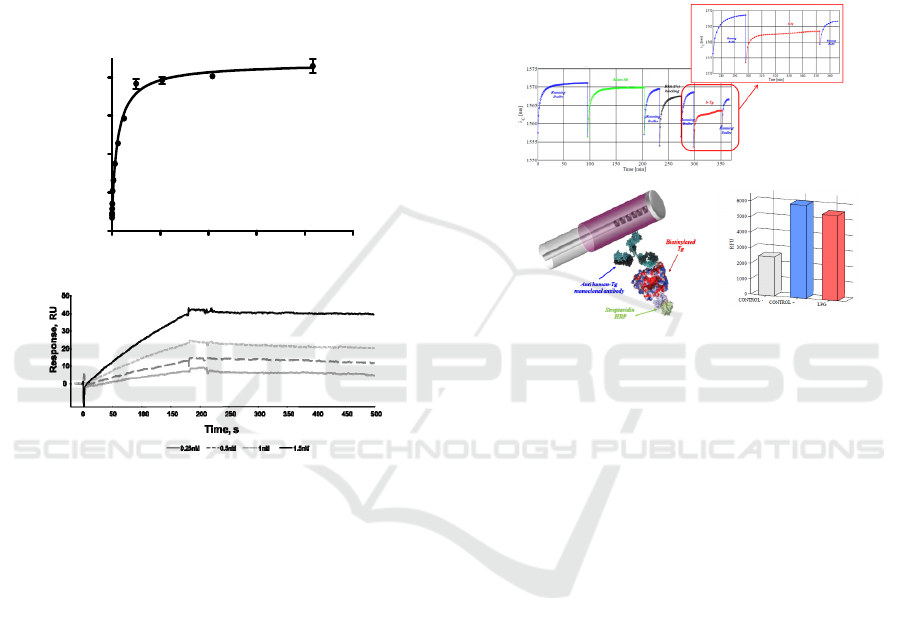
Figure 5: Biochemical system characterization. a) Dose-
response indirect ELISA assay performed to assess
antigen/antibody affinity. b) SPR assay using Biacore of
the binding kinetic of anti-Tg monoclonal antibody to
immobilized Tg, at different antibody concentrations.
As shown in Figure 5b, dose-response association
and dissociation curves were obtained witnessing the
high affinity and specificity of the interaction. Using
the kinetic parameters a KD of 70 pM was
estimated. This value was in full agreement with that
extrapolated by ELISA, confirming the strength of
the interaction and the high specificity. When we
probed the immobilized antibody with soluble Tg a
significantly higher KD (about 1.3 nM) was
determined (data not shown) than that determined by
ELISA. This was likely due to inappropriate
antibody immobilization.
3.1 Assessment of Tg Capture on LPG
Biosensor Surface by on-Fiber
ELISA-like Assay
Figure 6a shows a typical sensorgram, reporting the
measured resonance wavelenghts as function of
time, observed for a biotinylated human
Thyroglobulin detection assay and in the inset the
magnification of the experiment final step regarding
the Tg detection.
(a)
(b)
(c)
Figure 6: a) Sensorgram obtained for the detection of
40µg/ml biotinylated human Thyroglobulin using the
reflection-type Long Period Grating biosensing platform;
b) schematic view of the ELISA-like assay performed on
the functionalized LPG; c) binding signals obtained by the
ELISA-like assay.
After a prolonged and satisfactory adaptation of
the functionalized biosensor in the running buffer,
an anti-Thyroglobulin monoclonal antibody,
previously selected for its affinity and specificity for
the identified marker and deeply characterized by
label-free and immunoenzymatic assays, was
immobilized on the probe active surface via
hydrophobic coating, recording a 1.9 nm wavelength
shift of the resonant peak.
After analyte capture to the specific receptor (see
magnification in Figure 6a, a 2.0 nm wavelength
shift of the resonant peak was observed. To avoid
the influence of the different solutions refractive
index change, peak shifts have been estimated as a
difference between two successive immersions in
the running buffer, specifically before and after
dipping the sensor in the test solution. In addition,
by exploiting the binding of HRP-labeled
streptavidin to the biotinylated Thyroglobulin,
analyte capture was confirmed in a parallel on fiber
ELISA-like assay (Figure 6b-c).
High Sensitive Long Period Fiber Grating Biosensor for Cancer Biomarker Detection
565

4 DETECTION OF TG WITH LPG
BIOSENSOR
4.1 Calibration Curve for the Detection
of Human Tg with LPG Biosensor
To use the platform for the detection of Tg in
biological fluids, we first evaluated the system dose-
response features and the associated sensitivity. The
system was therefore tested on a set of several
different Tg solutions at different concentrations
ranging between 0.08 ng/mL (0.13 pM) to 88 ng/mL
(146 pM). Since no regeneration steps were carried
out, different LPG biosensors were used for this test
and each transducer was used for the detection of
two cumulative and consecutive analyte
concentrations.
At the different concentrations (0.08 ng/mL, 0.88
ng/mL, 4.0 ng/mL, 8.0 ng/mL, 44 ng/mL and 88
ng/mL), we observed the following average values
of Δλ
Tg-binding
: 0.26 nm, 1.03 nm, 1.65 nm, 2.45 nm,
3.35 nm and 3.58 nm, respectively. A blank average
value of 0.10 nm, accounting for the non-specific
binding, was instead measured using the transducer
without antibody coating. The corresponding dose-
dependent curve is reported in Figure 7, where we
can observe the dose-dependency and the saturation
reached yet between about 20 and 30 ng/mL of Tg
(33 pM and 50 pM, respectively). Also, the analyte
could be still detected with a remarkable difference
over the non-specific recognition at the lowest
concentration of 0.08 ng/mL.
Although the fabrication process was robust and
repeatable, a normalization procedure was needed to
account for the even tiny differences of device
performances. Such differences may occur due to
the LPG fabrication tolerances, or to slightly
different antibody coatings obtained on the distinct
devices. To normalize the signals we used the
wavelength shift occurred upon mAb coating, as an
indirect measure of surface sensitivity of each LPG
probe. We thus calculated the final observable (O) as
reported in the following equation 1:
Observable (O) = Δλ
T
g
-
b
indin
g
+ Δλ
mAb-coatin
g
(1)
Where, Δλ
Tg-binding
and Δλ
mAb-coating
are the
differences between the stabilized central
wavelength of the attenuation band in buffer
solutions before and after contact with the
biomolecule solution and denote Tg binding and
mAb coating onto the LPG surface, respectively.
The KD was determined by reporting the observed
resonance peak shift at every concentration versus
analyte concentration. Some antibody-coated optical
fibers were immersed in buffer alone and used as
blank.
Hydrophobic adsorption of the antibody can be
influenced by several factors, such as temperature,
exposure time, different surface properties and
ligand orientation, thus influencing transducer
sensitivity. Such variability could result in different
effective detection capability and sensitivity between
different functionalized biosensors. Moreover, any
sensitivity variation of the biosensor associated to
different polymer thickness, that could cause
significant underestimation of Tg concentration, is in
this way corrected. It is also important to underscore
that the dip-coating technique used to deposit the
polymer on the optical fibers, does not guarantee a
tight control over polymer thickness at the
nanometer scale. The normalization that we have
introduced attenuates the impact of such factors and
we indeed observed an optimal correlation between
data obtained with different optical fibers.
0 50 100
0
0.2
0.4
0.6
0.8
1
Tg Concentration [ng/mL]
Observable O [nm/nm]
h-Tg
fitting data
Figure 7: Calibration curve for the semi-quantitative
detection of human Thyroglobulin using RT-LPG
biosensor. Blue dots refer to the dose-dependent assay
performed to obtain the calibration curve.
Data clearly show that human Tg bound with
high affinity and in a dose dependent manner to the
monoclonal antibody immobilized onto the solid
phase. Also, it is worth noting that the level of
nonspecific adsorption of analyte to the surface is
particularly low, suggesting that functionalization
and blocking were particularly effective and that
selectivity was also particularly high, given the very
poor recognition of albumin present at high
concentration.
From the plot of resonance peak shifts against
analyte concentration reported in Figure 7, we also
estimated a KD of about 6 pM, which is in the same
low pM range of that determined by ELISA and by
Biacore (about 70 pM). Such KD value also reflects
the high sensitivity of the detection system, which is
able to detect as low as 0.08 ng/mL Tg under these
SmartMedDev 2016 - Special Session on Smart Medical Devices - From Lab to Clinical Practice
566
conditions. A linear dose-response is grossly
obtained within the 0 – 4 ng/mL range (0 – 6.7 pM).
4.2 Detection of Tg in Clinical Samples
RT-LPG-based biosensors were used for the ex-vivo
detection of human Tg from needle washouts of
fine-needle aspiration biopsies of thyroid nodules
from several different patients.
(a)(a)
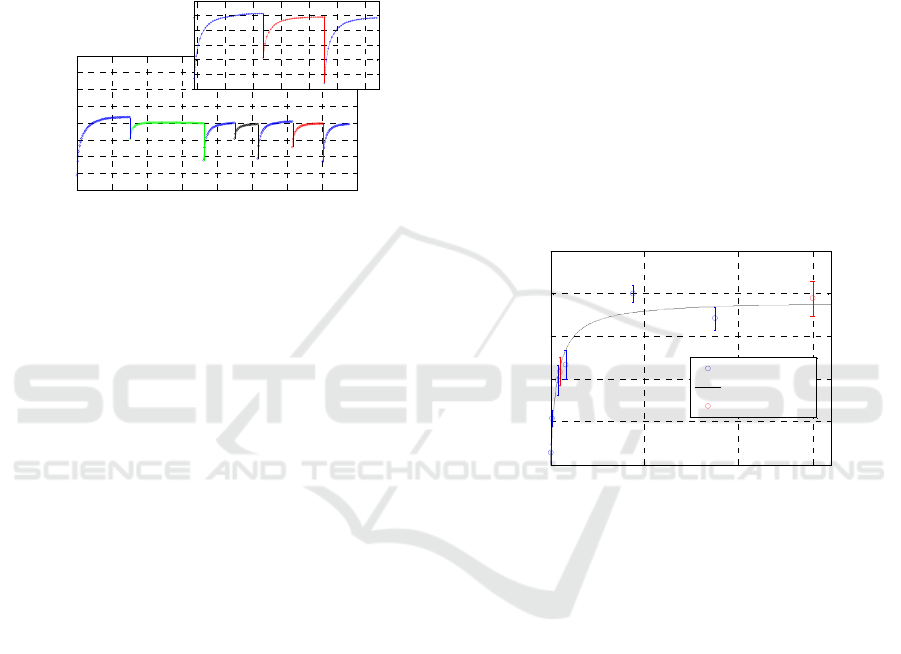
0 50 100 150 200 250 300 350 400
1530
1540
1550
1560
1570
1580
1590
1600
1610
Time [min]
C
[nm]
III
Running
Buffer
IV
BSA
V
Running
Buffer
VII
Running
Buffer
VI
Tg
I
Running
Buffer
II
Mono Ab
260 280 300 320 340 360 380
1545
1550
1555
1560
1565
1570
1575
Time [min]
C
[nm]
V
Running
Buffer
VII
Running
Buffer
VI
Tg from fine-needle
aspiration biopsy
Figure 8: RT-LPG sensorgram reporting the wavelength
shift of 6th order cladding mode attenuation band during
human Thyrogobulin detection from the needle washout of
fine-needle aspiration biopsy. In magnification the
wavelength shift during Thyroglobulin binding event is
reported.
Figure 8 shows typical sensorgrams obtained for
such the real-time detection of human Tg. The
transducer was functionalized as described above by
immersing the probe in a solution containing the
anti-Tg mAb. After the blocking step necessary to
reduce non-specific adsorption of the analyte, the
probe was immersed in solutions obtained by
diluting the needle washout of fine-needle aspiration
biopsies (steps V-VII in the magnification). Such
solutions contained Tg at different concentrations,
previously quantified using a standard
immunoenzymatic assay. Different independent
assays were performed with solution samples at
increasing Tg concentrations, observing a
remarkable correlation with the calibration curve
previously obtained (Figure 9, red dots) and with the
concentrations obtained by canonical Tg
quantification. In particular, a first set of human
samples was diluted at 1 ng/mL Tg (within the
linearly responsive range) and detection was
performed with different RT-LPG biosensors. As
shown in Figure 9, we obtained an average value for
the observable O of 0.225 corresponding to 1.45
ng/mL Tg, a value in very good agreement with the
expected concentration. An independent detection
assays were performed on human samples prepared
at 5 ng/mL Tg, obtaining average O values of 0.430,
corresponding to 4.5 ng/mL. Also in this case values
were in an overall satisfactory agreement with those
expected, confirming the linear dose-response within
the expected range and, most importantly, the
substantial lack of strong non-specific interactions
with other high concentration plasma proteins that
contaminate the washout samples. Finally, the
detection assays were performed on undiluted
samples, coming from different patient specimens,
having Tg concentrations higher than 3000 ng/mL.
The average O values obtained after Tg capture were
0.777, corresponding, as expected, to complete
biosensor saturation. We reported the values on the
plot of Figure 9 as red dots after the dashed line to
underline the substantial accordance between Tg
detection with LPG biosensors and canonical
immunoenzymatic techniques.
Such reference values clearly indicate that the
biosensor operates at best in a range of
concentrations matching that having a high clinical
relevance.
0 50 100 140
0
0.2
0.4
0.6
0.8
1
Tg Concentration [ng/mL]
Observable O [nm/nm]
h-Tg
fitting data
human sample
>>
Figure 9: Calibration curve for the semi-quantitative
detection of human Thyroglobulin using RT-LPG
biosensor and ex-vivo detection of human Thyroglobulin
from needle washout of fine-needle aspiration biopsy.
Blue dots refer to the dose-dependent assay performed to
obtain the calibration curve, while red dots refer to the ex-
vivo assay performed on human samples. The response is
roughly linear within the range 0 – 4 ng/mL.
In order to improve prognosis of differentiated
thyroid carcinomas, it is widely accepted that
confirmed or suspected cervical Lymph Nodes (LN)
metastases should be removed for local control.
However either preoperatively with ultrasonography
(US) or during the operation, it is difficult to
recognize small and occult LN metastases in the
central compartment (Chéreau et al., 2015).
Although it is widely accepted that differentiated
thyroid carcinoma recurrences after lymph node
dissection is unrelated to the number of LNs
removed (Albuja-Cruz et al., 2012), it is also well
established that removing occult LN metastasis
decreases the rate of recurrence in the neck (Roh et
High Sensitive Long Period Fiber Grating Biosensor for Cancer Biomarker Detection
567

al., 2011). The clinical application of real time Tg
detection will probably in a near future provide to
surgeons a powerful and reliable tool to precisely
identify metastatic lymph nodes.
5 CONCLUSIONS
We report an innovative fiber optic nano-optrode
based on LPGs working in reflection mode for real
time monitoring of human Thyroglobulin, a protein
marker of differentiated thyroid cancer.
The reflection-type LPG biosensor, coated with a
single layer of atactic polystyrene onto which a
specific, high affinity anti-Tg antibody was
adsorbed, allowed the real time and label-free
detection of Tg in the needle washouts of fine-
needle aspiration biopsies, at concentrations useful
for pre- and post-operative assessment of the
biomarker levels.
Analyte recognition and capture were confirmed
with a parallel on fiber ELISA-like assay using, in
pilot tests, the biotinylated protein and HRP-labeled
streptavidin for its detection. Dose-dependent
experiments showed that the detection is linearly
dependent on concentration within the range
between 0 and 4 ng/mL, while antibody saturation
occurs for higher protein levels. The system is
characterized by a very high sensitivity and
specificity, which reflects the specificity and affinity
of the antibody chosen as capturing bioreceptor.
Indeed, the biosensor allowed the ex-vivo detection
of sub ng/ml concentrations of human Tg from
needle washouts of fine-needle aspiration biopsies of
thyroid nodule from different patients.
Data here presented underline the high potential
of the proposed biosensing platform and the several
advantages of this kind of transducer: the absence of
labeling requirements represents in fact an attractive
alternative to traditional label-based techniques such
as fluorescence, colorimetry or radioactivity-based
approaches, without affecting the intrinsic affinity.
Furthermore, it appears particularly useful for
monitoring post-operative Tg levels, as the Tg
warning concentration (about 1 ng/mL) is well
within our linear response range (about 0 – 4
ng/mL). We foresee that, following a further
optimization and standardization of the detection
protocol, such an application is close at hand under
the current experimental settings. We also believe
that a further engineering of the detection platform
could allow the detection of Tg during biopsy
collection. However this would require suitable
needles and proper microfluidic and washing
devices for the removal of tissue debris and for
analyte dilution, a step strongly needed in light of
the very high sensitivity of the detection system.
Although the detection times are still in the hour
range, we do believe that the integration with a
microfluidic system will significantly reduce the
response time, making this method time saving, an
essential parameter for its application in the clinical
field. In addition a multiplexed configuration, with
the parallel detection of several biomarkers of
clinical interest, appears as a possible future target.
ACKNOWLEDGEMENTS
The authors gratefully acknowledge the financial
support from the national project “Smart Health
2.0”, funded by the Italian Ministry of Education,
University and Research (MIUR) under the PON
framework.
REFERENCES
Albuja-Cruz, M. B., Thorson, C. M., Allan. B. J., Lew. J.
I., Rodgers. 2012, Surgery, 152, 1177–1183.
Alwis, L., Sun, T., Grattan, K. T. V., 2013. Sens.
Actuators, B, 178, 694–699.
Baldini, F., Brenci, M., Chiavaioli, F., Giannetti,
A.,Trono, C., 2012. Anal. Bioanal. Chem. 402, 109–
116.
Cao, J., Tu, M. H., Sun, T., Grattan, K. T. V., 2013. Sens.
Actuators, B, 181, 611–619.
Chao, C. Y., Fung, W., Guo, L. J., 2006. IEEE J. Sel. Top.
Quantum Electron. 12, 134-142.
Chen, X., Zhou, K., Zhang, L., Bennion, I., 2007. Appl.
Opt. 46, 451–455.
Chéreau, N., Buffet, C., Trésallet, C., Tissier, F.,
Leenhardt, L., Menegaux, F. 2015. Surgery. 15, 704-
707.
Chiavaioli, F., Biswas, P., Trono, C., Bandyopadhyay, S.,
Giannetti, A., Tombelli, S., Basumallick, N.,
Dasgupta, K., Baldini, F., 2014. Biosens. Bioelectron.
60, 305–310.
Choi, S., Chae, J., 2009. Biosens. Bioelectron. 25, 118–
123.
Chryssis, A. N., Saini, S.S., Lee, S. M., H. Yi, Bentley,
W.E., Dagenais, M., 2005. IEEE J. Sel. Top. Quantum
Electron. 11, 864-872.
Chung, J. W., Bernhardt, R., Pyun, J. C., 2006. Sens.
Actuators B Chem. 118, 28-32.
Cusano A., Iadicicco, A., Pilla, P., Contessa, L.,
Campopiano, S., Cutolo, A., Giordano, M., 2006a.
Opt. Express, 14, 19–34.
Dantham, V. R., Holler, S., Barbre, C., Keng, D.,
Kolchenko, V., Arnold, S., 2013. Nano Lett. 13, 3347-
3351.
SmartMedDev 2016 - Special Session on Smart Medical Devices - From Lab to Clinical Practice
568

DeLisa, M. P., Zhang, Z., Shiloach, M., Pilevar, S., Davis,
C.C., Sirkis, J.S., Bentley, W.E., 2000. Anal. Chem.
72, 2895–900.
Del Villar, I., Matías, I. R., Arregui, F. J., Lalanne, P.,
2005. Opt. Express, 13, 56–69.
Eftimov, T., 2010. Applications of Fiber Gratings in
Chemical and Biochemical Sensing, in: Zourob, M.,
Lakhtakia, A. (Eds.), Optical Guided-wave Chemical
and Biosensors II, Springer Series on Chemical
Sensors and Biosensors 8, Springer Berlin,
Heidelberg, pp. 151–176.
Falate, R., Kamikawachi, R. C., Müller, M., Kalinowski,
H. J., Fabris, J. L., 2005. Sens. Actuators B Chem. 105,
430–436.
Falciai, R., Mignani, A.G., Vannini, A., 2001. Sens.
Actuators B Chem. 74, 74–77.
Fan, X., White, I. M., Shopova, S. I., Zhu, H., Suter, J. D.,
Sun, Y., 2008. Anal. Chim. Acta. 620, 8-26.
Garg, R., Tripathi, S. M., Thyagarajan, K., Bock, W. J.,
2013. Sens. Actuators, B, 176, 1121–1127.
Giovanella, L., Bongiovanni, M., Trimboli, P., 2013. Curr
Opin Oncol., 25: 6-13.
Hanumegowda, N.M., White, I.M., Oveys, H., Fan, X.,
2005. Sens. Lett. 3, 315-319.
Hoa, X. D., Kirk, A.G., Tabrizian, M., 2007. Biosens.
Bioelectron. 23, 15–160.
Huang, J., Lan, X., Kaur, A., Wang, H., Yuan, L., Xiao,
H., 2013. Optical Engeneering, 52, 014404.
James, S. W., Tatam, R. P., 2003. Meas. Sci. Technol. 14,
R49–R61.
Lee, M. R., Fauchet, P. M., 2007. Opt. Express 15, 4530-
4535.
Moon, J. H., Yong I. K., Lim, J. A., Choi, H. S., Cho, S.
W., Kim, K. W., Park, H. J., Paeng, J. C., Park, Y. J.,
Yi, K. H., Park, D. J., Kim, S. E.and .Chung, J. K.,
2013. J Clin Endocrinol Metab, 98, 1061-1068.
Pacini, F., Pinchera, A., 1999. Biochimie., 81:463-467.
Patrick, H. J., Kersey, A. D., Bucholtz, F., 1998. J.
Lightwave Technol. 16, 1606–1612.
Pilla, P., Manzillo, P., Malachovská, V., Buosciolo, A.,
Campopiano, S., Cutolo, A., Ambrosio, L., Giordano,
M., Cusano, A., 2009. Opt. Express, 17, 20039–20050.
Pilla, P., Malachovská, V., Borriello, A., Buosciolo, A.,
Giordano, M., Ambrosio, L., Cutolo, A., Cusano, A.,
2011. Opt. Express, 19, 512–526.
Pilla, P., Sandomenico, A., Malachovská, V., Borriello,
A., Giordano, M., Cutolo, A., Ruvo, M., Cusano, A.,
2012. Biosens. Bioelectron. 31, 486–491.
Quero, G., Consales, M., Vaiano, P., Cusano, A.,
Zuppolini, S., Diodato, L., Borriello, A., Giordano,
M., Venturelli, A., Costi, M. P., 2015. XVIII AISEM
Annual Conference.
Ramachandran, S., Wang, Z., Yan, M., 2002.
Opt. Lett.
27, 698–700.
Ren, H. C., Vollmer, F., Arnold, S., Libchaber, A., 2007.
Opt. Express 15, 17410-17423.
Roh, J. L., Kim, J. M., Park, C. I. 2011. Ann Surg Oncol,
18, 1312–1318.
Schneider, B. H., Edwards, J. G., Hartman, N. F., 1997.
Clin. Chem. 43, 1757-1563.
Skivesen, N., Tetu, A., Kristensen, M., Kjems J., Frandsen
L. H., Borel P. I, 2007. Opt. Express 15, 3169-3176.
Smietana, M., Koba, M., Brzozowska, E., Krogulski, K.,
Nakonieczny, J., Wachnicki, L., Mikulic, P.,
Godlewski, M., Bock, W. J., 2015. Opt. Express. 23,
8441–8453.
Spencer, C. A., Lopresti, J. S., 2008. Nature Clinical
Practice 4, 223–233.
Teramura, Y., Iwata, H., 2007. Anal. Biochem. 365, 201-
207.
Tripathi, S. M., Bock, W. J., Mikulic, P., Chinnappan, R.,
Ng, A., Tolba, M., Zourob, M., 2012. Biosens.
Bioelectron. 35, 308–312.
Website, http://www.neosensors.com.
Weir, H. K., Thompson, T. D., Soman, A., Moller, B.,
Leadbetter, S., 2015. Cancer, 121, 1827-1837.
Weisser, M., Tovar, G., Mittler-Neher, Knoll, S. W.,
Brosinger, F., Freimuth, H., Lacher, M., Ehrfeld, W.,
1999. Biosens. Bioelectron. 14, 405-411.
Yin, Y., Li, Z. Y., Zhong Z., Gates B., Venkateswaran S.,
2002. S. J. Mater. Chem. 12, 522−527.
Zhang, Y., Shibru, H., Cooper, K.L., Wang, A., 2005. Opt.
Lett. 30, 1021–1023.
High Sensitive Long Period Fiber Grating Biosensor for Cancer Biomarker Detection
569
