
Unsupervised Clustering on PMU Data for Event Characterization on
Smart Grid
Eric Klinginsmith, Richard Barella, Xinghui Zhao and Scott Wallace
School of Engineering and Computer Science, Washington State University Vancouver,
14204 NE Salmon Creek Ave., Vancouver, WA, 98686 U.S.A.
Keywords:
Smart Grid, Phasor Measurement Unit (PMU), Synchrophasors, Machine Learning, Clustering, Event
Characterization.
Abstract:
In the past decade, with the world-wide initiative of upgrading the electrical grid to smart grid, a significant
amount of data have been generated by the grid on a daily basis. Therefore, there has been an increasing
need in handling and processing these data efficiently. In this paper, we present our experience in applying
unsupervised clustering on PMU data for event characterization on the smart grid. We show that although the
PMU data are time series in nature, it is more efficient and robust to apply clustering methods on carefully
selected features from the data collected at certain instantaneous moments in time. These features are more
representative at the moments when the events have the most impact on the grid. Experiments have been
carried out on real PMU data collected by Bonneville Power Administration in their wide-area monitoring
system in the pacific northwest, and the results show that our instantaneous clustering method achieves high
homogeneity, which provides great potentials for identifying unknown events in the grid without substantial
training data.
1 INTRODUCTION
The emerging smart grid technology provides oppor-
tunities to implement a more reliable, intelligent, and
highly automated energy delivery network, harness-
ing the advances in communication and information
technologies. A key component in the smart grid is
the Phasor Measurement Unit (PMU), or synchropha-
sor, which measures phase angles and magnitudes of
the electrical waves in real time, at a high frequency,
ranging from 30 measurements per second to hun-
dreds of measurements per second. Data generated
by these devices contain valuable information about
the operation status of the power grid. A significant
amount of work has been done to detect or monitor
certain conditions of a power grid by leveraging in-
formation extracted from PMU data. Potential appli-
cations include fault detection (Liang et al., 2014), lo-
calization (Jiang et al., 2000), tracking (Chang et al.,
2008), and oscillation detection (Liu and Venkatasub-
ramanian, 2008). A comprehensive survey on vaious
applications using PMU data can be found in (Singh
et al., 2011).
Over the last 5 years, the PMU deployment has
been significantly increased in the U.S., from 200
PMUs in 2009 (North American Electric Reliabil-
ity Corporation, 2014) to approximately 1700 in
2014 (Americans for a Clean Energy Grid, 2014).
However, with the number of PMUs rapidly increas-
ing, the volume of the data generated by those PMUs
presents challenges for efficient processing. An in-
stallation of 100 PMUs produces data in the scale of
3-4TB per month, which will quickly become inac-
cessible for traditional workflow. A more automated
and efficient approach for data processing is essential,
in order to take advantage of the valuable information
in PMU data. The efficiency of the data processing
is even more critical for real-time monitoring of the
power grid.
Machine learning techniques provide potentials
for automated information extraction from large data
sources, and therefore become the most widely
used approach for address the big data challenge.
Among machine learning techniques, clustering (Bai-
ley, 1994) is an exploratory approach which can po-
tentially identify unknown signatures by grouping
data objects based on their similarities. In this paper,
we apply various clustering methods on PMU data
streams collected from a large power grid in pacific
northwest. The goal is to explore the applicability of
Klinginsmith, E., Barella, R., Zhao, X. and Wallace, S.
Unsupervised Clustering on PMU Data for Event Characterization on Smart Grid.
In Proceedings of the 5th International Conference on Smart Cities and Green ICT Systems (SMARTGREENS 2016), pages 233-240
ISBN: 978-989-758-184-7
Copyright
c
2016 by SCITEPRESS – Science and Technology Publications, Lda. All rights reserved
233

different clustering technique in identifying known or
unknown events which occur in the power grid.
The remainder of the paper is organized as fol-
lows. Section 2 reviews related work in applying ma-
chine learning techniques on PMU data. Section 3 in-
troduces the dataset we use in this research, as well as
the feature selection for the clustering method. Sec-
tion 4 presents our work in applying hierarchical clus-
tering on PMU time series, and the experimental re-
sults. Section 5 presents a different approach for clus-
tering instantaneous data, as well as experimental re-
sults. Section 6 concludes the paper and proposes fu-
ture directions for this work.
2 RELATED WORK
PMUs are widely used to monitor the operational sta-
tus of a power grid with the aim of enhancing the sit-
uation awareness for power system operators. A sig-
nificant amount of work has been done to detect or
monitor certain conditions of a power grid by lever-
aging information extracted from PMU data. Jiang et
al. propose an online approach for fault detection and
localization using SDFT (smart DFT) (Jiang et al.,
2000). Liu et al. use Frequency Domain Decompo-
sition for detecting oscillations (Liu and Venkatasub-
ramanian, 2008). Kazami et al. propose a multivari-
able regression model to track fault locations (Chang
et al., 2008). Besides voltage and current magnitudes,
which are the most commonly used features in detect-
ing faults, phase angle measurements can also be used
in detecting outages (Tate and Overbye, 2008).
Most recently, with the emergence of big data an-
alytics, new technologies are introduced to PMU data
storage and processing. Most importantly, a variety
of machine learning techniques have been applied to
analyze PMU data for the purpose of recognizing pat-
terns or signatures of events. Two widely adopted
techniques are classification and clustering.
Classification methods employ supervised learn-
ing and therefore, after training, can identify known
signatures or patterns. In (Nguyen et al., 2015),
Nguyen et al. develop a decision tree based on the
J48 algorithm, for the purpose of detecting line events
on the power grid using PMU data streams. Zhang
et al. propose a classification method for finding
fault locations based on pattern recognition (Zhang
et al., 2011). The key idea is to distinguish a class
from irrelevant data elements using linear discrimi-
nant analysis. The classification is carried out based
on two types of features: nodal voltage, and neg-
ative sequence voltage. Similar classification tech-
niques are used to detect voltage collapse (Diao et al.,
2009) and disturbances (Ray et al., 2014) in power
systems. Specifically, Diao et al. develop and train a
decision tree using PMU data to assess voltage secu-
rity (Diao et al., 2009). Ray et al. build Support Vec-
tor Machines and decision tree classifiers based on a
set of optimal features selected using a genetic algo-
rithm (Ray et al., 2014). Support Vector Machine-
based classifiers can also be used to identify fault lo-
cations (Salat and Osowski, 2004), and predict post-
fault transient stability (Gomez et al., 2011).
Although classification methods usually can pro-
vide high accuracy, they require a substantial amount
of labeled data for training. Unlike classification,
clustering methods with unsupervised learning do not
require labeled training data. Antoine et al. propose to
identify causes for inter-area oscillations by clustering
a number of parameters provided by PMUs, includ-
ing mode frequency, the voltage angle differences be-
tween areas and the mode shapes (Antoine and Maun,
2012). It has been shown that by clustering these pa-
rameters, changes in inter-area oscillations can be ex-
plained. Clustering methods have also been proven
to be effective in identifying different types of distur-
bances (Dahal et al., 2014).
In this paper, we investigate PMU data collected
from a wide-area monitoring system, extract useful
features, and evaluate different unsupervised cluster-
ing methods on PMU data for the purpose of events
characterization. To the best of our knowledge, this is
the first work which applies unsupervised clustering
methods to real PMU data for this characterizing line
events.
3 DATASET AND FEATURE
SELECTION
Our dataset was obtained from Bonneville Power Ad-
ministration (BPA), one of the first transmission oper-
ators to adopt synchrophasor technology. In this sec-
tion, we describe the dataset we use in this research,
as well as the features we extracted for the clustering
methods.
3.1 Dataset
At the time our data was collected, BPAs instal-
lation base contained 31 phasor measurement units
from across the pacific northwest. These PMUs mea-
sure line and/or bus voltage across all three phases.
They also record positive sequence voltage and cur-
rent phasors, frequency and rate-of-change of fre-
quency. At each PMU, the data is recorded at 60Hz.
Measurements from our dataset are primarily from
SMARTGREENS 2016 - 5th International Conference on Smart Cities and Green ICT Systems
234

(a) A Typical Single-Line-to-Ground Fault (b) A Typical Line-to-Line Fault
Figure 1: Typical Line Events on a Smart Grid.
500KV and 230KV buses, although a small number
of smaller voltage transmission lines are also covered.
Our dataset was collected from the period October 17,
2012 to September 16, 2013 and contains 114 docu-
mented faults that occur at a bus or on a transmission
line instrumented with at least one PMU. The faults
include instances of single-line-to-ground faults, line-
to-line faults, three-phase faults, in that order of rela-
tive frequency, and no-fault data. The data set used for
clustering contains 100 of the 114 documented fault
events and 19 no fault events, i.e., 119 events in to-
tal. Since not all events or locations on the electrical
grid have all the required data for calculating of the
features required for our clustering, those events and
locations were dropped. On average we gathered data
at 56 different locations on the electrical grid for each
of the 119 events, resulting in 6676 data points in to-
tal. Of the 6676 data points 4935 are Line to Ground
faults, 331 are Line to Line, 196 are Three Phase, and
1214 are marked as No Fault.
3.2 Feature Selection
In our dataset, the measurements recorded by the
PMUs are voltage magnitude and phase angle (pos-
itive sequence and A, B, C phases), current magni-
tude and phase angle (positive sequence only), and
frequency (60Hz). It has been shown in previous
work that the per-phase voltage magnitude is an ef-
fective measurement to identify different types of line
events (Liang et al., 2014).
Figure 1 shows the per-phase voltage magnitude
over time for two typical line events, single-line-to-
ground fault, and line-to-line fault. Note that the
voltage magnitude values are normalized based on
the steady state voltage. As shown in in Figure 1,
the voltage sags behave differently in different types
of events, which provides potentials for separating
events into different groups via clustering. This obser-
vation serves as the guideline for developing features
for our the clustering method.
To enable efficient clustering in a two dimension
space while retaining all the information contained
in the three phase voltage magnitudes, we devel-
oped two new features, RelativeP hase2over1, and
RelativeP hase3over1, by synthesizing the three
per-phase voltage values. These two features are
calculated in 3 steps. First, we calculate the rela-
tive phase deviations (RP) from steady state for three
phases, as shown in equation 1, 2, and 3.
(1)RP
a
= |1.0 −
v
a
ss
a
|
(2)RP
b
= |1.0 −
v
b
ss
b
|
(3)RP
c
= |1.0 −
v
c
ss
c
|
In the above equations, v values are per-phase
voltage magnitudes, ss values are steady state volt-
ages on the corresponding phases, and the values are
normalized based on the steady state voltages. We
then sort these relative phase deviations in ascending
order, resulting in a tuple, as shown in equation 4.
(4)[RP
3
, RP
2
, RP
1
] = sort([RP
a
, RP
b
, RP
c
])
Note that sorting the relative phase deviations sim-
plifies the complexity of our feature space. Although
by doing that we lose the information about deviations
on specific phases, the relative deviation magnitudes
among three phases are captured, which still enable
us to differentiate fault types.
In the last step, we use the values in the relative
phase deviation tuple to calculate the two new fea-
tures, as shown in equation 5, and 6.
(5)RelativeP hase2over1 =
RP
2
RP
1
(6)RelativeP hase3over1 =
RP
3
RP
1
Unsupervised Clustering on PMU Data for Event Characterization on Smart Grid
235
These two features retain the information con-
tained in the three per-phase voltage values, yet pro-
vide a simplified two dimensional space for the clus-
tering methods. In addition, by normalizing the mag-
nitudes based on the steady state voltages, we elim-
inate the bias introduced by the absolute magnitude
deviations, so that the characteristics, or patterns of
different events can be better captured by the cluster-
ing methods.
4 TIME SERIES CLUSTERING
Given the fact that PMU data are time series data
in nature, we have applied the time series clustering
method (Liao, 2005) to our dataset. The technical
details and experimental results are described in this
section.
4.1 Data Processing and Distance
Metric
Time series clustering takes data on a window of time
as one data entry. For our case, one data entry is a
time window of data collected by one PMU. This ap-
proach provides an opportunity for clustering based
on the shape of the event over time, instead of a sin-
gle data point. However, events with longer duration
present challenges in data handling. To simplify the
data processing without losing the advantages of time
series clustering, we have applied the widely used
Piecewise Aggregate Approximation (PAA) (Keogh
and Pazzani, 2000) to reduce the number of points in
each time window. Specifically, each data window is
divided into n time slices. Then, the mean of each
time slice is calculated. These mean values are used
to replace of the actual data collected during the cor-
responding time slices.
Another challenge in time series clustering is to
define a meaningful similarity metric of two data en-
tries. One basic method is to calculate the euclidean
distance between the two time series. However, this
method can be inaccurate, as the same event can ap-
pear at different sites where one site sees the fault a
few cycles after the other, which results in the time
series on two sites out of sync. Therefore, it is criti-
cal to use a method that can take slight offsets in time
into account. To this end, we utilize Dynamic Time
Warping (DTW) (Keogh and Pazzani, 2000), a well
researched solution to this problem. DTW aligns the
sequences by locally stretching and shrinking one se-
quence to obtain the optimal fit to the other sequence
and then calculates their relative distance given the
optimal alignment. This causes the time series to be
compared in a non-linear fashion instead of in lock-
step.
4.2 Clustering Results
For clustering, we chose the hierarchical clustering al-
gorithm (Rokach and Maimon, 2005), because it is
the most suitable method for the time series model,
and it allows customized distance metric, for which
we used the DTW distance metric described above.
In order to apply the hierarchical clustering
method to our data, we need to transform each event
into time series data with a fixed window size. Since
most of the line events in our dataset last approxi-
mately 6 cycles (1/10th of a second), we choose a
window size of 10, which gives us extra space to
capture steady state data before and after the event.
Specifically, we process each event as follows. First,
for each event which lasts less than 8 cycles, we
add steady state data to both sides until the dura-
tion is greater or equal to 8. Second, we perform
PAA (Keogh and Pazzani, 2000) with a window size
of 8 to each event, so that the data is divided into 8
slices, or time steps. Third, we add a steady state data
point to each side of the event, forming a time series
data with a fixed size 10.
After obtaining the 10 time steps for each event,
we calculate the features described in Section 3.2 for
each time step. Finally we apply the hierarchical clus-
tering method on these data points. Due to the limited
space of the paper, we only present the result time step
5. We chose time step 5 because it is located in the
middle of the event window, and carries the most rep-
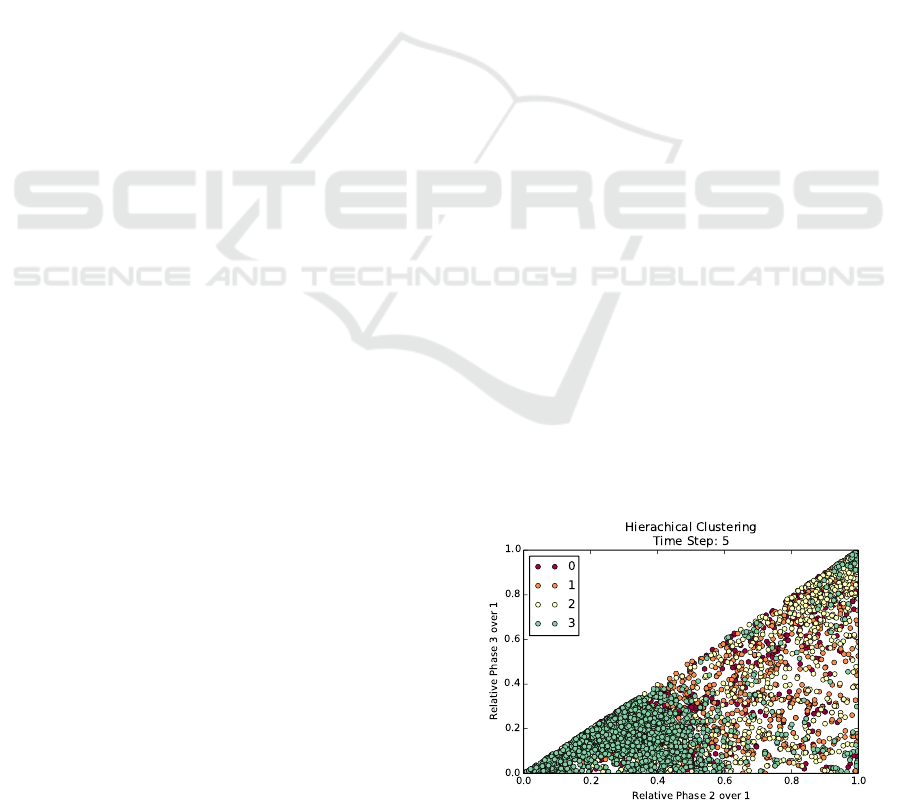
resentative features of the event. The clustering result
for this time step is shown in Figure 2. Different col-
ors represent different groups of data entries. To as-
sociate the groups generated by the clustering method
with the event types in our dataset, we have calculated
the percentage breakdown of each event type in the 4
groups, and the results are shown in Table 1.
Figure 2: Hierachical Clustering at Time Step 5.
SMARTGREENS 2016 - 5th International Conference on Smart Cities and Green ICT Systems
236

Table 1: Time Series Hierarchical Clustering % Break-
down.
LG LL TP NF
0 14.08% 9.37% 44.39% 28.25%
1 14.23% 29.00% 11.23% 29.41%
2 18.70% 38.37% 35.71% 40.94%
3 52.99% 23.26% 8.67% 1.40%
As shown in the results, half of the single-line-
to-ground (LG) events are clustered in group 3 while
the rest are split among the other three groups. Ma-
jority of the Line-to-line (LL) events are split among
three groups 1, 2, and 3. Majority of the three-phase
(TP) events are split among groups 0 and 2. Finally,
most of the no-fault (NF) data entries are split be-
tween groups 0, 1, and 2. Overall, hierarchical clus-
tering on PMU time series data does not work well,
which can be reflected by the low homogeneity score
of 0.156. Note that the homogeneity score (Rosen-
berg and Hirschberg, 2007) is a metric indicating how
well data points which belong to the same class are as-
signed to the same cluster. A perfectly homogeneous
solution has a homogeneity score of 1.
Since it has been shown that the combined volt-
age deviations, as illustrated in equation 7, is an effec-
tive metric for representing the impact of the event on
the PMU site (Liang et al., 2014). A greater value of
∆V represents higher impact of an event on a PMU.
In order to remove the events which occur at loca-
tions that are far away from the PMUs, we filtered our
dataset by removing all the data entries with ∆V val-
ues less than 0.018, a threshold suggested in (Liang
et al., 2014). After this filtering process, our dataset
contains 2211 data points. That is to say, 4462 data
points are filtered out. These data points are signals
captured by PMUs which are far away from the loca-
tion where the event occurred.
∆V =
p
(v
a
− ss
a
)
2
+ (v
b
− ss
b
)
2
+ (v
c
− ss
c
)
2
3
(7)
We then carried out the hierarchical clustering on
the filtered dataset, and the results are shown in Fig-
ure 3 and Table 2.
Table 2: Time Series with ∆V filter Hierarchical Clustering
% Breakdown.
LG LL TP NF
0 15.24% 44.36% 0.00% 0.00%
1 19.52% 21.77% 31.43% 0.00%
2 27.80% 15.32% 58.10% 33.33%
3 37.44% 18.55% 10.47% 66.67%
The results of the hierarchical clustering on fil-
tered dataset are similar to those on the original
Figure 3: Hierarchical Clustering on Filtered Data at Time
Step 5.
dataset, with an even lower homogeneity score of
0.027. This indicates that although PMU data are time
series, it is challenging to apply clustering methods on
these time series.
5 INSTANTANEOUS
CLUSTERING
Besides time series clustering, an alternative solution
is to represent each event using one single data point
at an instantaneous moment in time, and apply clus-
tering methods on these data points. In this section,
we describe our work in this direction.
5.1 Data Processing
In order to apply instantaneous clustering methods to
our data, we first need to choose a data point to rep-
resent each event. As shown in the typical line events
in Figure 1, the best candidate is the moment when
the maximum voltage deviation is reached. However,
even though a given site may have a minimum at a
given cycle, that does not guarantee that another site’s
minimum is located at the same cycle. Instead of
choosing one site to represent all sites we developed
a better method that takes all sites into account. In
our method all sites vote on what cycle they say is
the minimum cycle of a given fault. The cycle with
the most votes from the sites is the one that is cho-
sen. This method allows us to get the point in time
where we see the largest deviation for the most sites.
Note that in order to take into consideration all three
phases, we use the metric ∆V shown in equation 7
in the voting process. In other words, for each event,
the cycle during which the largest number of sites ob-
serve their greatest ∆V value is chosen to represent
that event across the grid. We then apply instanta-
neous clustering methods on these data points.
Unsupervised Clustering on PMU Data for Event Characterization on Smart Grid
237
5.2 Clustering Results
For instantaneous clustering, we choose two widely
used methods, k-means (Wagstaff et al., 2001) and
DBSCAN (Density Based Spatial Clustering of Ap-
plications with Noise) (Ester et al., 1996) to perform
the clustering on our data points described above,
based on the two features presented in Section 3.2.
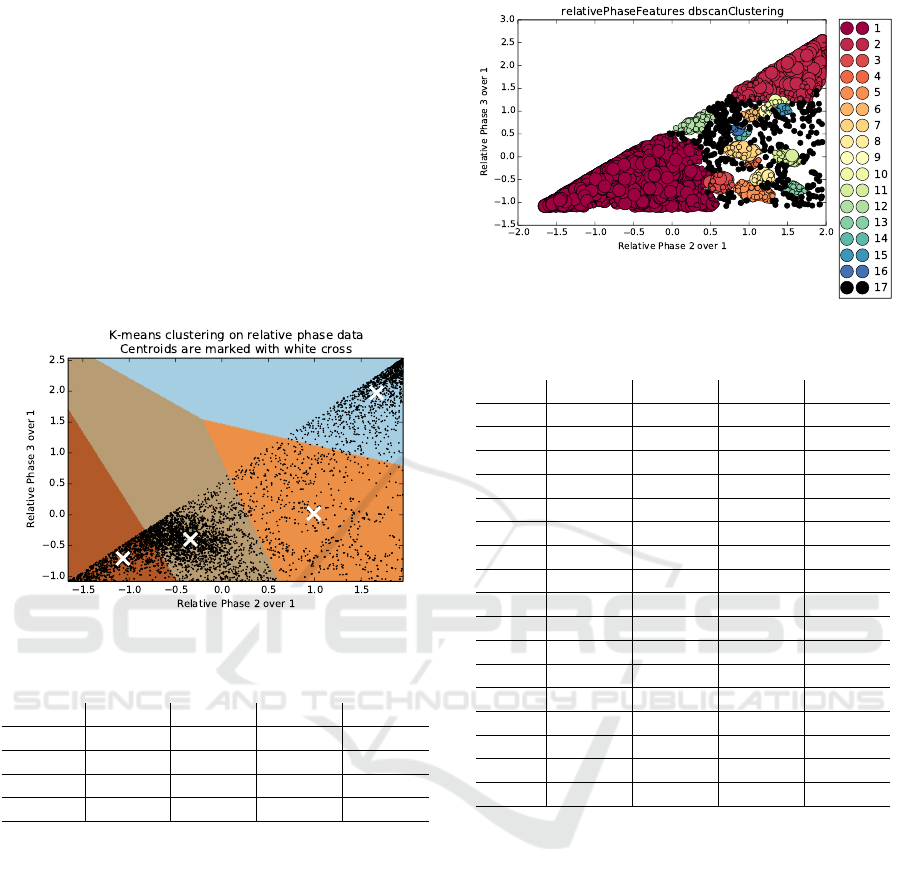
The results of the k-means clustering are shown in
Figure 4. The data points are divided into 4 different
groups, each of which is represented by a different
color. The percentage breakdown for different even
types are shown in table 3.
Figure 4: K-menas Clustering on Instantaneous Data.
Table 3: K-menas Clustering % Breakdown.
LG LL TP NF
Blue 1.72% 0.60% 98.98% 74.79%
Gray 64.84% 7.86% 0.00% 4.53%
Orange 3.49% 91.54% 1.02% 20.02%
Brown 29.95% 0.00% 0.00% 0.66%
In general, k-means clustering performs well in
separating different events into groups. Particularly,
three-phase (TP) events are well isolated from the rest
event types. However, some single-line-to-ground
(LG) events are mixed with line-to-line (LL) events,
and the no-fault (NF) data points are separated into
two main groups. Note that the over all homogene-
ity score of k-means clustering on the instantaneous
PMU data is 0.60, showing a major improvement over
the hierarchical clustering on time series data.
We then applied the density-based DBSCAN clus-
tering method on the same dataset, and the results are
shown in Figure 5 and Table 4.
When using DBSCAN the user does not provide
the number of clusters. Instead the algorithm breaks
down the data into as many clusters as it sees fit. On
top of this it also adds an additional cluster for what
DBSCAN has determined to be noise in the data. In
Figure 5: Relative Phase Features.
Table 4: DBSCAN clustering % breakdown.
LG LL TP NF
1 95.16% 8.16% 0.00% 5.93%
2 1.62% 0.60% 98.98% 69.44%
3 0.55% 3.32% 0.00% 0.66%
4 0.00% 4.23% 0.00% 0.08%
5 0.04% 15.11% 0.00% 0.41%
6 0.10% 0.00% 0.00% 1.40%
7 0.16% 8.46% 0.00% 0.66%
8 0.04% 6.65% 0.00% 0.00%
9 0.00% 0.00% 0.00% 0.74%
10 0.04% 0.00% 0.00% 1.32%
11 0.00% 9.67% 0.00% 0.16%
12 0.63% 0.00% 0.00% 1.48%
13 0.00% 5.74% 0.00% 0.00%
14 0.06% 0.00% 0.00% 0.91%
15 0.02% 0.00% 0.00% 0.91%
16 0.10% 0.00% 0.00% 0.33%
Noise 1.48% 38.07% 1.02% 15.57%
this case DBSCAN divided the data into 16 groups.
Despite the large number of groups, DBSCAN per-
forms well in dividing LG and TP from the other
two type of events. However, instead of grouping LL
into a single cluster, DBSCAN has divided it into 7
groups. Also, most of the LL data are identified as
noise. Most of the No Fault data points are grouped in
the same cluster as TP, but a good portion of it is also
marked as noise. This clustering has a homogeneity
of 0.628.
We observed that there is quite a bit of data be-
ing labeled as noise. If we could reduce the amount
of noise, then that could help DBSCAN preform bet-
ter. In addition, reducing the amount of noise could
help separate no fault data from TP. With most faults
a higher ∆V signifies that signal is closer to the loca-
tion of the fault.
Therefore, we execute the two instantaneous clus-
SMARTGREENS 2016 - 5th International Conference on Smart Cities and Green ICT Systems
238
tering method on the filtered dataset which con-
tains only data points with ∆V values greater than
0.018.The clustering results of k-means are shown in
Figure 6 and Table 5.
Figure 6: K-means Clutering on Filtered Instantaneous
Data.
Table 5: Filtered K-means Clustering % Breakdown.
LG LL TP NF
Blue 37.18% 0.00% 0.00% 0.00%
Gray 0.56% 0.81% 100% 100%
Orange 62.21% 0.00% 0.00% 0.00%
Brown 0.05% 99.19% 0.00% 0.00%
The results here show some improvements over
those on the non-filtered data, although LG is still
split between two clusters. LL is predominately in
one cluster. Interestingly, all of TP is in a single clus-
ter with all NF data points. This is because that af-
ter the ∆V filtering, only a small number of NF data
points are left in the dataset. The homogeneity score
of this method is 0.932, much higher than the results
on the non-filtered dataset.
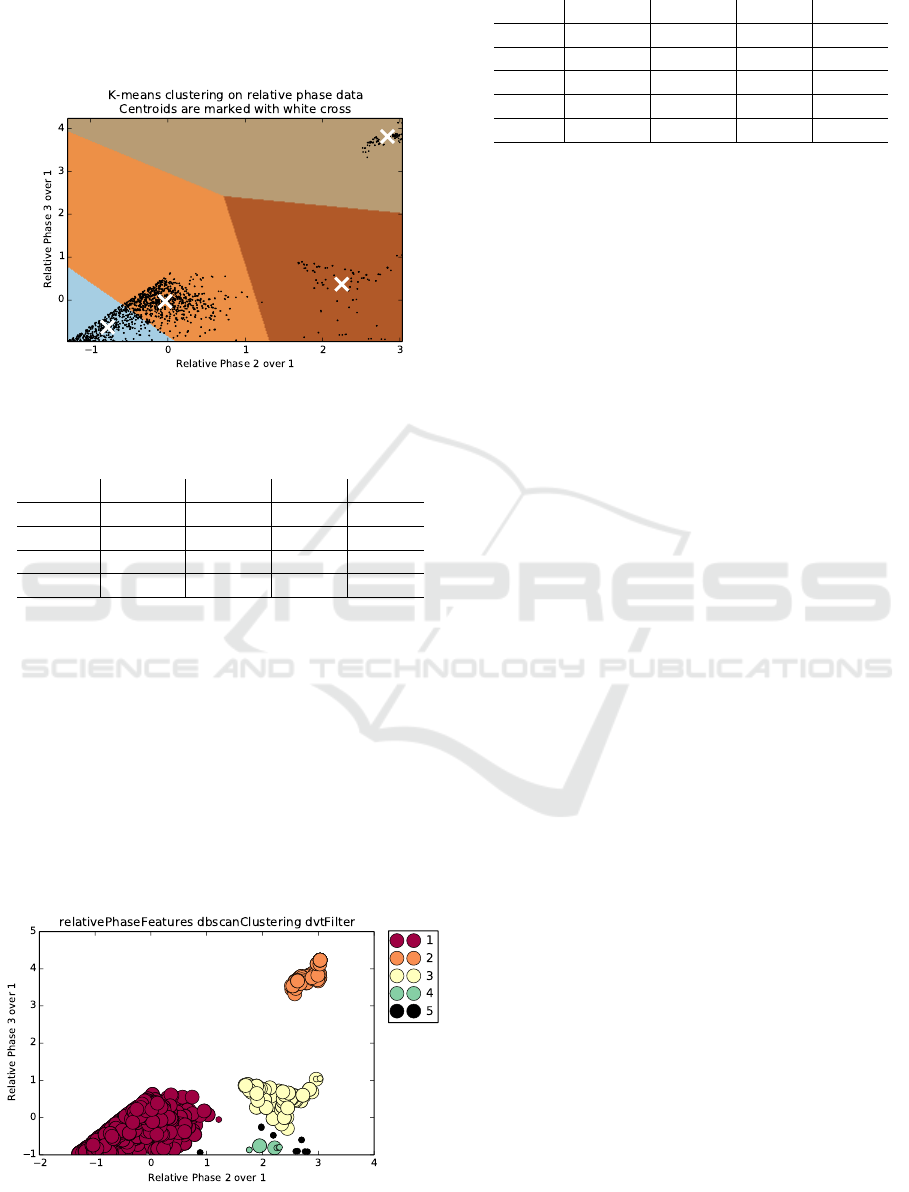
On the same filtered dataset, we have also applied
the DBSCAN clustering method, and the results are
shown in Figure 7 and Table 6.
Figure 7: Relative Phase Features.
Table 6: Filtered DBSCAN clustering % breakdown.
LG LL TP NF
1 99.34% 0.00% 0.00% 0.00%
2 0.56% 0.81% 100% 100%
3 0.00% 84.68% 0.00% 0.00%
4 0.00% 6.45% 0.00% 0.00%
Noise 0.10% 8.06% 0.00% 0.00%
Comparing to the results on the original dataset,
this set of results show significant improvement, be-
cause the filtering help remove most of the noise.
With the filter DBSCAN preformed excellently well,
illustrated by its homogeneity score of 0.933. It was
able to cluster most of LG in cluster 1, LL in cluster
3 and 4, and all of TP in cluster 2. Similar to the k-
means method, No Fault data are mixed with TP in
cluster 2, because of the limited number of data sam-
ples after the filtering.
6 CONCLUSION
Synchrophasor technology is widely used in modern
power systems, resulting in increasing amounts of
data being generated on a daily basis. Machine learn-
ing methods represent the future directions in process-
ing these data. Although supervised learning methods
have been applied for this purpose, in order to prepare
the training datasets for those methods, labeling data
requires a significant amount of effort.
In this paper, we present our experience in ap-
plying unsupervised clustering methods on PMU data
collected on a smart grid. We have evaluated mul-
tiple clustering methods on two distinct representa-
tions of PMU data: time series and instantaneous data
points. Specifically, hierarchical clustering method
is used to cluster time series data, and both k-means
and DBSCAN are used to cluter instantaneous data
points. Interestingly, although PMU data are time se-
ries data in nature, our results show that clustering
on instantaneous data points with carefully selected
features performs much better in terms of homogene-
ity score. Among all the clustering methods we have
evaluated, DBSCAN achieves the highest homogene-
ity score. This work demonstrates potentials of iden-
tifying unknown events on a smart grid without sub-
stantial training data. For future work, we will apply
the clustering methods on a dataset which contains
unknown events, namely generator faults, for the pur-
pose of characterizing new events. In addition, we
will develop type-specific classification methods on
different clusters to better classify events.
Unsupervised Clustering on PMU Data for Event Characterization on Smart Grid
239

ACKNOWLEDGMENTS
The authors would like to thank the Department of
Energy / Bonneville Power Administration for their
generous support through the Technology Innovation
Program (TIP# 319) and for providing the PMU data
used in this study.
REFERENCES
Americans for a Clean Energy Grid (2014). Syn-
chrophasors. http://cleanenergytransmission.org/wp-
content/uploads/2014/08/Synchrophasors.pdf. Ac-
cessed: 2015-09-08.
Antoine, O. and Maun, J.-C. (2012). Inter-area oscillations:
Identifying causes of poor damping using phasor mea-
surement units. In Power and Energy Society General
Meeting, 2012 IEEE, pages 1–6. IEEE.
Bailey, K. (1994). Numerical taxonomy and cluster analy-
sis. Typologies and Taxonomies.
Chang, G., Chao, J.-P., Huang, H.-M., Chen, C.-I., and
Chu, S.-Y. (2008). On tracking the source location
of voltage sags and utility shunt capacitor switching
transients. IEEE Transactions on Power Delivery,
23(4):2124–2131.
Dahal, O. P., Brahma, S. M., and Cao, H. (2014). Com-
prehensive clustering of disturbance events recorded
by phasor measurement units. IEEE Transactions on
Power Delivery, 29(3):1390–1397.
Diao, R., Sun, K., Vittal, V., O’Keefe, R., Richardson, M.,
Bhatt, N., Stradford, D., and Sarawgi, S. (2009). Deci-
sion tree-based online voltage security assessment us-
ing pmu measurements. IEEE Transactions on Power
Systems, 24(2):832–839.
Ester, M., Kriegel, H.-P., Sander, J., and Xu, X. (1996).
A density-based algorithm for discovering clusters in
large spatial databases with noise. In KDD, vol-
ume 96, pages 226–231.
Gomez, F. R., Rajapakse, A. D., Annakkage, U. D., and Fer-
nando, I. T. (2011). Support vector machine-based al-
gorithm for post-fault transient stability status predic-
tion using synchronized measurements. IEEE Trans-
actions on Power Systems, 26(3):1474–1483.
Jiang, J.-A., Yang, J.-Z., Lin, Y.-H., Liu, C.-W., and Ma,
J.-C. (2000). An adaptive pmu based fault detec-
tion/location technique for transmission lines. i. the-
ory and algorithms. IEEE Transactions on Power De-
livery, 15(2):486–493.
Keogh, E. J. and Pazzani, M. J. (2000). Scaling up dy-
namic time warping for datamining applications. In
Proceedings of the 6th ACM SIGKDD International
Conference on Knowledge Discovery and Data Min-
ing, pages 285–289. ACM.
Liang, X., Wallace, S., and Zhao, X. (2014). A technique
for detecting wide-area single-line-to-ground faults.
In Proceedings of the 2nd IEEE Conference on Tech-
nologies for Sustainability (SusTech 2014), SusTech
’14, pages 1–4. IEEE.
Liao, T. W. (2005). Clustering of time series dataa survey.
Pattern recognition, 38(11):1857–1874.
Liu, G. and Venkatasubramanian, V. (2008). Oscillation
monitoring from ambient pmu measurements by fre-
quency domain decomposition. In IEEE International
Symposium on Circuits and Systems (ISCAS 2008),
pages 2821–2824.
Nguyen, D., Barella, R., Wallace, S., Zhao, X., and Liang,
X. (2015). Smart grid line event classification using
supervised learning over pmu data streams. In Proc-
cedings of the 6th IEEE International Green and Sus-
tainable Computing Conference.
North American Electric Reliability Corporation
(2014). Real-Time Application of Synchro pha-
sors for Improving Reliability. http://www.nerc.
com/docs/oc/rapirtf/RAPIR%20final%20101710.pdf.
Accessed: 2015-09-08.
Ray, P. K., Mohanty, S. R., Kishor, N., and Catal
˜
ao, J. P.
(2014). Optimal feature and decision tree-based clas-
sification of power quality disturbances in distributed
generation systems. IEEE Transactions on Sustain-
able Energy, 5(1):200–208.
Rokach, L. and Maimon, O. (2005). Clustering methods.
In Data mining and knowledge discovery handbook,
pages 321–352. Springer.
Rosenberg, A. and Hirschberg, J. (2007). V-measure: A
conditional entropy-based external cluster evaluation
measure. In EMNLP-CoNLL, volume 7, pages 410–
420.
Salat, R. and Osowski, S. (2004). Accurate fault location
in the power transmission line using support vector
machine approach. IEEE Transactions on Power Sys-
tems, 19(2):979–986.
Singh, B., Sharma, N., Tiwari, A., Verma, K., and Singh,
S. (2011). Applications of phasor measurement units
(pmus) in electric power system networks incorpo-
rated with facts controllers. International Journal of
Engineering, Science and Technology, 3(3).
Tate, J. E. and Overbye, T. J. (2008). Line outage detection
using phasor angle measurements. IEEE Transactions
on Power Systems, 23(4):1644–1652.
Wagstaff, K., Cardie, C., Rogers, S., Schr
¨
odl, S., et al.
(2001). Constrained k-means clustering with back-
ground knowledge. In ICML, volume 1, pages 577–
584.
Zhang, Y.-G., Wang, Z.-P., Zhang, J.-F., and Ma, J. (2011).
Fault localization in electrical power systems: A pat-
tern recognition approach. International Journal of
Electrical Power & Energy Systems, 33(3):791–798.
SMARTGREENS 2016 - 5th International Conference on Smart Cities and Green ICT Systems
240
