
Automated Segmentation of the Walkable Area from Aerial Images for
Evacuation Simulation
Fabian Schenk, Matthias R
¨
uther and Horst Bischof
Institute for Computer Graphics and Vision, Graz University of Technology, Graz, Austria
Keywords:
Aerial Images, Walkable Area, Seeded Region Growing, Evacuation Maps, Accessibility.
Abstract:
Computer-aided evacuation simulation is a very import preliminary step when planning safety measures for
major public events. We propose a novel, efficient and fast method to extract the walkable area from high-
resolution aerial images for the purpose of evacuation simulation. In contrast to previous work, where the
authors only extracted streets and roads or worked on indoor scenarios, we present an approach to accurately
segment the walkable area of large outdoor areas. For this task we use a sophisticated seeded region growing
(SRG) algorithm incorporating the information of digital surface models, true-orthophotos and inclination
maps calculated from aerial images. Further, we introduce a new annotation and evaluation scheme especially
designed for assessing the segmentation quality of evacuation maps. An extensive qualitative and quantitative
evaluation, where we study various combinations of SRG methods and parameter settings by the example of
different real-world scenarios, shows the feasibility of our approach.
1 INTRODUCTION
Millions of people visit sports competitions, concerts
and religious celebrations every year and with the ever
growing population the number is not likely to de-
crease. There is a large variety of possible emergen-
cies (natural disasters, fire, terrorist attacks, bomb-
ings) with most of them requiring a full or partial
evacuation of the event area. Adequate safety mea-
sures are required to prevent crowd disasters like the
ones at the Love Parade 2010 (Duisburg, Germany)
(Krausz and Bauckhage, 2012) and the Water Festi-
val 2010 (Phnom Penh, Cambodia) (Hsu and Burkle,
2012).
To assure the safety of events, evacuation simula-
tion is an important preliminary step in the planning
stage, but is normally a tedious and time-consuming
task due to the complex layout of large event sites.
For computer-aided evacuation simulation and
planning for outdoor events, digital maps are re-
quired. A computer can then perform a wide vari-
ety of simulations on the given topology using differ-
ent hazards, escape routes and human properties like
walking speed or age.
The technology for recording aerial images has
been around for some time, but in recent years high-
resolution cameras have improved the accuracy sig-
nificantly and small unmanned aerial vehicles (UAV)
can perform on-demand recordings of certain areas.
In previous work on outdoor evacuation simulations,
(Taubenb
¨
ock et al., 2009; L
¨
ammel et al., 2010) only
extracted streets and roads, but did not achieve very
high accuracy. It is not enough to simply segment
a certain height level, roads or just flat areas because
humans can walk on different surfaces (slopes, stairs).
If measurements are wrong or blocking structures are
missing in the digital map, a simulation cannot be per-
formed accurately. To our knowledge, we are first to
address the difficult challenge of automatically seg-
menting the walkable area (WA) of large outdoor ar-
eas. This is a complex segmentation problem com-
prising the following challenges:
• Getting measurements correctly into the map
• Providing accurate contours for buildings and
blocking structures (walls, food stands, tents,...)
• Segmenting potential emergency exits (roads,...)
In this work, we present a novel, efficient and easy-to-
use approach to generate highly accurate digital maps
of the WA from high-resolution aerial images. Our
approach generalizes very well to various scenarios
and cities and by adapting the parameters for slopes
and stairs we can also incorporate the special needs
of handicapped people (wheelchair users, elderly per-
sons). These maps can then be used for evacuation
planning and simulation (see Fig. 1). Further, we in-
Schenk, F., Rüther, M. and Bischof, H.
Automated Segmentation of the Walkable Area from Aerial Images for Evacuation Simulation.
In Proceedings of the 2nd International Conference on Geographical Information Systems Theory, Applications and Management (GISTAM 2016), pages 125-135
ISBN: 978-989-758-188-5
Copyright
c
2016 by SCITEPRESS – Science and Technology Publications, Lda. All rights reserved
125
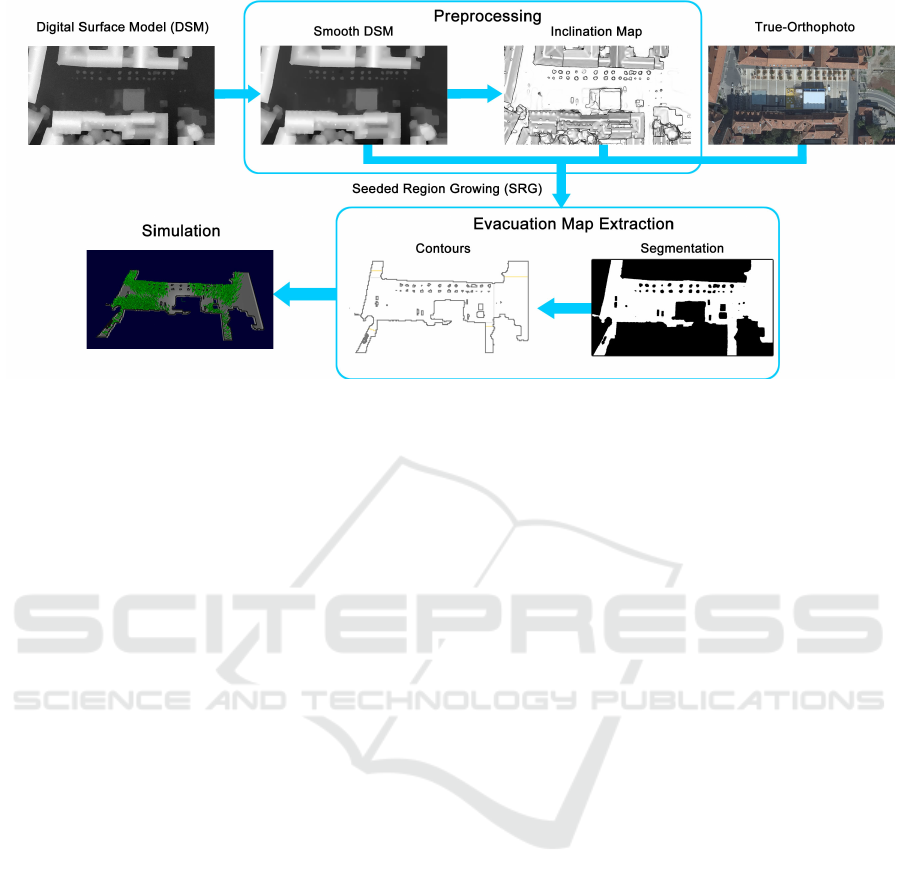
Figure 1: We use a sophisticated seeded region growing (SRG) algorithm to segment the walkable area (WA) incorporating
information from the DSM, true-orthophoto and orientation map. From this segmentation, the contours can be extracted and
used in most common evacuation simulation programs.
troduce a new annotation scheme to assess the quality
of the extracted maps with regard to evacuation simu-
lation. Additionally, aerial images give us the oppor-
tunity to acquire data shortly before the actual event
and to include structures like stages, food stands and
tents into our map. To our knowledge, we are the first
to address the difficult challenge of getting an accu-
rate digital map of the WA for evacuation planning
in outdoor environments using high-resolution aerial
images.
The paper is organized as follows. Section 2 de-
scribes related work on evacuation simulation and
street segmentation and its limitations. In Section 3,
we describe the input data, the necessary preprocess-
ing steps and finally our method to segment the WA.
An exhaustive qualitative and quantitative evaluation
of our different SRG algorithms and important param-
eters is shown in Section 4. Section 5 concludes the
paper and gives some ideas about future work on this
topic. In the Appendix, we will show an evacuation
simulation using our extracted digital maps.
2 RELATED WORK
Evacuation simulation is an active research area
and many different software tools have been devel-
oped, which can be classified as microscopic (Galea,
2002; Kl
¨
upfel, 2006; Tsai et al., 2011) and macro-
scopic (Schneider and K
¨
onnecke, 2001). All tools
require a digital map for evacuation simulation and
most of them support CAD (computer-aided drafting)
models. Previous work can be divided into indoor and
outdoor scenarios.
Indoor Scenarios. For these scenarios usually
CAD and sometimes even 3D models are provided
by architects and they have been extensively studied
in recent years. (Johnson, 2008) performed an evacu-
ation simulation to improve security and safety of the
2012 Olympic venues, while (Shi et al., 2012) studied
different evacuation scenarios for the very crowded
metro stations in Tokyo, Japan. An indoor fire simula-
tion model was presented in (Tang and Ren, 2012) and
(Tsai et al., 2011) evaluated the evacuation strategies
for the International Terminal at Los Angeles Airport.
Outdoor Scenarios. The investigation of evac-
uation strategies for tsunami incidents is an impor-
tant research field. In this context, (Mas et al., 2013)
proposed an evacuation model with a tsunami sim-
ulation for casualty estimation for the urban area of
La Punta, Peru. Evacuation analysis at city-scale
by the example of Padang, Indonesia for the case
of a tsunami incident was performed in (Taubenb
¨
ock
et al., 2009; L
¨
ammel et al., 2010). They achieved
building level accuracy, by extracting semantic labels
from four band satellite images.With their city-wide
analysis they do not achieve very high accuracy and
for planning public events only small areas of a city
like squares or parks are of particular interest.
Road and street segmentation from aerial images
acquired by satellites or UAVs is also a well re-
searched topic (Hu et al., 2007; Zhou et al., 2015;
Dal Poz et al., 2012; Lin and Saripalli, 2012). Even
though these approaches give us an idea of the WA,
humans can access more than just roads and streets
and for evacuation planning a more sophisticated
GISTAM 2016 - 2nd International Conference on Geographical Information Systems Theory, Applications and Management
126

segmentation is needed. OpenStreetMap provides
geospatial data for certain urban areas, but it is very
not accurate, often outdated and does not include the
special layout of major events.
Land-use classification from aerial images has
been presented in (Cheriyadat, 2014; Huth et al.,
2012), while (Han et al., 2015) try to find objects and
their respective bounding boxes. These methods are
well suited for land-use study of whole cities or even
larger regions but lack the necessary accuracy for WA
analysis, where the contours of blocking structures
like buildings are essential. Further, due to the lim-
ited number of labels, unknown classes are regularly
un- or misclassified in the final result, e.g. cars as
streets, bushes or small trees as grass or field.
(Kl
¨
upfel, 2006) performed crowd simulations for
large outdoor events by the examples of the World
Youth Day 2005 in Cologne and an egress (non-
emergency) from a football stadium but mainly fo-
cused on evacuation details (reaction time, walking
speed).
3 EVACUATION MAP
EXTRACTION
The main challenge is to get an accurate digital map of
the WA from high-resolution aerial images (see Fig.
1). From these images we can calculate the corre-
sponding digital surface models (DSMs) and then we
use edge-preserving smoothing to facilitate the subse-
quent calculation of the inclination map (see Section
3.1).
One downside of the very high resolution is the
large amount of data and processing a whole city can
take from hours to days, depending on the available
computational power. Thus, we perform our segmen-
tation in a region of interest (ROI). Within this ROI
the user then has to choose a point manually. Start-
ing from this point a seeded region growing (SRG)
(Adams and Bischof, 1994) algorithm segments the
WA (see Section 3.2). The result is a binary segmen-
tation of the WA, which can be exported to most com-
mon evacuation simulation program (see Section 3.3).
3.1 Aerial Image Input Data and
Preprocessing
The acquisition of the aerial images and calculation
of the DSMs and true-orthophotos are not part of our
approach but will be briefly explained. Aerial im-
ages are typically recorded with three (RGB) or four
channels (+ near infrared) by UAVs like drones or
smaller airplanes because of the higher spatial reso-
lution compared to satellites. UAVs follow a certain
pattern when taking images of an area to get mul-
tiple, overlapping views of all the structures. Then
the high-resolution aerial images are used for aerial
triangulation, which is also known as Structure for
Motion, to get accurate photo alignments from im-
age measurements only (Irschara et al., 2012). Match-
ing points between the recorded images are calculated
using Scale Invariant Feature Transform (SIFT) with
Lowe distance ratio (Lowe, 2004) and then used in a
sparse bundle adjustment (Triggs et al., 2000) to esti-
mate all camera poses.
A dense height map for each image is estimated
with a multi-view reconstruction approach similar to
the one presented in (Rumpler et al., 2013; Irschara
et al., 2012). The basic idea is that the actual height
value of a pixel can be found by comparing two over-
lapping images from different views. A plane sweep
approach (Collins, 1996) then shifts one image in a
certain direction, while the other one stays fixed and
calculates a matching cost between these two, result-
ing in a 3D cost volume. In (Rumpler et al., 2013),
they use a winner-takes-all method on the cost vol-
ume and always choose the cheapest matching cost
for each pixel as the correct height. Alternatively, an
optimizer on the cost volume followed by multi-depth
filtering can be used to get the correct height values.
The next step is generating a DSM I, which rep-
resents the height information of Earth’s surface in-
cluding all objects (buildings, trees, cars,...). From
the overlapping height maps calculated in the previ-
ous step we get multiple proposals for the height of a
pixel. For each pixel the most likely height value from
all the proposals is found and incorporated into the
DSM. The final height resolution of the DSM is usu-
ally much higher than that of the overlapping height
maps.
The DSM is only a 2.5D model because the aerial
images are recorded from above, where only part of
the surface is visible. Recording what is beneath is
not possible (e.g., a tunnel under a mountain or a river
under a bridge) and therefore only the top surface of
a structure is present in the DSM.
By back-projecting the point from the DSM into
the camera and coloring the pixel accordingly a
true-orthophoto with a uniform scale (like an ordi-
nary map) can be generated and used for measur-
ing distances. The applications of DSMs and true-
orthophotos are widespread and include infrastructure
planning, 3D building reconstruction, city modeling
and simulations for natural disaster management. As
input for our algorithm we use the DSM and the cor-
responding true-orthophoto (see Fig. 2).
Automated Segmentation of the Walkable Area from Aerial Images for Evacuation Simulation
127

Figure 2: For the SRG segmentation we use a true-
orthophoto, a DSM and an inclination map. In the DSM
model, height is represented as intensity values (higher is
brighter).Calculating the inclination map directly from the
DSM shows a stair-casing effect (depicted as ORIG), which
is greatly reduced when computed from a smooth DSM
(shown as ROF). Images are contrast-enhanced for visual-
ization purposes.
We are not only interested in flat areas but also in
ramps with a moderately steep slope and stairs, which
have a larger difference in height (around 16-20 cm).
To get an idea about the inclination of a surface we
calculate the surface normal representation from the
DSM.
Calculating the surface normals directly from the
DSM computed from the aerial images leads to ar-
tifacts due to the plane-sweep approach (Collins,
1996). We address this problem by using a smooth-
ing algorithm, which smooths the DSM I while keep-
ing the edges intact. Edge information is crucial be-
cause we want to keep accurate contours of build-
ings and other structures. The difference between cal-
culating this representation on the smooth and non-
smooth DSM can be seen in Figure 2 (ORIG vs ROF).
For our particular problem we choose the model in-
troduced by Rudin, Osher and Fatemi (ROF)(Rudin
et al., 1992):
min
I
S
Z
Ω
|∇I
S
|dx +
λ
2
Z
Ω
(I
S
− I)
2
dx
, (1)
where the first part is the regularization term, the sec-
ond the data fidelity term and I
S
a convex, continuous
function. We want to reconstruct an image I
S
, which
is smooth but also similar to the original input im-
age I. In order to get a smooth I
S
, the regularization
term reduces the differences within I
S
by penalizing
the L1-norm of the gradients. The data fidelity in-
duces similarity by punishing differences between I
S
and I with a quadratic norm.
The weighting term λ serves as a trade-off be-
tween data fidelity and regularization. A higher λ
gives more emphasize to the data fidelity term, lead-
ing to I
S
being more similar to the original I, while a
lower λ results in a very smooth I
S
. To solve this con-
vex optimization problem, a primal-dual optimization
algorithm (Chambolle and Pock, 2011) is used. Af-
ter this step, the results look smoother and are more
suitable for our approach (see Fig. 2, ROF).
The DSM only has one channel (height informa-
tion) but for the calculation of the surface normal
representation we need vectors with 3D coordinates.
Therefore, we generate a 3D representation
~
I
3D
of I
S
,
where
~
I
3D
(x,y) is given as
~
I
3D
(x,y) = (x · s
x
,y · s
y
,I
S
(x,y)), (2)
with s
x
and s
y
representing the spatial resolution in x-
and y-direction. Typically, we can assume s
x
= s
y
.
The basic idea for the surface normal calculation
is to compute the two tangential vectors
~
t
x
and
~
t
y
at a
point I
3D
(x,y). An easy way to compute
~
t
x
and
~
t
y
is to
simply calculate the vectors from the 4-neighborhood
of the pixel I
3D
(x,y) (see Fig. 3 (a)). We define
~
t
x
and
~
t
y
as:
~
t
x
=
~
I
3D
(x − 1, y) −
~
I
3D
(x + 1, y),
~
t
y
=
~
I
3D
(x,y − 1) −
~
I
3D
(x,y + 1).
We achieve fast computation and minimal memory
access with integral images as described in (Holz
et al., 2012).
For the pixel
~
I
3D
(x,y), the surface normal vector~n
is then given as:
~n =
~
t
x
×
~
t
y
. (3)
For the next steps the inclination of the slope is im-
portant, which is the angle α between a view vector
~v and the surface normal vector ~n. α is given by the
definition of the dot product as:
cos(α) =
~v ·~n
|~v||~n|
. (4)
In our DSMs the camera typically has a top-down
view on the scene, thus we assume a view vector
~v = (0, 0,1). Thus, only the normalized z-component
of the surface normal vector ~n is used. A flat sur-
face has an angle α = 0
◦
, thus cos(α) = 1. The 4-
neighborhood is used for the calculation of the incli-
nation, which results in an angle between the view
vector~v and ~n at edges (see Fig. 3(c))
Alternatively, one could compute a similar map by
using an edge weighting term e
−β|∇I
S
|
, where I
S
is the
smooth DSM model and β is a constant.
3.2 Segmentation of the Walkable Area
(WA)
The main and most crucial part in our approach is the
extraction of the WA. For an accurate simulation it
GISTAM 2016 - 2nd International Conference on Geographical Information Systems Theory, Applications and Management
128

Figure 3: (a) and (b) are the two different pixel neighbor-
hoods (red) around the center pixel p
c
(cyan) considered
during the SRG algorithm. Case I is the 4-neighborhood
(p
1−4
), used for growing over a slope or color difference.
Case II shows a larger neighborhood (p
5−8
) for growing
over stairs, which is necessary because of the surface nor-
mal orientation at edges depicted in (c).
is not enough to just segment a certain height level
because the whole WA (including slopes and stairs) is
interesting. This is a complex search problem because
accessibility highly depends on the topology. An area
might be inaccessible from one side due to a large
height difference but by using stairs or ramps on an-
other side it might become accessible. As a result we
want to have a binary segmentation, where all points
accessible by humans from the chosen starting point
are labeled 1 and the rest 0. We use a seeded region
growing (SRG) approach (Adams and Bischof, 1994),
which starts from a manually chosen seed point and
adds adjacent pixels to the segmentation if they fulfill
certain conditions (see Fig. 3). These pixels in turn
become the next seed points. This method is espe-
cially feasible for our problem because it can model
walking directions very well and we can easily incor-
porate different segmentation conditions for various
input data. We utilize all the available information by
using the DSM, the true-orthophoto and the inclina-
tion map as depicted in Figure 1.
With our approach we want to segment the walk-
able area including slopes and stairs. Starting from a
center pixel p
c
we have the two different cases pre-
sented in Figure 3 (a,b).
Case I In this case we check the pixels in the 4-
neighborhood (see Fig. 3(a)). We calculate the height
difference ∆h between a pixel p
n
and p
c
from the
DSM I
S
and add it if it is smaller than a threshold
value T
slope
. The true-orthophoto gives us additional
color information and we assume that in most cases
an accessible area with the same color does not sud-
denly become inaccessible. Thus we allow a slightly
greater height difference ∆h of 2 · ∆T
slope
when the
color difference ∆c is below a threshold T
color
. We
use I
S
instead of the inclination map because of the
clearer edges (see Fig. 3(c)).
Case II Stairs usually have a higher height dif-
ference ∆h but are still walkable by humans. To in-
clude such a concept in our algorithm we allow grow-
ing over a greater height difference (∆h ≤ T
stair
) if the
Figure 4: (a) is an artificially generated DSM with two ad-
jacent ramps and the seed point at the top left corner. (b)
shows the segmentation when not taking the height differ-
ence into account, while (c) is the correct segmentation with
barriers. The possible walking directions are depicted as red
arrows.
orientation is nearly horizontal/flat (cos(α) ≥ 1 − ε
s
).
We have to check the neighborhood (x ± 3,y) and
(x,y ± 3) because the surface normal vectors are not
pointing upwards at edges (see Fig. 3(b,c)). If a pixel
p
n
fulfills the criteria, we also add the pixels between
it and p
c
(depicted in gray) to the segmentation.
We can divide our SRG approach into the three
different parts SRG
SL
, SRG
ST
and SRG
C
, depending
on the segmentation criteria:
• SRG
SL
: ∆h ≤ T
slope
• SRG
C
: ∆h ≤ 2 · T
slope
, ∆c ≤ T
color
.
• SRG
ST
: ∆h ≤ T
stair
, cos(α
p
c
),cos(α
p
n
) ≥ 1 − ε
s
with cos(α
p
c
) and cos(α
p
n
) the orientation at the cen-
ter pixel p
c
and the one to be added p
n
. ε
s
and T
color
are constants, while T
slope
and T
stair
can be adapted
according to the age and mobility of the expected
people at the event. One would probably choose a
very low T
slope
and T
stair
for elderly people and for
wheelchair users T
stair
= 0. In Section 4.3, we will
thoroughly evaluate the usefulness of the different
parts and their combinations.
Slopes, and stairs both introduce the same kind of
problem. When structures of different height levels
are next to each other (no pixels between them) then
a complete segmentation would lead to a whole area
being segmented, even though it is not possible to go
from one height level to the other (see Fig. 4,(a)).
Usually, height information cannot be used in the
simulation programs, thus we put a barrier with width
of one pixel between the structures if their height dif-
ference ∆h > T
stair
. Figure 4(b,c) depicts the segmen-
tations and possible walking directions (red arrows)
with and without barrier, demonstrating the feasibil-
ity of this approach. The result is a complete, binary
segmentation of the WA including ramps and stairs.
Different digital maps of the WA extracted with our
method and the corresponding ground truth will be
presented in Section 4.3.
3.3 Exporting the CAD Model
Normally, evacuation simulation tools cannot directly
use a binary segmentation but require a computer-
aided drafting (CAD) model. For the CAD model
Automated Segmentation of the Walkable Area from Aerial Images for Evacuation Simulation
129

only the outer boundaries and the contours of disturb-
ing structures on the inside are of particular interest.
We extract the boundaries and then use them to gen-
erate the CAD model for most common simulation
tools. In Appendix 5 we show how we can utilize our
binary segmentation in the evacuation simulation tool
PedGo (Kl
¨
upfel, 2006).
4 EXPERIMENTS AND RESULTS
In this section, we propose a novel annotation scheme
for assessing the quality of extracted evacuation maps
(see Sec. 4.1). With an extensive evaluation of the
different SRG methods presented in Section 3.2 on
real-world scenarios, we then show the feasibility of
our approach. In the last part, we study different pa-
rameter settings for T
stair
, λ and T
slope
and analyze
their influence on the segmentation.
4.1 Experimental Setup
For evaluation of computer vision methods the results
are usually compared to known and more accurate ref-
erences, which are commonly referred to as ground
truth (GT). Getting any kind of GT data for aerial im-
ages is very difficult and to our knowledge no ground
truth data is available for the special case of evacua-
tion maps. Therefore, a computer vision expert manu-
ally annotated the WA based on the true-orthophotos.
Accurate manual segmentation is also challenging be-
cause the true-orthophotos are calculated from mul-
tiple recordings and often exact borders are hard to
determine.
For the evaluation of our SRG algorithms, we
choose four outdoor scenarios from various cities
and with different spatial resolutions. We use the
Dice coefficient (DC) (Dice, 1945) and the Jaccard
similarity (JS, also known as Tannimoto Coefficient)
(Jaccard, 1908) to compare our segmentation SEG
to the GT. |SEG| and |GT | denote the sum of
segmented pixels.
Dice Coefficient (DC)
The DC is a measure for comparing 2D region
overlap with a range from [0, 1] and is defined as:
DC =
2|SEG ∩ GT |
|SEG| + |GT |
(5)
Jaccard Similarity (JS)
The JS is very similar to the DC and ranges from
[0,1] but is usually lower. It is defined as:
JS =
|SEG ∩ GT |
|SEG ∪ GT |
(6)
The DC and JS are good indicators for the overall
segmentation quality but do not give us a measure-
ment for usefulness of the extracted evacuation map.
Further, the segmented areas are quite large (> 1MP)
and missing small but important structures hardly
affects the overall score.
Evacuation Map Annotation
To assess the quality of extracted evacuation maps,
we propose a new annotation scheme with two types
of labels:
• Potential evacuation routes GT
P
• Structures that must not be segmented GT
B
These additional GT annotations can then be com-
pared to the segmentation. We define two scores S
P
,
S
B
in the range [0,1] to assess the segmentation qual-
ity of potential evacuation routes and blocking struc-
tures. They are defined as:
S
P
=
|SEG ∩ GT
P
|
|GT
P
|
, (7)
and
S
B
= 1 −
|SEG ∩ GT
B
|
|GT
B
|
, (8)
with GT
P
as the annotated potential evacuation routes,
GT
B
the blocking structures and SEG the segmenta-
tion result. These two values must always be evalu-
ated jointly because S
P
= 100% if the whole image is
segmented, while S
B
= 100% if nothing is segmented.
Examples for such annotations can be seen in Figure 5
(c, f, i, l) with GT in white, GT
B
in red and GT
P
in
green.
All the computations were performed on an Intel
i7-4790 (3,6 GHz x 8) with 32 GB of memory run-
ning Ubuntu Linux 14.04. The denoising and SRG
algorithms are completely implemented in C++ using
OpenCV 3.0.0 to allow fast computations. For a typ-
ical 15 MP image, denoising is by far the most com-
putationally expensive operation (around 2 minutes),
while segmentation works a lot faster (< 1 second).
4.2 Aerial Image Data
Real-world scenarios are very challenging because
the algorithm has to deal with vegetation, different re-
gional building styles, cars and other obstacles. The
performance of our method mainly depends on the
quality of the DSMs and true-orthophotos, which are
usually subject to noise and reconstruction artifacts.
GISTAM 2016 - 2nd International Conference on Geographical Information Systems Theory, Applications and Management
130
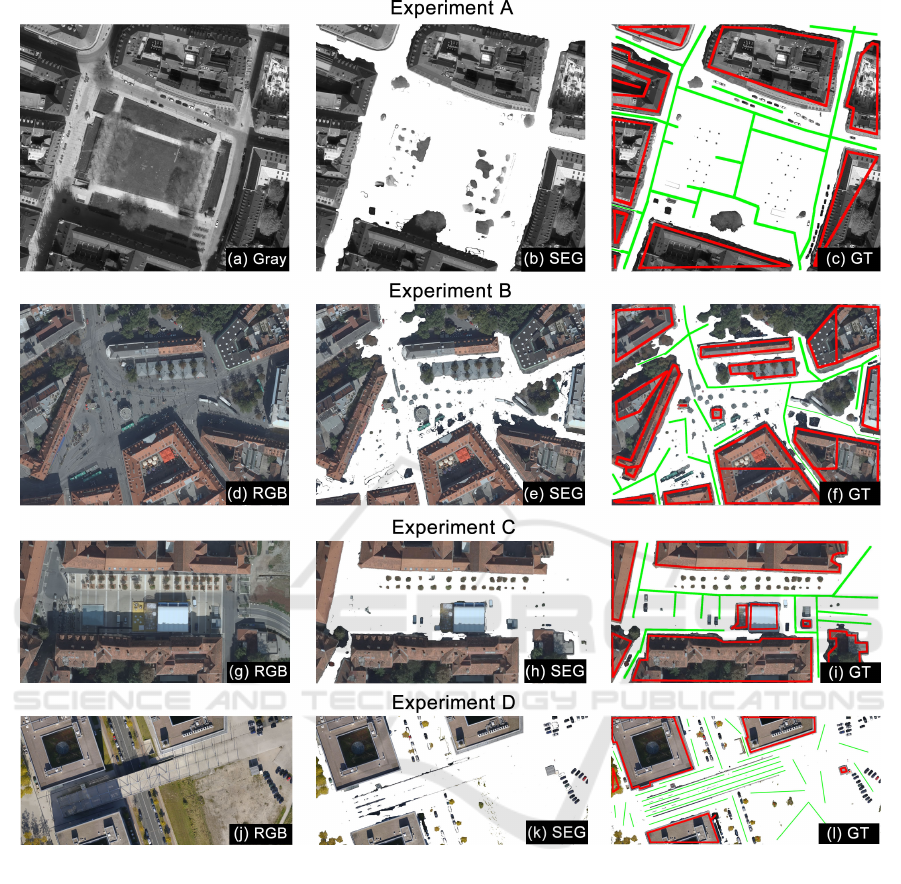
Figure 5: Experiment A, Marienhof (Munich, Germany), Experiment B, Jakominiplatz (Graz, Austria), Experiment C,
Karmeliterplatz (Graz, Austria), Experiment D, Bridge (Hannover, Germany). First column: true-orthophoto; second col-
umn: overlay with our segmentation (SEG); third column: overlay with the GT (including the G
P
and G
B
).
In all the real-world experiments, the GT is compared
to the automatically generated results from the algo-
rithm. We choose four sites from three different cities
(Exp. A-D).
Experiment A is the Marienhof, which is a big
park with space for a lot of people and many adjacent
streets (see Fig. 5(a)). In this recording only gray-
scale true-orthophotos were available.
Experiment B is the Jakominiplatz, which has a
very difficult setup due to the many bus stops, buses,
trams and street lamps (see Fig. 5 (d)).
Experiment C is the Karmeliterplatz, where an
event took place at the moment of recording (see Fig.
5 (g)). A large tent with a stage in front is present.
Experiment D shows a bridge over a small road
next to the Expo Plaza in Hannover, Germany (see
Fig. 5 (j)). This is the only drone recording and
therefore has a much higher spatial resolution. The
setup is especially interesting because it includes
stairs, slopes, cars, buildings and different height lev-
els (bridge, road).
The spatial resolution of Experiment A-C is s
x
=
s
y
= 10 cm, while in Experiment D it is s
x
= s
y
= 3
cm.
Automated Segmentation of the Walkable Area from Aerial Images for Evacuation Simulation
131

Table 1: The segmentation results of the four experiments with different SRG methods (best scores are depicted in bold).
The Dice coefficient (DC), the Jaccard similarity (JS), the segmentation score for potential evacuation routes S
P
. Only results
where no blocking structures were segmented are shown (S
B
= 100 %).
SRG Experiment A Experiment B Experiment C Experiment D
[%] DC JS S
P
DC JS S
P
DC JS S
P
DC JS S
P
SL 95.74 91.83 94.72 90.52 82.69 93.28 95.70 91.76 92.22 97.51 95.14 99.88
ST 92.40 85.87 93.30 83.53 71.72 87.96 90.70 82.99 91.19 96.26 92.79 97.15
C 1.68 0.85 2.21 29.17 17.07 20.41 18.78 10.36 13.54 1.28 0.64 0.00
SL,ST 95.84 92.01 94.72 90.67 82.93 93.29 95.70 91.76 92.22 98.24 96.54 99.90
SL,C 95.13 90.72 94.56 91.83 84.89 96.02 97.88 95.85 99.38 98.10 96.27 99.93
ST,C 95.26 90.95 94.20 91.61 84.52 96.20 95.78 91.89 98.76 97.17 94.50 98.16
SL,ST,C 96.04 92.39 94.92 91.83 84.90 96.02 97.88 95.85 99.38 98.07 96.21 99.88
4.3 Results and Discussion
In this section, we present an extensive quantitative
and qualitative evaluation of the segmentation re-
sults for Experiment A-D, followed by a discussion,
where we also investigate various parameter settings
for T
stair
, λ and T
slope
. For the evaluation, we study
the different SRG methods presented in Section 3.2
and their combinations. Table 1 shows the DC, JS
and S
P
as percentages for different SRG methods and
their combinations. We assure a fair comparison by
optimizing the parameters T
slope
(up to a maximum of
35 % of the spatial resolution s
x,y
) and λ (up to a value
of 500) for each SRG method and their combinations.
Further, T
stair
was set to the realistic values 10 and 20
cm, T
color
was set to ±3 for each channel (R,G,B) and
ε
s
= cos(10
◦
). For Experiment A only gray-scale
true-orthophotos were available, thus we simply used
the one intensity channel for each of the three color
channels (R,G,B). In our evaluation we only included
results, where all the blocking structures were not seg-
mented (S
B
= 100%). The settings for T
stair
, λ and
T
slope
for each experiment are presented in Table 2
and their choice will be discussed later.
Table 1 shows that the worst scores were achieved
by SRG
C
, which cannot handle color changes (i.e.,
shadows) and usually only segments an area sur-
rounding the seed point. SRG
ST
performs far bet-
ter but can only segment areas, which are either flat
or stairs. SRG
slope
shows high scores but is in gen-
eral outperformed by combinations of different SRG
methods. Overall, the combination of the three SRG
methods SRG
SL
, SRG
ST
and SRG
C
yields very good
results and performs quite well in all the test-cases.
Therefore, we used this combination and the optimal
parameters in Table 2 to generate the qualitative re-
sults. Figure 5 shows the results of Experiment A-D.
First, we show the original gray-scale and color true-
orthophoto (gray/RGB), then an overlay with our seg-
mentation (SEG) and finally another overlay with the
GT segmentation including the annotations of poten-
tial evacuation routes GT
P
(green) and blocking struc-
tures GT
B
(red).
Table 2: Optimal settings for T
stair
, λ,T
slope
and the spatial
resolution s
x,y
for Experiment A-D.
T
stair
[cm] T
slope
[cm] λ s
x,y
[cm]
Exp. A 20 3.5 4 10
Exp. B 10 3.5 24 10
Exp. C 10 3.0 78 10
Exp. D 10 1.0 24 3
With our automated evacuation map extraction al-
gorithm we achieve very good segmentation scores of
over 90 % in all the real-world experiments. Com-
pared to a manually annotated GT our approach seg-
ments a similar area and almost all potential evacua-
tion routes.
In Experiment A we get promising results, de-
spite the gray-scale true-orthophoto. All the main ex-
its from the square were segmented correctly, while
three narrow streets were left out. During DSM gen-
eration the estimation of the height of narrow streets
is difficult because their ground levels are only visible
in the few aerial images taken directly above the them.
Thus, the surrounding buildings greatly influence the
calculation and the ground level appears higher than it
actually is. A similar problem occurs in Experiment
B, where the street on the top left corner is mostly
covered by trees.
Experiment C contains a square with a stage and
a tent, which were both correctly left out of the seg-
mentation. An interesting part is the narrow street at
the left bottom, where the DSM is not very good, but
GISTAM 2016 - 2nd International Conference on Geographical Information Systems Theory, Applications and Management
132
using the SRG
CL
approach, we manage to overcome
this small obstacle and correctly segment most of the
area. This is also the reason for the difference in S
P
between the combinations involving SEG
color
and the
ones without.
The spatial resolution in Experiment D is by
far the best and we are even able to leave most of
the cars out of the segmentation, which is quite
difficult with a higher resolution of around 10 cm
(like in Experiment A). The limiting factors in
the real-world scenarios are the quality and spatial
resolution of the DSMs and true-orthophotos because
we calculate the segmentation from these inputs,
meaning our results are only as good as the input data.
The choice of T
stair
, λ and T
slope
Our segmentation results depend not only on the
quality of the input data, but also on the right parame-
ter settings. Table 2 shows different choices for T
stair
,
λ and T
slope
for Experiment A-D (optimal settings in
bold). In our experiments, we found that the value of
T
stair
is not critical, thus we focus only on the choices
for λ and T
slope
.
Figure 6 depicts the evaluation of the DC [%] for
Experiment A-D for T
slope
= [0.005,0.5] cm (top)
and λ = [4, 500] (bottom). The step-sizes are very
small in the beginning and widen when the values get
higher. For the evaluation of λ we set T
slope
to the op-
timal value calculated in Section 4.3 and vice versa.
Figure 6: Two plots showing the DC [%] for different val-
ues of T
slope
(top) and λ (bottom). Especially the choice of
T
slope
is very important for the DC.
T
slope
is in general limited by the accessibility and a
decent choice is usually around an inclination of 35
%, which would mean T
slope
= 3.5 for a spatial reso-
lution of s
x
= s
y
= 10 cm. Higher values can easily
lead to an over-segmentation and the WA would in-
clude inaccessible areas in that case.
A very small λ gives more emphasize to the
smoothing term and we even smooth over edges,
which can lead to an over-segmentation, while a
higher λ reduces the smoothing effect. We found that
values 10 < λ < 150 are in general good choices.
5 CONCLUSION AND OUTLOOK
In this paper, we presented a novel, efficient and easy-
to-use approach to create digital maps for simula-
tion of outdoor evacuation scenarios. Using DSMs
and true-orthophotos computed from high-resolution
aerial images, we got a very accurate segmentation
of the WA in outdoor environments. We also showed
that a combination of different SRG approaches is in-
deed feasible. From the segmentation a CAD model
can be generated, which can then be used in most
common evacuation simulation tools. Additionally,
we introduced a new annotation scheme to assess the
quality of the extracted evacuation maps.
Despite the promising results of our approach,
there is still room for improvement. Extending the
SRG algorithm to also segment narrow streets and
evaluating our method by the example of an actual
event are potential topics for future work.
ACKNOWLEDGEMENTS
This work was financed by the KIRAS program (no
840858, AIRPLAN) under supervision of the Aus-
trian Research Promotion Agency (FFG) and in co-
operation with the Austrian Ministry for Traffic, In-
novation and Technology (BMVIT).
REFERENCES
Adams, R. and Bischof, L. (1994). Seeded region growing.
IEEE Transactions on Pattern Analysis and Machine
Intelligence, 16(6):641–647.
Chambolle, A. and Pock, T. (2011). A first-order primal-
dual algorithm for convex problems with applications
to imaging. Journal of Mathematical Imaging and Vi-
sion, 40(1):120–145.
Cheriyadat, A. M. (2014). Unsupervised feature learning
for aerial scene classification. IEEE Transactions on
Geoscience and Remote Sensing, 52(1):439–451.
Automated Segmentation of the Walkable Area from Aerial Images for Evacuation Simulation
133

Collins, R. T. (1996). A space-sweep approach to true
multi-image matching. In Computer Vision and Pat-
tern Recognition, pages 358–363. IEEE.
Dal Poz, A. P., Gallis, R. A., da Silva, J. F., and Martins,
´
E. F. (2012). Object-space road extraction in rural ar-
eas using stereoscopic aerial images. Geoscience and
Remote Sensing Letters, IEEE, 9(4):654–658.
Dice, L. R. (1945). Measures of the amount of ecologic
association between species. Ecology, 26(3):297–302.
Galea, E. R. (2002). Simulating evacuation and circulation
in planes, trains, buildings and ships using the exo-
dus software. Pedestrian and Evacuation Dynamics.
Springer, pages 203–225.
Han, J., Zhang, D., Cheng, G., Guo, L., and Ren, J. (2015).
Object detection in optical remote sensing images
based on weakly supervised learning and high-level
feature learning. Transactions on Geoscience and Re-
mote Sensing, 53(6):3325–3337.
Holz, D., Holzer, S., Rusu, R. B., and Behnke, S. (2012).
Real-time plane segmentation using rgb-d cameras. In
RoboCup 2011: Robot Soccer World Cup XV, pages
306–317. Springer.
Hsu, E. B. and Burkle, F. M. (2012). Cambodian bon om
touk stampede highlights preventable tragedy. Pre-
hospital and disaster medicine, 27(05):481–482.
Hu, J., Razdan, A., Femiani, J. C., Cui, M., and Wonka, P.
(2007). Road network extraction and intersection de-
tection from aerial images by tracking road footprints.
IEEE Transactions on Geoscience and Remote Sens-
ing, 45(12):4144–4157.
Huth, J., Kuenzer, C., Wehrmann, T., Gebhardt, S., Tuan,
V. Q., and Dech, S. (2012). Land cover and land use
classification with twopac: Towards automated pro-
cessing for pixel-and object-based image classifica-
tion. Remote Sensing, 4(9):2530–2553.
Irschara, A., Rumpler, M., Meixner, P., Pock, T., and
Bischof, H. (2012). Efficient and globally optimal
multi view dense matching for aerial images. ISPRS
annals of photogrammetry, remote sensing and spatial
information sciences, 1:227–232.
Jaccard, P. (1908). Nouvelles recherches sur la distribution
florale.
Johnson, C. W. (2008). Using evacuation simulations
for contingency planning to enhance the security and
safety of the 2012 olympic venues. Safety science,
46(2):302–322.
Kl
¨
upfel, H. (2006). The simulation of crowd dynamics at
very large events. Traffic and Granular Flow’05, 5.
Krausz, B. and Bauckhage, C. (2012). Loveparade 2010:
Automatic video analysis of a crowd disaster. Com-
puter Vision and Image Understanding, 116(3):307–
319.
L
¨
ammel, G., Grether, D., and Nagel, K. (2010). The rep-
resentation and implementation of time-dependent in-
undation in large-scale microscopic evacuation simu-
lations. Transportation Research Part C: Emerging
Technologies, 18(1):84–98.
Lin, Y. and Saripalli, S. (2012). Road detection and tracking
from aerial desert imagery. Journal of Intelligent &
Robotic Systems, 65(1-4):345–359.
Lowe, D. G. (2004). Distinctive image features from scale-
invariant keypoints. International Journal of Com-
puter Vision, 60(2):91–110.
Mas, E., Adriano, B., and Koshimura, S. (2013). An inte-
grated simulation of tsunami hazard and human evac-
uation in la punta, peru. Journal of Disaster Research,
8(2):285–295.
Rudin, L., Osher, S., and Fatemi, E. (1992). Nonlinear total
variation based noise removal algorithms. Physica D:
Nonlinear Phenomena, 60(1):259–268.
Rumpler, M., Wendel, A., and Bischof, H. (2013). Prob-
abilistic range image integration for dsm and true-
orthophoto generation. In Image Analysis, pages 533–
544. Springer.
Schneider, V. and K
¨
onnecke, R. (2001). Simulating evacu-
ation processes with aseri. Pedestrian and Evacuation
Dynamics, pages 301–313.
Shi, C., Zhong, M., Nong, X., He, L., Shi, J., and Feng,
G. (2012). Modeling and safety strategy of passenger
evacuation in a metro station in china. Safety Science,
50(5):1319–1332.
Tang, F. and Ren, A. (2012). Gis-based 3d evacuation sim-
ulation for indoor fire. Building and Environment,
49:193–202.
Taubenb
¨
ock, H., Post, J., Kiefl, R., Roth, A., Ismail, F. A.,
Strunz, G., and Dech, S. (2009). Risk and vulnera-
bility assessment to tsunami hazard using very high
resolution satellite data: The case study of padang, in-
donesia. EARSeL eProceedings, 8(1):53–63.
Triggs, B., McLauchlan, P. F., Hartley, R. I., and Fitzgib-
bon, A. W. (2000). Bundle adjustmenta modern syn-
thesis. In Vision Algorithms: Theory and Practice,
pages 298–372. Springer.
Tsai, J., Fridman, N., Bowring, E., Brown, M., Epstein,
S., Kaminka, G., Marsella, S., Ogden, A., Rika, I.,
Sheel, A., et al. (2011). Escapes: evacuation simula-
tion with children, authorities, parents, emotions, and
social comparison. pages 457–464. AAMAS.
Zhou, H., Kong, H., Wei, L., Creighton, D., and Nahavandi,
S. (2015). Efficient road detection and tracking for
unmanned aerial vehicle. IEEE Transactions on Intel-
ligent Transportation Systems, 16(1):297–309.
APPENDIX
In the Appendix, we show a typical evacuation sim-
ulation scenario where our generated digital map can
be used. We use the map of the Marienhof (Munich,
Germany) generated in Experiment A and utilize the
software tool PedGo (Kl
¨
upfel, 2006) mentioned in
Section 1. The software package comprises three dif-
ferent programs:
• PedEd - Used for editing the map, placing persons
and marking the exits
• PedGo - The simulation program, where various
scenarios can be simulated
GISTAM 2016 - 2nd International Conference on Geographical Information Systems Theory, Applications and Management
134
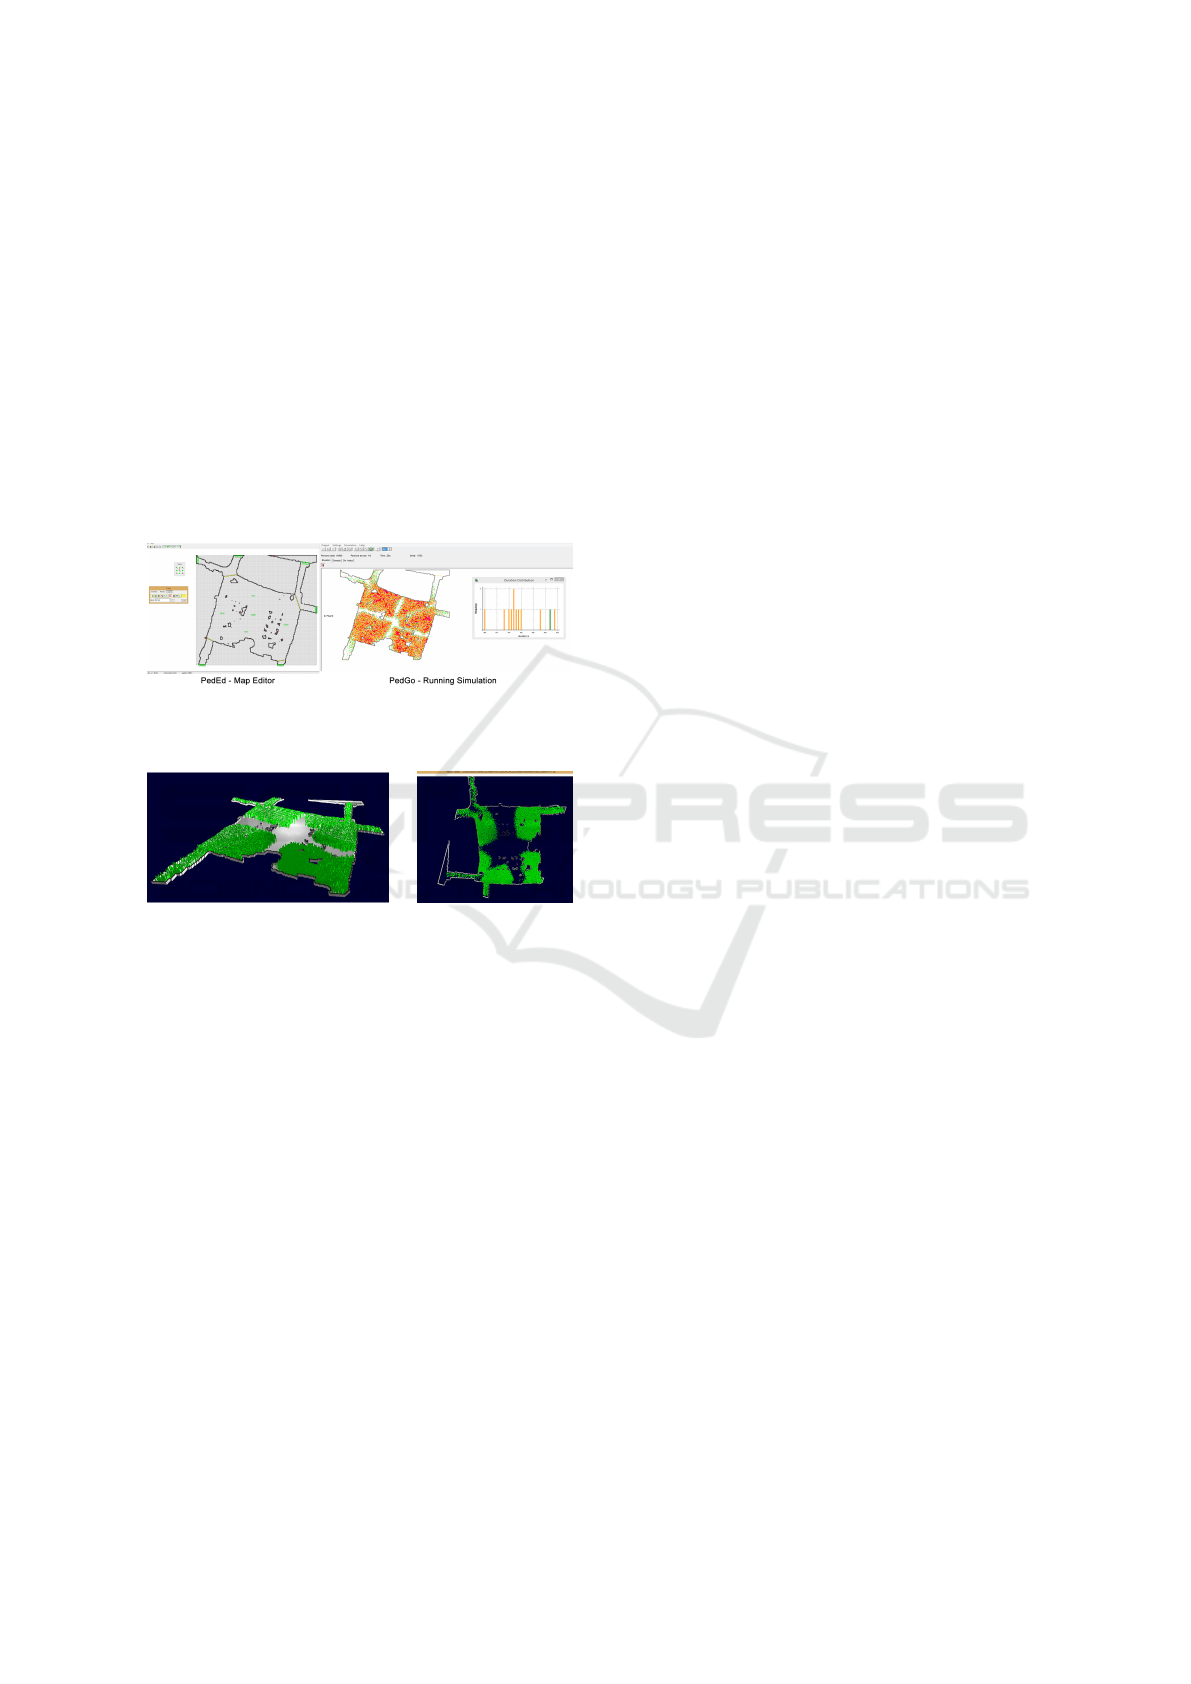
• PedView - A 3D visualization of the previously
calculated simulations
The first step is always loading the map into the
editor PedEd and placing the exits (see Fig. 7, left).
They are usually at the end of the streets leading away
from the central area. After that, persons (or agents)
can be put onto the map and corrections of the map
can be made. The whole process usually takes less
than three minutes. The next step is starting the sim-
ulation tool (PedGo) and loading the project. To get
an estimate of the average evacuation time, multiple
simulations should be performed (see Fig. 7, left).
With PedView we can view simulation files gen-
erated with PedGo in full 3D (see Fig. 8).
Figure 7: With PedEd the extracted CAD model can be
edited and then various simulations can be performed with
PedGo.
Figure 8: PedView can present the simulations calculated
with PedGo in 3D.
Automated Segmentation of the Walkable Area from Aerial Images for Evacuation Simulation
135
