
DataCommandr: Column-oriented Data Integration, Transformation
and Analysis
Alexandr Savinov
Bosch Software Innovations GmbH, Stuttgarterstr. 130, 71332 Waiblingen, Germany
Keywords: Big Data, Data Wrangling, Ad-hoc Analytics, Agile Analytics, Column-oriented Representation.
Abstract: In this paper, we describe a novel approach to data integration, transformation and analysis, called
DataCommandr. Its main distinguishing feature is that it is based on operations with columns rather than
operations with tables in the relational model or operations with cells in spreadsheet applications. This data
processing model is free of such typical set operations like join, group-by or map-reduce which are difficult
to comprehend and slow at run time. Due to this ability to easily describe rather complex transformations
and high performance on analytical workflows, this approach can be viewed as an alternative to existing
technologies in the area of ad-hoc and agile data analysis.
1 INTRODUCTION
As data analysis and decision support systems
continue to evolve and improve, application
developers and analysts spend an inordinate amount
of time and effort manually preparing data and
representing it in a form suitable for visualization,
decision making or further analysis. This process
where the source data is made useful by iteratively
and exploratively transforming data into a suitable
form is frequently referred to as data wrangling
(Kandel et al., 2011). It is known as one of the most
tedious and highest cost issues in IT by covering
many application areas and technologies.
Data wrangling historically originates from the
processes of synchronizing a decision support
system with operational databases which is referred
to as Extract, Transform, Load (ETL). In more
general contexts, these processes where data is
transformed from many heterogeneous data sources
to a suitable format have been referred to as Data
Integration (DI). In data integration, the focus is
made on heterogeneity of the data sources and the
necessity to combine all of them into a unified data
representation. There exist multiple scenarios where
DI, ETL and data wrangling are used, for example,
business intelligence, data warehousing, data
migration and data federation. They are also used in
various big data and data analysis applications. Note
that the term “big data” means not only the amount
of data but also the diversity and variety of models,
formats and conventions for their representation
(Cohen et al., 2009). And the significant increase in
the variety of data sources determines high demand
for data wrangling technologies. However, several
significant modern trends over the last few years
determine new requirements to and new
functionalities of such systems.
Complex Analytics. In complex analytics, a query
is not a filter with a couple of joins anymore. It is a
data processing script intended to perform almost
arbitrary computations. Data processing is getting
closer to writing a program rather than retrieving
subsets of data using a declarative query languages
like SQL.
Agile and Ad-hoc Analytics. Perhaps the most
widely used approach to explorative data analysis is
based on OLAP and the multidimensional data
model. This approach uses application-specific
scenarios with predefined roles of dimensions,
measures, cubes and facts. Changing these scenarios
in OLAP is a quite difficult task because they are
embedded in both data warehouse and client
software (Krawatzeck, Dinter & Thi, 2015). The
goal of agile analytics consists in going beyond
standard OLAP analysis by facilitating exploratory
ad-hoc approaches where the user can freely vary
most data processing and visualization parameters.
Near Real-time Analytics. Traditional systems
cannot provide the necessary response time and
Savinov, A.
DataCommandr: Column-oriented Data Integration, Transformation and Analysis.
DOI: 10.5220/0005877203390347
In Proceedings of the International Conference on Internet of Things and Big Data (IoTBD 2016), pages 339-347
ISBN: 978-989-758-183-0
Copyright
c
2016 by SCITEPRESS – Science and Technology Publications, Lda. All rights reserved
339

agility of decision making on large volumes of data
(Chaudhuri et al., 2011). It may take hours or days to
generate a report in a typical enterprise system and
newer map-reduce technologies like Hadoop are
even slower. However, for agile and ad-hoc
analytics, the response time should be minimized
because otherwise it is not possible to explore the
space of possible data transformation options. As the
volume of data coming from diverse sources is
increasing at ever faster rates, there is stronger
demand in reducing the time between data
acquisition and making a business decision.
Self-service Analytics. The above three
technological trends are present in the fourth
direction, called self-service analytics, the goal of
which is to provide tools for authoring complex ad-
hoc analysis scenarios in agile manner to end users
and domain experts as opposed to tools used by IT
persons. This trend is connected with the
democratization of data where ordinary users, and
not just database administrators and developers, are
directly involved in the process of data preparation,
transformation and visualization (Morton et al.,
2014).
Almost all currently existing technologies for
data transformation are based on the same
foundation. The main pattern is that it is necessary to
describe how a new data table is generated from
existing data tables and then provide an efficient
environment for executing these table
transformations. This paper describes a radically
new approach to data integration, transformation and
analysis, called DataCommandr. Its main
distinguishing feature is that the primary unit of
transformation is that of a column (rather than a
table) and hence it can be characterized as a column-
oriented approach. Instead of defining how new
tables are generated from existing tables, we define
how new columns are defined in terms of existing
columns. In mathematical terms, this means that
instead of defining transformations of relations
(sets), we define transformations of functions
(mappings). Thus a function (not a relation) is the
main element of the described data manipulation
language and the underlying data model.
Switching from tables to columns is a highly
non-trivial task. In particular, it is necessary to get
rid of such operators like join (Savinov, 2012a) and
group-by because they are inherently set-oriented
operators. To solve these problems, DataCommandr
relies on a novel concept-oriented model of data
(Savinov, 2014b; Savinov, 2012b) which provides
the necessary theoretical basis. As a result,
DataCommandr can be characterized as a column-
oriented, join-free and groupby-free approach. The
absence of these operators makes it much more
natural and easy to use while column orientation
makes it more efficient at run-time.
DataCommandr is a data processing engine
behind ConceptMix (Savinov, 2014a). Although
they both are based on the same theoretical basis
(the concept-oriented model of data) these systems
are targeted at different problems and have different
implementations. ConceptMix is intended for
interactive self-service data blending using rich UI
(implemented in C# for MS Windows).
DataCommandr is designed as a general purpose
data processing engine written in Java. It can be
embedded into or used from other applications with
the purpose similar to MapReduce (Dean and
Ghemawat, 2004) or Spark (Zaharia et al., 2012).
DataCommandr provides a novel concept-oriented
expression language (COEL) as a means for
describing data transformations which is absent in
ConceptMix.
This paper makes two major contributions:
We present a novel data processing paradigm
which is based on column transformations as
opposed to the currently dominating approach
based on table transformations or cell
transformations in spreadsheets.
We describe how this conception has been
implemented in DataCommandr
1
which is
designed to meet the requirements of the modern
technological trends.
The paper has the following layout. Section 2
provides the necessary background and describes the
main goals of DataCommandr. Sections 3-6 describe
main operations provided by DataCommandr for
defining transformations. Section 7 makes
concluding remarks.
2 BACKGROUND
2.1 Cell-oriented Functional Approach
Due to their simplicity and ease of use, spreadsheet
applications are known as the most popular type of
BI tools. The general idea of spreadsheets is based
on the following major principles. First, a minimum
unit of data is a cell which represents one value.
Second, cells have two-dimensional addresses, that
is, a unique address of a cell has two constituents
which are thought of as rows and columns of a table
1
http://conceptoriented.org
IoTBD 2016 - International Conference on Internet of Things and Big Data
340

called a spreadsheet (hence the name of the
approach). Third, data values can be computed using
a function which derives an output value from the
values in the cells referenced via their addresses.
Therefore, it is a functional approach: the system
evaluates these functions whenever some input value
changes.
DataCommandr aims at retaining the simplicity
and generality of spreadsheets. In particular,
DataCommandr assumes that data and data
transformations are represented as a number of
addressable units which can store either data values
or functions for computing these values. Functions
are represented as formulas that can involve data in
other storage units. Just as in the case of
spreadsheets, writing a data processing script is
reduced to writing (functional) expressions rather
than queries and it is exactly what provides
simplicity and generality.
Although DataCommandr shares the functional
paradigm with the spreadsheets, it is not an
alternative to spreadsheets or their variation. The
main difference is how storage units are defined and
hence what functions manipulate. In contrast to
spreadsheets where a data unit is a cell, a minimum
addressable data unit in DataCommandr is a column.
Thus one (simplistic) interpretation of
DataCommandr is that it is a column-oriented
spreadsheet, that is, a spreadsheet where the user
defines new columns in terms of other columns via
formulas using a special expression language. For
example (Fig. 1), a new cell could be defined as a
formula
C3=A1+B2 where A1, B2 and C3 are cell
addresses. In DataCommandr, a new column could
be defined as a formula
C=A+B where A, B and C are
column names. Importantly, it is not possible to
address individual values within a column – a
formula describes how all values in an output
column are computed from all values in input
columns.
Figure 1: Cell-oriented spreadsheets vs. column-oriented
approach in DataCommandr.
A problem of spreadsheets is that thinking in
terms of cells is not inherently compatible with
thinking of data in terms of sets and columns. One
attempt to convert the very successful spreadsheet
approach to a column-oriented paradigm has been
made by Microsoft in its Data Analysis Expression
(DAX) language (Russo, Ferrari & Webb, 2012)
used in such products as Power Pivot and Power BI.
Although DAX has many interesting features which
distinguish it from most other techniques for data
manipulations, it is still a rather eclectic technique
rather than a theoretical conception, that is, it is a
number of syntactic constructs which allow us to
apply various functions to columns. In contrast,
DataCommandr proceeds from theoretical
foundations which have been developed in the
concept-oriented model (COM) of data. These
theoretical principles have been then applied to the
problem of data transformations by resulting in a
concept-oriented expression language (COEL).
COEL in this sense is simpler than DAX and it has
some significant differences. Note also that
Microsoft uses a new tabular data model which is
supposed to generalize various views on data
(particularly, multi-dimensional and relational) but it
did not result in a theoretical foundation but rather
remains a (highly interesting) technological artifact.
2.2 Table-oriented Functional
Approach
Just as spreadsheets dominate in self-service BI, the
relational model of data (in numerous variants and
reincarnations) dominates in server-side and
complex data processing. When we are talking about
data processing then this general paradigm is
reduced to the following principles. First, data is
stored in sets. If we want to represent and
manipulate data then we have to define the
corresponding sets – there is no possibility to work
with data not stored in sets. Second, sets consist of
tuples. Third, manipulations with data are described
as various operations with sets which return other
sets.
The relational model and SQL-like languages are
known to be quite restrictive when used for complex
analysis tasks (Atzeni et al., 2013). A description of
transformations can be quite lengthy and not very
natural in the case of many tables and relationships.
Also, the traditional row-oriented data processing
engines have relatively low performance when
applied to analytical workflows. These difficulties
explain why the column-oriented approach has been
so successful when implementing database
management systems (Copeland and Khoshafian,
1985; Abadi, 2007; Boncz, 2012). Yet, we are not
aware of any uses of the column-oriented approach
A B C
1 4
2 3
3 7
C3=A1+B2
Column‐oriented
A B C
4 1 5
3 3 6
2 5 7
C=A+B
Cell‐oriented
DataCommandr: Column-oriented Data Integration, Transformation and Analysis
341
in data processing systems which are not focused on
persistence and physical organization. Most
columnar databases rely on conventional set-
oriented query languages or API by changing only
the physical level of data organization. In contrast,
the main goal of DataCommandr is to introduce
column-orientation at the logical level so that these
operations are then naturally translated into the
columnar representation of the data at the physical
level.
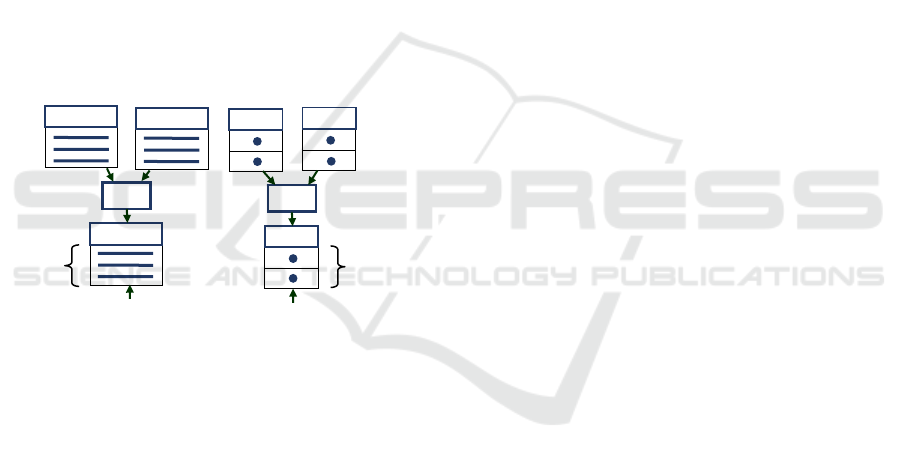
DataCommandr also follows the approach where
the user has to define functions which transform
input data and produce output data. The main
difference (Fig. 2) is that these functions are defined
on columns rather than tables (sets). Obviously, it is
not a subtle feature but rather a fundamental
difference. The main reason why we switch to
column-orientation is that we want to radically
simplify operations with data by simultaneously
making them more efficient at run time for analytic
workflows.
Figure 2: Column-oriented approach vs. table-oriented
data transformations.
An important observation is that table operations
and column operations can be mixed. For example, a
typical SQL query has a
SELECT clause which
contains also definitions of new columns like
price*quantity AS amount. Here price and
quantity are existing column names and amount is
a new derived column added to the result table. Such
a query mixes two concerns: how a table is
populated and how its columns are computed. One
of the goals of DataCommandr is to separate these
two concerns: tables and columns have to be defined
by independent constructs because table population
and column computations are conceptually different.
For example, in the case of SQL, we could imagine
that one statement defines a new table and other
statements define new columns:
CREATECOLUMNIN
MyTabletotalAmount=price*quantity
. One
of the distinguishing features of DataCommandr is
that we managed to reduce all table operations to
column expressions.
3 DERIVED COLUMNS
Tables in DataCommandr are created as empty
schema elements without columns and without data:
DcTableLineItems=
createTable("LineItems");
How tables are populated is described in Section 5.
Columns are added to (or deleted from) an
existing table using separate statements. For
example, we could add a new column
amount:
DcColumnamount=
createColumn("amount",LineItems,Double);
Here we specify column name (amount), input table
where this column exists (
LineItems) and output
table (data type). The column is of primitive type
Double but it could be any other existing table
(Section 4).
If we want to derive data in this column from
values in other columns then it is necessary to
provide its definition. If the
LineItems table has two
columns
price and quantity then the new column
can be defined by the following COEL formula:
amount.setFormula(
"this.[price]*this.[quantity]"
);
This formula means that the output value is
computed as the product of the values in the
columns
price and quantity. Note that these
values will be computed for the same row of the
LineItems table which is indicated by the (optional)
keyword
this. In the general case, formulas can
contain external procedures which are needed for
complex computations including system or user-
defined Java code.
The system knows that this column depends on
the two input columns used in its definition. In the
case some column changes, all dependent columns
can be updated automatically, that is, changes in the
data are propagated through the model without the
necessity to evaluate the whole model. A column in
this model collects data from other parts of the
database by processing it and storing the result as its
outputs. Cyclic dependencies are not allowed and
hence the model is a directed acyclic graph of
column definitions.
The main limitation of this type of row-based
formulas is that they are able to access and process
T2
operation
onrelations
C1
C2
C3
operationon
functions
C3=OP(C1,C2)
T1
T3
OP
OP
Column‐oriented
Table‐oriented
values
tuples
T1=OP(T1,T2)
IoTBD 2016 - International Conference on Internet of Things and Big Data
342

only values within one current row of the table.
Even if a column contains a value identifying some
other row in another table, it is not possible to make
use of it. For example, if the table
LineItems has a
column
orderNo with the order this item belongs to
then we cannot use it in the formula for accessing
the corresponding record from the table
Orders
because it is simply a value and not a reference.
How this limitation can be overcome is described in
the next section.
4 LINK COLUMNS
Effective data analysis can be performed only if
arbitrary data in the current state can be accessed
and used for computing new data. Let us assume that
the price is specified in a table
Products rather than
LineItems but each line item stores a product
identifier. Conceptually, the task is very simple: we
need to find the corresponding product record and
then retrieve its price using dot notation:
amount.setFormula(
"this.[productId].[price]*this.[quantity]"
);
Yet, technologically it is not a trivial task because
the
productId column stores string values and the
system does not know that these values represent
records from another table. Therefore the above
formula will not work.
The classical approach to this problem consists
in providing a join condition. It is a predicate which
is true if two records are related. This join condition
is then used to produce a new table with related
records.
DataCommandr follows a different approach.
The idea is to define a new column which directly
references records from another table. In other
words, instead of specifying a join condition at the
query level, we define a new column in the schema
and then use it in other expressions precisely as all
other columns. In our example, the goal is to define
a column returning records from the
Products table
and hence
Products will be its type:
DcColumnproduct=createColumn(
"product",LineItems,Products
);
For each record of the LineItems table, this column
will return a record from the
Products table.
The main difference of this column is that it
returns tuples rather than primitive values returned
by numeric columns. Tuple is a syntactic construct
of COEL which encloses several members and is
written in double parentheses. Each member has a
type, column name and value as a COEL expression.
A link column in our example could be defined as
follows:
product.setFormula(
"((Stringid=this.[productId]))"
);
This tuple has one member of the String type,
named
id and its value is equal to the productId
column of the current record. For each
productId
from the
LineItems table, this expression will return
a record with the same
id from the Products table.
Now the
product column can be used in expressions
to directly access records from the
Products table.
In particular, the
amount column of the LineItems
table can be defined using the new
product column:
amount.setFormula(
"this.[product].[price]*this.[quantity]"
);
Tuple definitions are similar to join conditions and
can be easily translated to join conditions, for
instance, if it has to be executed in a relational
DBMS. Yet, there are fundamental differences
between joins and links. In link columns, we define
a mathematical function by specifying how its
outputs are built from inputs and this function is a
formal representation of a new column. Joins on the
other hand are predicates which determine if a
proposition is true or false. Note also that our
approach allows for specifying more complex tuples
including nested tuples with their own expressions.
5 TABLE POPULATION
Column is a mathematical function, that is, a
mapping from one input set to one output set. One
problem here is that these two sets have to exist
before a column can be defined. Therefore, table
(set) is a primary notion while column is a secondary
(dependent) notion. If we want to develop a purely
column-oriented approach then it is necessary to
resolve this controversy. In this section, we describe
how tables are populated by using only column
definitions without the need in separate table
definitions. There are three mechanisms for table
population: filter, product and projection.
Filter. The first approach consists in applying a
filter to an existing table by selecting a subset of its
records. DataCommandr uses a classical solution
where it is necessary to provide a predicate and the
DataCommandr: Column-oriented Data Integration, Transformation and Analysis
343

output table will contain only records for which it is
true. For example, if we want to find line items with
the amount less than 100.0 then first we create a new
table for the selected records:
DcTableCheapLI=
createTable("CheapLI",LineItems);
Here the second parameter is a super-table. The use
of super-tables is optional but it is rather convenient
because the new (child) table will automatically
“see” all the parent columns. In fact, any table in
DataCommandr has one super-column (Savinov,
2012b) which in this case points to the
LineItems
table. Now we simply provide a filter predicate as a
COEL expression:
CheapLI.setWhere("[amount]<100.0");
There are two features that differ this mechanism
from the conventional filtering:
The new table will contain only references to the
records selected from the parent table (in its
super-column) and no other parent columns will
be copied. In contrast, the conventional way of
filtering consists in copying the original data to
the new output table.
Although the predicate is part of the table
definition, it is treated as a special (boolean)
column which returns true or false. Formally, a
filter predicate is treated as a function from this
set to the boolean domain and hence it still
conforms to the principles of column-orientation
(no table operations).
Filtering can be done without the use of the super-
table but then it is necessary to explicitly add a
column which will point to the original table:
DcTableCheapLI=createTable("CheapLI");
DcColumnlineItem=createColumn(
"lineItem",CheapLI,LineItems
);
Now the predicate has to explicitly use this column
pointing to the original table for selecting records:
CheapLI.setWhere(
"lineItem.[amount]<100.0"
);
Product. This operation has the classical definition
and is intended to produce all combinations of
records from the input tables. However,
DataCommandr does not provide a dedicated
product operation (because it is a column-oriented
approach). Rather, any table will be automatically
populated with all combinations of input records
referenced by key columns. In other words, if a table
has several key columns then it will be automatically
populated with all combinations of their output
values. This mechanism will exclude records which
do not satisfy the filter as well as ingnore primitive
(infinite) key columns. Also, it will not be used in
the case this table is populated via projection (see
below).
For example, if we want to build a 2-dimensional
cube of all product categories and departments then
it is done by creating a new table and adding two
columns:
DcTableCube=createTable("Cube");
DcColumncategory=createColumn(
"category",Cube,Categories
);
DcColumndepartment=createColumn(
"department",Cube,Departments
);
The system will automatically populate this table
with all combinations of product categories and
departments. We can always add a filter to this table
and/or add measure columns with aggregations for
OLAP analysis (see next section).
Product operation in DataCommandr has the
following distinguishing features:
Product table does not copy data from the input
tables but rather stores references to their
records. For comparison, the relational model
defines product differently by flattening the
result and copying the data.
Product with a filter can be formally used for
joining tables but in DataCommandr it is
considered an anti-pattern or bad design. Product
is supposed to be used only for building a multi-
dimensional space in OLAP, and not for linking
and connectivity. For comparison, the relational
model uses product as a basis for the join
operation which is then used as a formal basis for
connectivity.
Project. One very important pattern used in
querying and data processing consists in finding all
unique records. For example, given a table with
transactions, we might want to find all unique
product categories or all unique departments, and
store them in another table. The output table is then
populated with new records which are obtained from
the original table. In the relational model, this
pattern is implemented using projection which is a
set operation. It takes several columns as parameters
and results in a new relation with only unique tuples
in these columns.
DataCommandr uses a novel approach where one
IoTBD 2016 - International Conference on Internet of Things and Big Data
344

column can be used to populate a new table by using
its output values. If a column is a function from table
A to table B then the outputs produced by this
function can be used to populate the target table B.
This column has to return tuples compatible with the
structure of table B precisely as it is done when
defining link columns (Section 4). If an output tuple
has been found in the target table then the column
simply references this existing record. If the output
tuple has not been found then a new record is added.
Note that only unique records are added and this is
why this mechanism works as the relational
projection. For example, all product categories in the
LineItems table can be found as follows:
DcTableCategories=
createTable("Categories");
DcColumncategory=createColumn(
"category",LineItems,Categories
);
categories.setFormula(
"((id=this.[categoryId]))"
);
After evaluating this formula, the output table
Categories will be populated with tuples consisting
of one
id field and it will contain only unique
category ids. Note also that the category column of
the
LineItems table will contain direct references to
the records from the new
Categories table.
6 ACCUMULATION
In this section, we describe how data can be
processed by selecting subsets of values from one
column as opposed to processing values from the
fields of one row. This generic analysis pattern is
called grouping and aggregation because it consists
of two steps. First (grouping), it is necessary to
break all records into subsets, called groups. Second
(aggregation), all individual groups have to be
processed by returning one data value for a group.
DataCommandr implements this analysis pattern
by means of the
ACCUMULATION operator. Grouping
of records is performed similar to other approaches
where each fact is assigned a group. In
DataCommandr, it is done by specifying a COEL
expression which returns a primitive value or an
element of another table interpreted as a group. For
example, if we want to group line items then a group
could be assigned by the expression
[product].[category] which returns an element
of the
Categories table. Note that the group here is
not a primitive value but rather an element from
another table.
Another parameter of the
ACCUMULATION
operator, called measure, is a property that has to be
aggregated. It is also provided as a COEL expression
which normally returns a numeric value. For
example, if we want to find total amount for each
category then the measure is specified as one
column
[amount]. We could also specify measure as
an in-line formula
[price]*[quantity].
The main distinguishing feature of this approach
is how data is being aggregated. A typical approach
is to specify an aggregation function which
processes a subset of values of the measure.
DataCommandr introduces the notion of an
accumulation function which updates the current
value of the column for each new value of the
measure (rather than overwrites it). For example,
such an accumulation function for summing up
numbers could be implemented as follows:
DoubleSUM(Doublevalue){
returnthis+value;
}
A column defined in this way will be able to
accumulate multiple values rather than to simply set
one single value computed by the formula. To
compute the final value of such a column it is
necessary to evaluate it for each element of the
group. The main benefit is that it is possible to
provide arbitrary user defined aggregation functions
without writing an explicit loop for processing
elements of the group.
Figure 3: Data accumulation in DataCommandr.
For example, let us assume that we want to find
total amount paid for each product category by
aggregating data in the
LineItems table. According
to the DataCommandr conception, the goal is to
define a new (Double) column of the
Category table
which will store the sums computed for all line items
belonging to this category. This task is performed by
defining a new column using
ACCUMULATE operator
Double
Products
LineItems
category
Accumulatedcolumn:
total=ACCUMULATE(
facts=[LineItems],
groups=[product].[category],
measure=[amount],
accumulator=SUM)
Categories
product
amoun
t
tota
l
DataCommandr: Column-oriented Data Integration, Transformation and Analysis
345

which has four arguments (Fig. 3):
DcColumntotal=createColumn(
"total",Categories,Double
);
total.setFormula("ACCUMULATE(
facts=[LineItems],
groups=[product].[category],
measure=[amount],
accumulator=SUM)");
The facts parameter specifies a table with all the
records to be processed. The
groups parameter is a
definition of a column of the facts table which
returns a group. Note that in this example, we used
an intermediate table to compute a group for each
line item, that is, a line item has a
product which
belongs to some
category. The measure parameter
is also a column definition of the facts table but its
purpose is to return some value to be accumulated.
And the fourth
accumulator parameter is essentially
a definition of the new
total column and its
purpose is to specify how the currently stored value
will be updated. In this case, we used a predefined
function name
SUM which means that the total
column will add a new measure value to the
currently stored value for each new group element.
In the general case, it can be an arbitrary expression
which updates the current value of the column.
This approach to aggregation has the following
distinguishing features:
Both the grouping criterion and the measure can
be COEL expressions as opposed to using only
primitive columns for groups and measures in
the conventional group-by operator. This feature
is especially important for complex ad-hoc
analytics.
Aggregation is a column definition rather than a
special query construct. Such columns update
their currently stored value for each new group
element rather than overwrite the previous value.
7 CONCLUSIONS
In this paper, we presented a conception and
described an implementation of a novel approach to
data integration, transformation and analysis, called
DataCommandr. It is aimed at ad-hoc, agile and
explorative data processing but as a general-purpose
technology, it can be applied to a wider range of
tasks. This approach is based on the concept-
oriented model of data and its main distinguishing
feature is that it relies on column transformations as
opposed to table or cell transformations.
There are two major benefits of using
DataCommandr:
Development Time. It decreases development
time, maintenance costs, semantic clarity and
quality of code. COEL is not only a concise
language but it also allows for better modularity
of code. COEL is simpler and more natural
language which is very close to how spreadsheet
application work but having the power of
relational query languages when working with
multiple tables and complex relationships.
Run Time. DataCommandr can increase
performance at run time because operations on
columns are known to be much faster for
analytical workloads in comparison to row-
oriented data organization. The new mechanisms
of links and aggregation can decrease data
processing time by avoiding unnecessary copy
operations.
In this paper, the focus was made on the conception
and logical organization which are important for
agility of ad-hoc analytics. In future, we plan to
focus on run time issues like performance of in-
memory operations, partitioning, job management,
fault tolerance and scalability.
REFERENCES
Atzeni, P., Jensen, C.S., Orsi, G., Ram, S., Tanca, L., &
Torlone, R., 2013. The relational model is dead, SQL
is dead, and I don’t feel so good myself. ACM
SIGMOD Record, 42(2), 64–68.
Abadi, D.J., 2007. Column stores for wide and sparse data.
In Proceedings of the Conference on Innovative Data
Systems Research (CIDR), 292–297.
Boncz, P. (Ed.), 2012. Column store systems [Special
issue]. IEEE Data Eng. Bull., 35(1).
Chaudhuri, S., Dayal, U. & Narasayya, V., 2011. An
overview of Business Intelligence technology.
Communications of the ACM, 54(8), 88–98.
Cohen, J., Dolan, B., Dunlap, M., Hellerstein, J.M.,
Welton, C., 2009. Mad skills: New analysis practices
for big data. In Proc. 35th International Conference
on Very Large Data Bases (VLDB 2009), 1481–1492.
Copeland, G.P., Khoshafian, S.N., 1985. A decomposition
storage model. In SIGMOD 1985, 268–279.
Dean, J, Ghemawat, S., 2004. MapReduce: Simplified
data processing on large clusters. In Sixth Symposium
on Operating System Design and Implementation
(OSDI'04), 137–150.
Kandel, S., Paepcke, A., Hellerstein, J., Heer, J., 2011.
Wrangler: Interactive Visual Specification of Data
Transformation Scripts. In Proc. ACM Human Factors
in Computing Systems (CHI), 3363–3372.
Krawatzeck, R., Dinter, B., Thi D.A.P., 2015. How to
IoTBD 2016 - International Conference on Internet of Things and Big Data
346

Make Business Intelligence Agile: The Agile BI
Actions Catalog. In Proceedings of the 48th Hawaii
International Conference on System Sciences
(HICSS'2015), 4762–4771.
Morton, K., Balazinska, M., Grossman, D., Mackinlay, J.,
2014. Support the Data Enthusiast: Challenges for
Next-Generation Data-Analysis Systems. In Proc.
VLDB Endowment 7(6), 453–456.
Russo, M., Ferrari, A., Webb, C., 2012. Microsoft SQL
Server 2012 Analysis Services: The BISM Tabular
Model. Microsoft Press.
Savinov, A., 2014a. ConceptMix: Self-Service Analytical
Data Integration based on the Concept-Oriented
Model. In Proc. 3rd International Conference on Data
Technologies and Applications (DATA 2014), 78–84.
Savinov, A., 2014b. Concept-oriented model. In J. Wang
(Ed.), Encyclopedia of Business Analytics and
Optimization. IGI Global, 502–511.
Savinov, A., 2012a. References and arrow notation instead
of join operation in query languages. Computer
Science Journal of Moldova (CSJM), 20(3), 313–333.
Savinov, A., 2012b. Concept-oriented model: Classes,
hierarchies and references revisited. Journal of
Emerging Trends in Computing and Information
Sciences, 3(4), 456–470.
Zaharia, M., Chowdhury, M., Das, T. et al., 2012.
Resilient distributed datasets: a fault-tolerant
abstraction for in-memory cluster computing. In Proc.
9th USENIX conference on Networked Systems Design
and Implementation (NSDI'12).
DataCommandr: Column-oriented Data Integration, Transformation and Analysis
347
