
Utilization of the Internet of Things for Real-time Data Collection
and Storage of Big Data as it Relates to Improved Demand Response
Shawyun Sariri, Volker Schwarzer and Reza Ghorbani
University of Hawai’i at Manoa, 2540 Dole Street Homes Hall #302, Honolulu, HI, U.S.A.
Keywords: Demand Response, Load Forecasting, Power Profile, Smart Power Meter.
Abstract: Demand response programs are viewed as a solution to counter the increasing demand in energy consumption,
as well as a way to combat the stochastic nature of renewable sources within the current grid infrastructure.
In order to apply an efficient demand response program, it is first necessary to understand the power
consumption behaviours within a power grid system. Obtaining large quantities of consumer power
consumption data will al-low the ability to tailor a demand response program to efficiently implement control
decisions in real-time. The programs are a cost effective alternative to high priced spinning reserves and
energy storage. The focus of data collection will be on dense urban environments, which provide a number
of factors that can be evaluated as they relate to an efficient demand response program. The island of Oahu
was the location of a pilot program to test the feasibility of large data collection and storage. A smart metering
device collected high resolution data, which was transmitted to a server where load forecasting and peak
shaving decisions could be calculated. The design of the pilot system and initial results of the large data
collection are discussed.
1 INTRODUCTION
American utility companies are currently trying to
meet increased energy demand with an aging, and
sometimes overloaded, power infrastructure. The
American Society of Civil Engineers (ASCE)
estimates that the current power grid would need a
$107 billion investment to remain operational
(Halsey, 2012). A main concern for utilities is the
need to meet the expected increase in energy demand
after 2020. A suggested option to alleviate this
pressure is to integrate more renewable energy
sources into the consumer sector of the grid system.
However, the stochastic nature of renewable sources
combined with the use of an aging infrastructure
creates logistical issues that must be solved before
efficient renewable energy penetration can be
accomplished. The ASCE has suggested using real
time forecasting and smart grid implementation to
better manage power loads to create a more reliable
and efficient power delivery system (ASCE, 2013).
Distributed generation (DG) can be a reliable and
cost efficient solution for customers in dense urban
centres. Installing renewable energy sources at DG
sites allows for a more environmentally friendly
alternative to fossil fuels (IRENA, 2013). Hybrid
renewable systems being used as distributed
generation (DG) provide a way for utility companies
to move peak loads and deliver reliable power
transmission (Salameh and Davis, 2003).
However, with more DG generation becoming
interconnected into the current grid infrastructure,
and DG sources potentially feeding power back into
the current grid system, utilities will need to be able
to better monitor different points within the grid to
ensure grid stability. Advances in technology will
only reduce the cost of renewable energy
infrastructure, allowing for increased renewable
energy penetration and interconnection into the
existing grid. It will be necessary to collect large
amounts of data that can be processed and analysed,
which will grant the capability to analyse real time
grid states and predict future occurrences. Processing
the large amounts of data related to power
consumption will lead to the creation of efficient
demand response algorithms that can better manage
and shift loads based on consumer activity.
Utilities companies must become power brokers
with the ability to manage energy production on both
the supply and demand side of the power grid. In the
following sections, this paper will discuss the
232
Sariri, S., Schwarzer, V. and Ghorbani, R.
Utilization of the Internet of Things for Real-time Data Collection and Storage of Big Data as it Relates to Improved Demand Response.
DOI: 10.5220/0005878002320242
In Proceedings of the International Conference on Internet of Things and Big Data (IoTBD 2016), pages 232-242
ISBN: 978-989-758-183-0
Copyright
c
2016 by SCITEPRESS – Science and Technology Publications, Lda. All rights reserved
implementation of a pilot system with devices (smart
meters) that can collect large amounts of data for
large scale computational processing. System
analysis of the grid states can create energy
management strategies through demand response
programs, thus creating a cost effective and reliable
environment as it relates to the power grid.
1.1 A Smarter Grid
The transition to a “smarter” grid will grant utilities
the ability to become more proactive in how they
manage power supply in the transmission
infrastructure. In the past, utility companies have
needed to increase spinning reserves, and invest in
generators with faster start up times to counter
intermittent generation created by renew-able energy
sources (NREL 2012, Wesoff 2013, IRENA 2013).
Demand response is an option to alleviate the issues
that come with renewable energy penetration, and are
an alternative to costly large scale energy storage
(IRENA 2013, Barai et al., 2015). Even though there
has been research into the feasibility of renewables
into the current grid infrastructure, utilities and
policymakers find themselves still requiring ways to
understand the benefits and drawbacks of demand
response programs (Lew et al., 2013, FERC, 2008).
The North American Electric Reliability
Corporation categorized demand response as a
“subset” of Demand-Side Management (DSM),
which looks to create efficient energy programs
focused on the consumer end (node) of power
consumption (NAERC, 2007). Many current grid
infrastructures have a utility generating energy at a
plant, and sending it through a network to the
consumer (Energy.gov 2015). In a demand response
program, the consumer has a direct connection to the
utility, whether it be through Direct Control Load
Management (DCLM), or and Interruptible Demand.
DCLM involves the utility having the ability to
remotely turn on/off, or cycle devices within a home,
or business, thereby reducing demand on the
consumer side. Interruptible demand is an agreement
between the consumer and the utility where the utility
can request that a consumer curtail their energy use
during peak hours, or have the ability to remotely trip
devices within the consumers property as long as
notice is given be-forehand. In exchange, a consumer
will receive discounts and/or credits towards their
energy bills.
Because demand response is relatively new
solution to controlling peak loads, large data
collection with high sampling rates will be necessary
to provide as much detailed data as possible. The
necessity for large amounts of data comes from the
fact that there is still a lack of experience with long
term demand response programs (O’Connell et al.,
2014).
Demand response for a large urban area is hard to
model as it is complex and multi-layered, so data is
needed to properly simulate demand response in a
densely populated area (O’Connell et al., 2014). To
better understand the factors that affect demand
response programs, data relating to consumer
behaviours, as well as external factors such as
weather, price sensitivity, and the changing of
seasons must be obtained, and researched. An outline
of the demand response logic as it pertains to the pilot
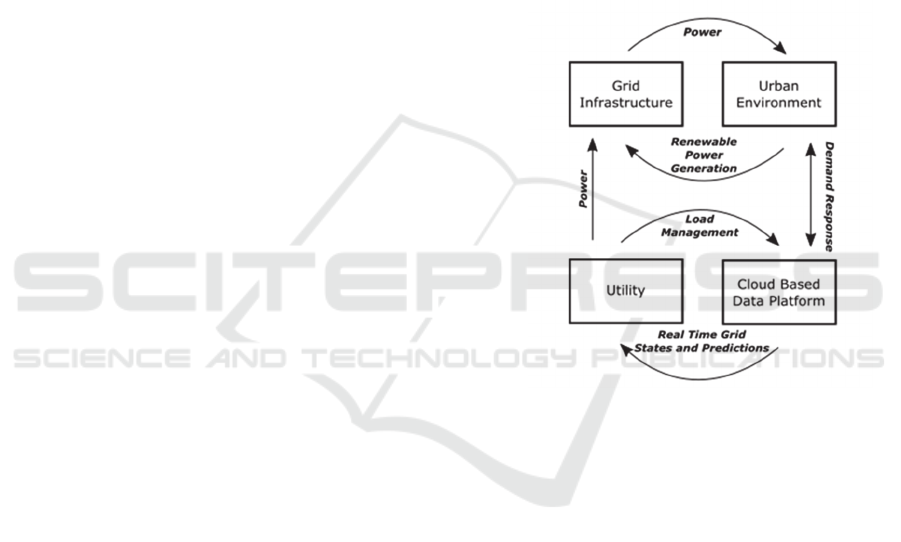
system is displayed in Figure 1.
Figure 1: The system demand structure for a data collection
system is presented. A cloud based platform will store and
analyze data collected from a home, or business, in real-
time, allowing for quick control decisions in demand
response programs.
Devices that measure power consumption have
been used in research, however, most studies do not
offer high frequency data with the resolution to detect
small transient changes. Current research on the pilot
system collects and analyses data at higher
resolutions. A 1Hz resolution, or better, will provide
a good sampling rate for large data collection and the
ability to see transient patterns in power usage, such
as the warming of a stove, or the brightness of a
television. Results from the pilot system have shown
that different devices such as a stove top, or a water
heater, create a specific power profile signature when
their power draw is monitored. This signature can be
thought of as a “power fingerprint.” Having the
ability to determine device usage from power data
allows cost efficiency in power monitoring because
Utilization of the Internet of Things for Real-time Data Collection and Storage of Big Data as it Relates to Improved Demand Response
233

rather than installing a power monitoring meter on
each device within a building, software can instead
analyse and determine which devices on a property
are in use based on the power signatures found within
an aggregate power data set for an entire home, or
business.
Power producers will be able to monitor a home,
or business, and understand which devices can be
cycled during peak loads to relieve grid pressure,
especially in high energy consumption areas like
urban centres where large percentages of a population
tend to live. In order to accomplish this, a device is
needed to record a consumer’s power usage. A pilot
program has been created at the University of Hawai’i
that currently involves monitoring aggregate power
usage from 20 homes on the island of Oahu using a
smart power meter (SPM). The components,
challenges and scalability of the pilot system will be
discussed, as well as future work pertaining to
demand response programs, which will be discussed
in the following sections.
1.2 Related Research
The study and feasibility of demand response as it
relates to power grids is ongoing, and the pilot
program looks to contribute to that research in the
areas of large data collection, storage and analysis
(FERC 2008, NAERC 2007).
Demand response programs allow for increased
peak load reduction as well as the ability to balance
supply and demand of energy in power grids (FERC,
2008). Stability and load shifting are two factors that
are important in maintaining grid stability, which can
be accomplished through demand response programs.
Cost efficiency is another benefit of demand response
because there is no need to maintain spinning reserves
and large power storage infrastructure (NREL 2012).
Similar research is being done on smart meters to
collect and analyse data. A group from the University
of Bath investigated the use of smart metering devices
in combination with voltage control techniques. Their
re-search focused on analysing the consumer side of
demand response as a way to create cost efficiency
for a consumer as well as a tool to restore grid system
faults and maintain transmission stability. The Lon
Local Operating System (LonWorks) and ZigBee
Wireless Network Standard were two suggestions for
creating a system of communication between smart
meters and controllers to handle real-time data (Gao
and Redfern, 2011).
A research group in Europe proposed the use of
local area networks (LAN) and wireless local area
networks (WLAN) in combination with KNX
communication standards as an option to set up
communication between smart metering devices. The
use of ZigBee and KNX components were deemed
feasible to monitor load consumption of devices in
order to create a timetable of shiftable loads. The load
shifts refer to the rescheduling of device usage from
peak hours to times that do not provide large strains
on the grid. Real-time analysis and visualization
would allow consumers to make the proper choices in
energy consumption that are related to cost
efficiency. An algorithm based on tariffs was the
basis for the load timetables (Kunold et al., 2011).
Researchers in Canada proposed a smart metering
system based on load disaggregation where a power
signal is analysed into the various device components
that produce it. Their research focused on the factors
that affect load disaggregation such as noisy signals,
simultaneous loading, computational costs and
privacy issues. They noticed that devices produced
different power signals when cycled, for example,
constant vs. periodic loads. To train algorithms in
detecting a device, the research group suggested
algorithm training based on probabilities and the
clustering of individual devices. The research group
deemed the definition of deferrable actions as
necessary in their proposed system. Deferrable
actions are those relating to devices whose utilization
is not a priority and cycling can instead be scheduled
at an alternative time, which would allow for load
shedding. These devices include washer/dryers,
ovens and dishwashers (Makonin, 2013).
A UK-based power utility, National Grid, looked
into the affect the power usage of certain devices had
on the grid. They found that millions of kettles are
cycled around 5pm, knowledge such as this allows a
utility to know when to cycle specific loads within
home. National Grid uses the aforementioned
knowledge to maintain grid frequency. Aggregating
these cycling patterns with the loads of other houses
in a neighbourhood, or region, allow for the ability to
maintain grid stability throughout sections of a power
grid (National Grid, 2015).
2 SPM PILOT SYSTEM
Because of the island’s geography and dense
population, Oahu provides an ideal location to
understand renewable energy penetration into an
existing power grid, and how it relates to demand
response programs. Several factors allow for Oahu to
be the location to implement the pilot system, these
factors include high solar radiation on the island,
access to a dense urban populations, and Oahu being
IoTBD 2016 - International Conference on Internet of Things and Big Data
234
an isolated power grid. In 2015, the Hawaii state
legislature voted to have 100% energy generation
from renewable sources by 2045 (Press Release 2015,
Namata 2015). Hawaii’s commitment to alternative
energy sources allows for a continued study of an
urban area with high renewable energy generation,
and the effects of this generation on demand response.
Because most buildings have circuit breaker boxes, a
common interface is already in place to install the
SPMs. The device collects data at one-second
intervals and sends it through a local WiFi network to
a remote cloud server using a SSH tunnel. Data
storage, analysis, forecasting and control can all occur
within the cloud. The server will have the ability to
send control signals based on analysis of the power
data to the consumer, where an installed client can
cycle devices in accordance with demand response
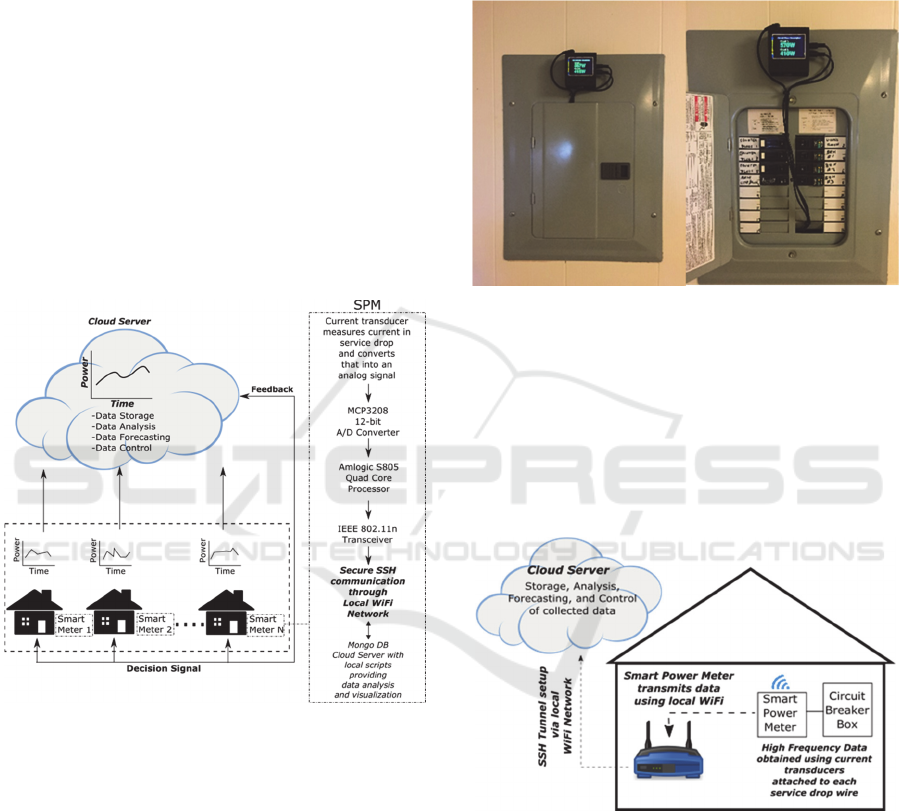
programs to reduce peak loads. Figure 2 illustrates the
overall pilot system.
Figure 2: The setup of the proposed system implements a
SPM to monitor and transmit data from a circuit box. Data
is then transmitted to a server for analysis. The current
server can be scaled to cloud storage, so that more nodes
can participate in the pilot program and provide more data
for load forecasting analysis.
2.1 Data Acquisition
The data acquisition is performed by a power
metering device at the local consumer level. The
device can fit within a circuit breaker box, is non-
invasive, and allows for easy installation, setup and
maintenance while delivering accurate power
measurement, data pre-processing and server
communication. The SPM is powered through the
circuit breaker box. Two current transducers, one
connected to each service drop wire within the circuit
breaker box, measure current signals, which are
transformed into analog voltage signals, and sent to a
MCP3208 12 bit analog digital converter (ADC),
which collects data at 80kSps. Images of an installed
device are shown in Figure 3.
Figure 3: A SPM meter is installed in the circuit breaker
box of a home taking part in the pilot project.
An Amlogic Quad Core processor computes the
power consumption for each phase. Power is
calculated assuming a constant voltage. The median
power pertaining to one second of collected data is
obtained for each phase, and sent to the cloud server
for storage and analysing. Figure 4 describes data
collection and transmission on the consumer level.
Figure 4: Utilizing pre-existing WiFi connections within a
home allow for a cost effective solution for data
transmission. Circuit breaker boxes are usually located in a
remote area of a building, so it is necessary to utilize a
wireless connection to allow for a robust system to monitor
and transmit data from a node. A secure SSH connection
allows for safe and reliable transmission of data to a server
in real-time.
2.2 Communication
After the power data is collected and pre-processed
by the SPM, the data is then transmitted to a remote
Utilization of the Internet of Things for Real-time Data Collection and Storage of Big Data as it Relates to Improved Demand Response
235

server using a secure SSH tunnel via a local WiFi
network. The advantage of this communication setup
is that the SSH tunnel provides an added layer of
security for what is confidential information. While
the utilization of a pre-existing local WiFi connection
takes advantage of an already existing network, thus
eliminating the added cost of building a new
communication infrastructure. Data is stored directly
into a MongoDB database hosted on a cloud server.
Because data is being sent from multiple locations,
each data set needs to be identified by the node it
originated from, this is accomplished when the SPM
assigns a node identifier to each outgoing data set.
When there is a disturbance in the WiFi connection,
or a communication delay, the SPM will buffer until
a connection is re-established to minimize data-loss.
Despite the 1Hz transmission rate of the SPM,
bandwidth and storage requirements are kept
minimal. Each database query consists of just three
integers, which total 24 bytes of data per second on a
64 bit system. Households are currently transmitting
approximately 2MB/d. The island of Oahu has a
population of approximately 950,000, assuming
200,000 households, 400 GB of power data would be
sent to the servers each day at a rate of 4.63MB/s.
2.3 Data Storage/Analysis
The MongoDB database on the cloud server, is a
document based open-source database. It is utilized
as a multiuse agent that acts as a central node where
large amounts of power data is collected, streamed
and queried for data analysis of real-time system
states and forecasting.
Document based databases yield high scalability
and data storage flexibility, which is quintessential
for power analysis of large complex urban centres.
Streams of real-time and recent data, as well as data
queries for historical data must be performed as
efficiently as possible to create predictions that will
analyse data in real-time, thus allowing for fast and
efficient conclusions and decisions. These
conclusions will be utilized in future work to create
control decisions to be sent back to the consumer
where devices within a property can be con-trolled
using a client. Thus granting the ability to create
forecasts that enable efficient demand response pro-
grams to be implemented, which will reduce peak
loads and ensure reliable power transmission within
the grid infrastructure.
2.4 Control
Future work revolves around enabling the cloud
server to analyse real-time and historic data in order
to determine, and send control decisions for demand
response programs. Smart control decisions enable
the ability to better ensure grid stability and power
transmission reliability. These commands include,
but are not limited to, ON/OFF commands, as well as
time constraint commands. The control clients
executing the commands will have the ability to send
feedback data to the cloud. The server itself can be
utilized by the consumer as an interface to monitor
power consumption, or override control decisions.
3 DATA ANALYSIS
Data collection is currently in progress using a total
of 20 nodes and has been ongoing since August 2015.
Participants volunteered (not compensated) to
participate in the study and the household sizes range
from two to six members. The backgrounds of the
various participants are varied, however, specific
details are kept confidential for privacy reasons.
There was no criteria for selecting participants, the
only requirement was that they had an accessible
circuit breaker box within their home.
Each phase in the circuit breaker box is measured,
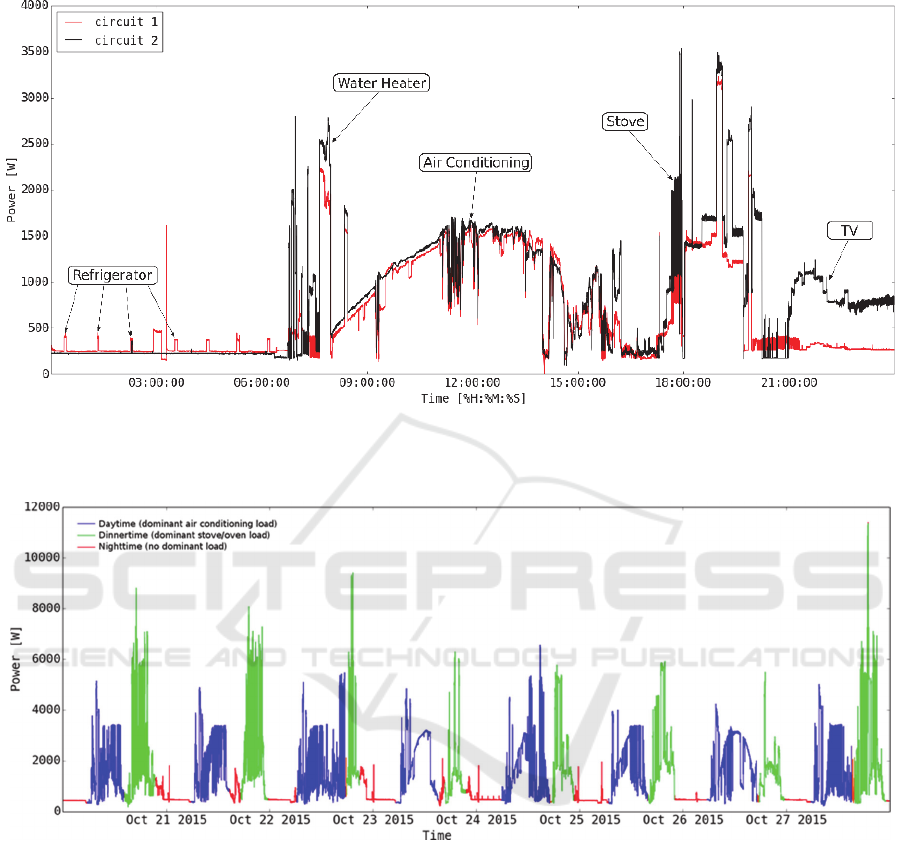
and the power for each phase is plotted. Figure 5 gives
an example of data from a node for one day. Phase
one and two are plotted in red and black, respectively.
It can be seen that there are unique device
signatures throughout the day, which correspond to a
combination of specific devices within the node. In
the displayed example, from midnight to 7 am, the
only signal that stands out is the refrigerator cycling,
which is due to the fact no other major loads are
present at the respective time interval. During the day
air conditioning is the dominant load, which
correlates to the heat in Oahu at mid-day. Evening
loads are dominated by consumer electronics such as
TV.
Detailed power profiles over extended time periods
grant an observer the ability to understand the energy
needs of a consumer and predict when to schedule
loads. Such is the case in Figure 6 where a week of
data has been plotted.
The node displays a clear pattern of power
consumption throughout a week. Dominant loads
throughout the day are shown in blue and green,
correlating to air conditioning and dinner-related
activities, respectively. The family exhibits a fixed
pattern of power consumption throughout the week
that can be used for load prediction. Air conditioning
loads dominate the day while cooking-related
IoTBD 2016 - International Conference on Internet of Things and Big Data
236
activities dominate evening loads. The two main load
patterns stemming for air conditioning and cooking
.
Figure 5: Devices produce specific power signatures when in use. It can be observed when certain devices are cycled. The
cycling of loads within a node displays the behaviour and patterns of a consumer that can be used to predict and schedule
power generation.
Figure 6: One week of total power consumption is plotted for one family home. Consumer pattern behaviour is evident from
the increases in power consumption.
are repeated daily throughout the week. Nighttime
loads are reduced to a bare minimum because of
inactivity at night.
Devices show different patterns of power draw
when plotted in the time domain, as shown in Figure
7.
Aiding in the study of demand response it the fact
that each device produces a specific power signature,
or fingerprint, when Fourier analysis is performed on
the plotted time dependent power signal obtained by
the SPM, which was shown in Figure 7. Fourier
analysis can be applied to the time dependent power
draws like those from Figure 7, which produce signals
Utilization of the Internet of Things for Real-time Data Collection and Storage of Big Data as it Relates to Improved Demand Response
237
with distinct characteristics as shown in Figure 8.
To better distinguish the signals, another analysis,
known as power spectral density analysis (PSD) was
performed on the power signature data. PSD can
implement Fourier based methods to plot what can be
considered a random time signal in the frequency
domain, allowing the ability to determine what
frequencies within the signal contain the largest
energy densities relative to the surrounding ambient
signals. If periodicities exist in the spectrum, PSD
will allow them to be observed, these periodicities can
then be used to classify devices into categories.
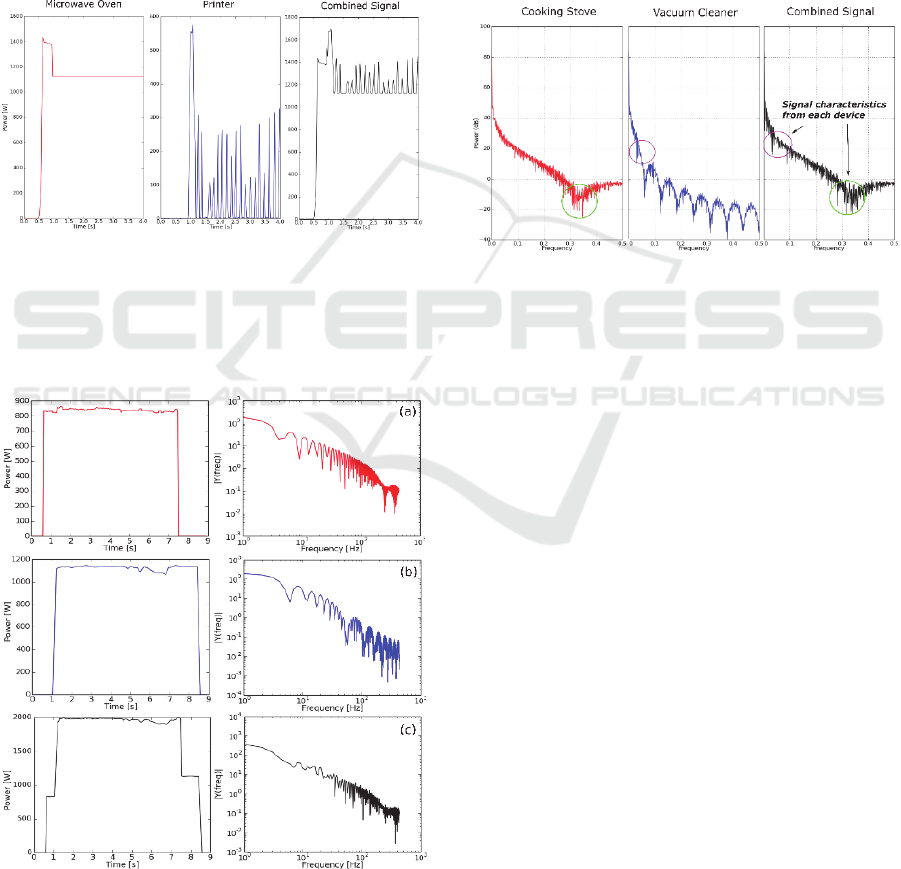
Figure 7: Two devices can be combined to create a time
dependent plot that features both signals, in this case a
microwave oven and a printer, however it can be seen that
the devices were recorded at different times, so it is
necessary to combine the signals into one aggregated
signature.
Figure 8: Once two device signals ([a]cooking stove,
[b]vacuum cleaner [c]combined signal) are combined they
can then be analysed in the frequency domain to better
understand if the signals exhibit a specific characteristic
pattern. The left column displays the time domain power
draw while the right column shows the power draw in the
frequency domain.
Using PSD, transient variabilities from the time
domain can be found in a frequency domain. Figure 9
highlights these variabilities using the cooking stove
and vacuum cleaner example from Figure 8.
When PSD analysis was implemented on the
power signatures of a cooking stove and vacuum
cleaner, two unique signals were plotted, which can
be seen in Figure 9. The ability to notice each device
in a combined signal further proves that specific
Figure 9: The implementation of PSD granted the capability
to observe unique device signatures that are visible in an
aggregated signal.
appliances can be sifted from a larger data set that
pertains to an individual node. The analysis is
necessary to provide accurate and efficient demand
response programs that can specifically target certain
devices during a day that are not in use, thus allowing
frequency stability within a power grid to be
maintained.
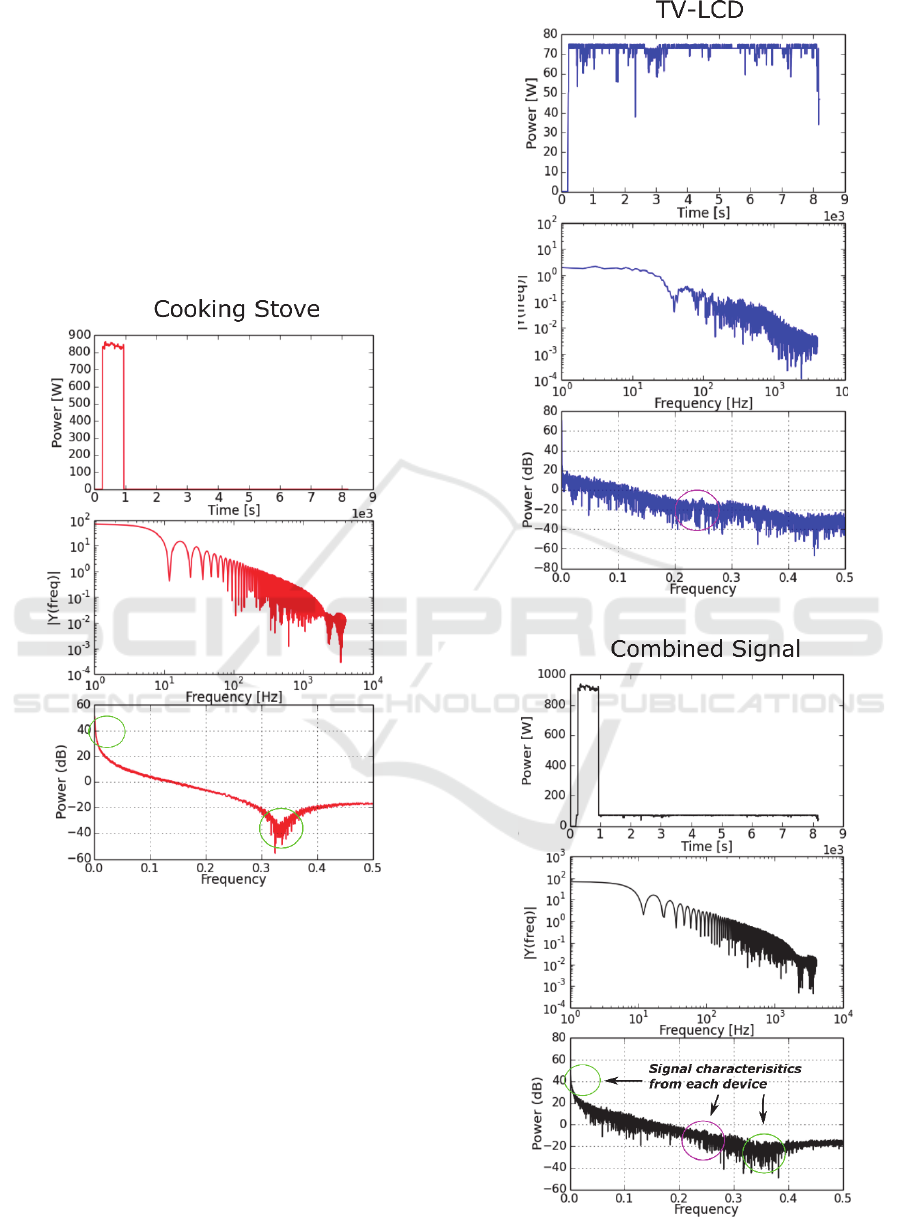
Figure 10 displays the FFT and PSD analysis of
another device combination. The first row of each
afore-mentioned figure displays the power signals in
the time domain for the devices, the FFT for the
respective power signals in row two, and the PSD
analysis in row three.
From Figure 10 it can be determined that
magnitude is a variable that can be utilized when
identifying devices in a large set of power data.
Because the cooking stove had a power magnitude
that was ten times that of the LCD TV when plotted
in the time domain, analysis from the FFT and PSD
reiterated this fact, proving magnitude as tool for
device identification when analysing time dependent
data in the frequency domain.
Self-learning algorithms, such as artificial neural
networks (ANN), can be taught to detect power
fingerprints in large data sets such as those shown in
IoTBD 2016 - International Conference on Internet of Things and Big Data
238
Figures 5 and 6. Knowing which devices are in use,
and when, will allow for scripts installed on a server
to calculate optimal load schedules to cycle devices,
such as water heaters and heating, ventilation, and air
conditioning (HVAC) units within a node (Ahmad et
al., 2016). Being able to distinguish when, and how
often, a consumer uses a device will enable a power
provider the ability to shed peak loads while not
creating an interruption to a consumer’s power usage.
The capability to cycle a load can be automated, so
that a client within a home can obtain decision signals
from a cloud based server and implement the signals
in real-time.
Utilization of the Internet of Things for Real-time Data Collection and Storage of Big Data as it Relates to Improved Demand Response
239

Figure 10: The first set displays the signal analysis for a
cooking stove, the second for a LCD TV, and the third for
the sum of the two signals. The green circle shows the
location of a specific attribute of the cooking stove PSD
signal in the aggregate, while the purple displays the
attributes pertaining to the LCD TV.
The results show that it is possible to determine
which devices are consuming power at a given time.
It is also clear that large quantities of data from a node
permit the observation of consumer patterns as they
relate to power usage. Combining the historical and
real-time power data from multiple nodes within a
section of the grid, allows a power producer to
understand the needs of the consumer while providing
efficient load management. However, it should be
noted that the observed data can be sensitive as it
displays patterns and behaviours of consumers, which
must remain confidential to protect privacy.
4 SCALABILITY
A large and flexible database is necessary for bulk
amounts of data being collected from an urban centre.
MongoDB is a “NoSQL” cloud database where large
data collection will be stored and analysed when the
pilot system is scaled.
A “NoSQL”, or “non SQL” database is an
alternative to the relational databases that use the
Structured Query Language (SQL). There are
alternative “NoSQL” databases such as Apache
Cassandra and Couchbase, but recent studies have
shown MongoDB to be more efficient in terms of
reduced latencies when it came to read and update
workloads (Scalability Benchmarking 2015,
Olavsrud 2015, Bhattacharjee 2014, McNulty 2014).
MongoDB contains a document database
architecture, which provides the flexibility needed for
scalability as the pilot system grows to include more
nodes.
The use of a single server would lead to scalability
issues as more data is collected and processed,
MongoDB overcomes these issues with the potential
to add more servers to accommodate large data as
well as the utilization of automatic sharding, meaning
that data is spread throughout multiple servers.
Automatic sharding permits data to be accessed
easier, and managed faster (Cattell, 2010). MongoDB
utilizes a flexible data model, which allows the
opportunity for easier development and scalability.
4.1 Data Security
Analysing data will grant the ability to understand the
behaviour of a consumer, and as the pilot system is
scaled up to include thousands of users within an
urban environment, it will be necessary to protect
sensitive information. The information is sensitive
because it can reveal what a person, or persons, are
doing at a specific time in the day. Many activities
can be monitored, such as a person cooking, taking a
shower, or working on the computer. It can also be
determined when a person is home based on their air
conditioning and heating usage. The monitoring of
data can even analyse the power spectrum of a
television, allowing for the TV power signal to be
compared to the TV signatures of known channels,
and from there determine what TV programs a person
is watching. Unauthorized disclosure of this
potentially sensitive information could allow an
unauthorized agent to study the habits and routines of
an end-user, thus creating potential threats to the
privacy of the consumer.
Currently, the pilot system utilizes a single server,
however, when scaling up the system to include
consumers from a dense urban population, a cloud
server will be used. Once the computational and
storage limits of the single server are reached, the
pilot system will be scaled to cloud computational
storage. The use of cloud services has been increasing
due to a number of factors, some of these factors
include; the potential for scalability, geographic
reach, cost savings and higher availability
(Rightscale, 2014). With the growth of cloud service
and usage comes the need to address potential for
security risks.
4.2 Vulnerabilities in Cloud Security
There are many vulnerabilities that are associated
with cloud server use, a few will be mentioned to
provide a foundation for future security protocols.
4.2.1 Data Interception
Data interception is a key concern because a large
number of consumers will be sending sensitive data
to a cloud server in the range of seconds. To remedy
this, a secure shell (SSH) will implemented in the
transfer of data from the consumer to the cloud. A
SSH provides data encryption and the ability to
implement a proxy for added security (ENISA, 2009).
IoTBD 2016 - International Conference on Internet of Things and Big Data
240

4.2.2 Data Leakage
There is potential for data within MongoDB to be
leaked to unauthorized users, however, the
developers of MongoDB look to actively recognize
and address any issues relating to data leakage, which
are usually related to versions of MongoDB that are
outdated and unpatched. Other ways to prevent data
leakage is using proper encryption methods, and
recognizing when and where data is sent, so that it can
be properly monitored. Physical protection of servers
and personnel screening provide added security
benefits (ENISA, 2009).
4.2.3 Insecure or Ineffective Deletion of
Data
When deleting data from a cloud server, there is
always potential that data deletion may be
incomplete, or insufficient. To counteract any
potential issues from data deletion, it will be
necessary to follow proper deletion protocols related
to the cloud server platform, and in worst case
scenarios, insure that a disk containing sensitive data
is destroyed. Once again, proper encryption of data
will decrease the risk related to ineffective data
deletion (ENISA, 2009).
5 CONCLUSION AND FUTURE
WORK
Collecting, storing, and processing large amounts of
data is necessary to understand the power
consumption habits of consumers. A smart metering
device was used to collect and transmit data at high
frequencies. A SSH tunnel provided a secure channel
to send the data to a server where large amounts of
data could be stored and analysed. Initial data
collection has shown that patterns in power
consumption data can be deciphered, how-ever,
because human behaviour can be complex it is
necessary to continue the collection of data to see how
external factors such as weather and global events
affect human power consumption. A foundation to
study human power consumption behaviour, and the
factors affecting it, has been implemented through the
Oahu pilot system. The continued addition of nodes
to the system will allow a broader and more in depth
look at consumer behaviour, which will lead to the
creation of demand response programs to insure grid
stability and efficiency. Future work will involve the
scaling of the pilot system to include more nodes,
research into security measures to protect sensitive
data, scaling the current server to a cloud server, and
development of pattern recognition software to
recognize consumer power usage as it relates to
demand response programs.
REFERENCES
2013 Report Card for America’s Infrastructure. ASCE,
Reston, VA, 2013.
The Potential Benefits of Distributed Generation and Rate
Related Issues that may impede their Expansion. US
Department of Energy, Washington, DC, 2007.
Z. M. Salameh and A.J. Davis (2003) Case Study of a
Residential-Scale Hybrid Renewable Energy Power
System in an Urban Setting. Paper presented at the
Power Engineering Society General Meeting, Toronto,
Canada, 13-17 July 2003.
Impacts of Solar Power on Operating Reserve
Requirements. NREL, Golden, CO, 2012.
E. Wesoff (2013, September 25) What are the Impacts of
High Wind and Solar Penetration on the Grid?.
http://www.greentechmedia.com. Accessed 2 Nov
2015.
Smart Grids and Renewables: A Guide for Effective
Deployment. IRENA, Abu Dhabi, UAE, 2013.
D. Lew et al. The Western Wind and Solar Integration
Study Phase 2. NREL, Golden, CO, 2013.
Demand Response and Advanced Metering. FERC,
Washington, DC, 2008.
Demand Response Discussion for the 2007 Long-Term
Reliability Assessment. NAERC, Atlanta, GA, 2007.
Smart Grid (2015). http://energy.gov. Accessed 20 Oct
2015.
N. O’Connell et al. (2014) Benefits and challenges of
electrical demand response: A critical review. Elsevier
39: 686-699.
Press Release: Governor Ige Signs Bill Setting 100 Percent
Renewable Energy Goal in Power Sector.
http://governor.hawaii.gov. Accessed 2 Nov 2015.
B. Namata. (2015, June 8) New Law requires 100-percent
renewable energy in Hawaii by 2045. http://khon2.com.
Accessed 21 Oct 2015.
Scalability Benchmarking: MongoDB and NoSQL Systems.
USA, Pleasanton, CA, 2015.
R. Cattell (2010) Scalable SQL and NoSQL Data Stores.
ACM 39.4: 12-27.
Cloud Computing Trends: 2014 State of the Cloud Survey.
RightScale, Santa Barbara, CA, 2014.
National Grid (2015) Frequency Response Services.
http://www2.nationalgrid.com/uk/services/balancing-
services/frequency-response. Accessed 22 Nov 2015.
C. Gao and M.A. Redfern (2011) A Review of Voltage
Control in Smart Grid and Smart Metering
Technologies on Distribution Networks. Paper
presented at the 46th International Universities’ Power
Utilization of the Internet of Things for Real-time Data Collection and Storage of Big Data as it Relates to Improved Demand Response
241

Engineering Conference, Soest, Germany, 5-8
September 2011.
I. Kunold et al. (2011) A System Concept of an Energy
Information System in Flats Using Wireless
Technologies and Smart Metering Devices. Paper
presented at the 6th IEEE International Conference on
Intelligent Data Acquisition and Advanced Computing
Systems: Technology and Applications, Prague, Czech
Republic, 15-17 September 2011.
S. Makonin (2013) The Cognitive Power Meter: Looking
Beyond the Smart Meter. Paper presented at the 26th
IEEE Canadian Conference of Electrical and
Computer Engineering (CCECE), Regina, Canada, 5-8
May 2013.
T. Olavsrud (2015, November 24) 9 MongoDB success
stories. http://www.cio.com/article/3008114/open-sour
ce-tools/9-mongodb-success-stories.html. Accessed 10
Dec 2015.
A. Bhattacharjee (2014, May 8) NoSQL vs SQL – Which is
a Better Option?. https://blog.udemy.com/nosql-vs-sql-
2. Accessed 11 Dec 2015.
E. McNulty (2014, July 1) SQL VS. NOSQL- What you
Need to Know. http://dataconomy.com/sql-vs-nosql-
need-know/. Accessed 10 Dec 2015.
Cloud Computing: Benefits, risks and recommendations for
information security. ENISA, Crete, Greece, 2009.
A. Halsey (2012, August 1) Aging power grid on overload
as U.S. demands more electricity. https://
www.washingtonpost.com/local/trafficandcommuting/
aging-power-grid-on-overload-as-us-demands- more-
electricity/ 2012/ 08/ 01/ gJQAB5LDQX _story.html.
Accessed 23 Feb 2016.
G.R. Barai et al. (2015) Smart metering and functionalities
of smart meters in smart grid – a review. Paper
presented at the Electrical Power and Energy
Conference (EPEC), London, ON, Canada, 26-28
October 2015.
A. Ahmad et al. (2016) Smart cyber society: Integration of
capillary devices with high usability based on Cyber-
Physical System. Future Generation Computer
Systems, Volume 56, March 2016, pp. 493-503.
IoTBD 2016 - International Conference on Internet of Things and Big Data
242
