
An Alternative and Smarter Route Planner for Wheelchair Users
Exploring Open Data
N
´
adia P. Kozievitch, Leonelo D. A. Almeida, Ricardo Dutra da Silva and Rodrigo Minetto
UTFPR, Department of Informatics, Curitiba, Paran
´
a, Brazil
Keywords:
Route Planner, Wheelchair Users, GIS, Open Data.
Abstract:
In this paper we describe a bottom-up approach to integrate GIS maps (endorsed by discrete features, such as
points, lines, polygons), in order to develop a route planner for wheelchair users. We integrate public available
data with a novel model for route planning, based on sidewalks, crosswalks and curb ramps, as opposed to
traditional street-based approaches. We show that our sidewalk-based model is more suitable than available
planning routes under mobility constraints, using a case study in Curitiba, Brazil.
1 INTRODUCTION
Efforts have been made to develop route plan-
ning services for people with disabilities (Kulakov
et al., 2015; Menkens et al., 2011; Sumida et al.,
2012). This is a challenging problem that involves
the processing of a huge amount of data, such as
maps, images, detailed public transport information
and collaborative user feedback, to properly define
wheelchair accessible paths. Nevertheless, there is
a lack of route planning services (such as the route
planner of Google maps
1
) for wheelchair users.
The available solutions for wheelchair users are
street-based. Nevertheless, a myriad of complex spa-
tial factors could be considered in order to locate the
best routes, such as sidewalks, crosswalks and curb
ramps. In many applications, such as geographic in-
formation systems (GIS), data can set the stage by dis-
playing individual maps of decision criteria, in order
to provide the detailed information needed to locate
the best route.
In this paper we are concerned with the routing
problem for wheelchair users. The input data for this
problem is a set of base map layers (streets, sidewalks
and city blocks). The output data is a cost weighted
map, which we also present as a graph. The novelty is,
taking advantage of open data, to include additional
factors (such as distinct sidewalks in a street or miss-
ing curb ramps), in order to propose a best route to a
wheelchair user. We explore our method using open
data from Curitiba, Brazil. The city belongs to the
1
https://maps.google.com Last visited on 01/07/2015.
C40 cities
2
, a group which set ambitious targets to im-
prove urban life quality and protect their environment.
The remainder of this paper is organized as follows.
Section 2 contains a description of related work. Sec-
tion 3 presents an overview of our method. Section 4
presents the experiments and, finally, section 5 state
the conclusions and future work.
2 RELATED WORK
Several online libraries and services are already avail-
able for route planning (such as Google Directions
API
3
, the JavaScript API Yandex.Map
4
, or other on-
line services
5
). In particular, fewer of them are
toward specific functionality, such as wheelchairs
(as OpenRouteService
6
, Routino
7
,and OpenTripPlan-
ner
8
). Nevertheless, some of the online libraries also
present acessibility problems (Medina et al., 2015).
There are norms for urban environments that de-
fine accessibility specifications as DIN 18024-1 (Ger-
2
http://www.c40.org Last visited on 30/05/2015.
3
https://developers.google.com/maps/documentation/
directions/ Last visited on 23/06/2015.
4
https://tech.yandex.ru/maps/ Last visited on
23/06/2015.
5
http://wiki.openstreetmap.org/wiki/Routing/
online routers Last visited on 23/06/2015.
6
http://www.rollstuhlrouting.de/ Last visited on
23/06/2015.
7
http://www.routino.org/ Last visited on 23/06/2015.
8
http://www.opentripplanner.org/ Last visited on
23/06/2015.
94
Kozievitch, N., Almeida, L., Silva, R. and Minetto, R.
An Alternative and Smarter Route Planner for Wheelchair Users - Exploring Open Data.
In Proceedings of the 5th International Conference on Smart Cities and Green ICT Systems (SMARTGREENS 2016), pages 94-99
ISBN: 978-989-758-184-7
Copyright
c
2016 by SCITEPRESS – Science and Technology Publications, Lda. All rights reserved

man Institute for Standardization , 1998) from Ger-
many and ABNT NBR 9050:2004 (ABNT (Brazil-
ian Association of Technical Standards), 2004) from
Brazil. Other studies as Kasemsuppakorn and
Karimi (Kasemsuppakorn and Karimi, 2009) investi-
gated the most relevant aspects regarding wheelchair
accessibility, for each segment of the route network
(i.e. length, width, slope, sidewalk surface, steps,
sidewalk conditions and sidewalk traffic). More-
over, some studies consider not only barriers but also
provide information about relevant locations (called
Points of Interest - POI) as restaurants, bus stops, ac-
cessible toilets, and police departments (e.g. Menkens
et al. (Menkens et al., 2011), and Wheelmap
9
).
Sumida et al. (Sumida et al., 2012) argues that bar-
riers information should be collected through actual
measurement data and adapted an electric wheelchair
for collecting data as the force necessary to move the
wheelchair and the passage width. Other studies use
data provided by the routing service users (e.g. Open-
RouteService, and Menkens et al. (Menkens et al.,
2011)), volunteers (e.g. OpenRouteService; Menkens
et al. (Menkens et al., 2011); Kulakov et al. (Kulakov
et al., 2015)), authorities (e.g. Kulakov et al. (Ku-
lakov et al., 2015)). Consequently, the collected data
is usually limited to a city or a district. An exception
is the Wheelmap project
9
that provides resources for
crowd sourcing information based on OpenStreetMap
data.
The lack of public available information regarding
accessibility of urban spaces (e.g., streets, sidewalks,
curbs, and type of surface) contribute to the fact that
most of studies on accessible routing are constrained
to cities or districts. Some initiatives as Wheelmap
explore the aspects of crowds for collecting relevant
information regarding POI. Currently, to our knowl-
edge, none of such initiatives are widely adopted in
Curitiba (e.g. there are only about 10 POI registered
in Wheelmap, most of them are accessible bus stops).
Routing estimation is another challenging task. In
order to improve the results of routing estimation,
some services provide additional parameters (e.g.,
maximum inclination, type of surface, maximum curb
height
6
), personalized estimation according to the
users’ profile (e.g. Menkens et al. (Menkens et al.,
2011)). As already noted by A. M. Bishop within
the Routino application, routing planning can use
graph algorithms (e.g. Dijkstra and A*) for calculat-
ing the shortest/least-cost path. Some of those stud-
ies adapt these algorithms aiming at improving per-
formance in terms of execution time (e.g. the con-
cepts of super-segments and super-nodes from A. M.
Bishop
7
). Others claim that there is no clear answer
9
http://wheelmap.org/en. Last Visited 24/08/2015.
as to shortest path algorithm which runs fastest on
real road networks (due to real time computation, the
large network size, and the resulting intensive com-
puting) (Zhan, 1997). Among other critical factors
for route planning we can mention: (1) types of bar-
riers considered for collecting and estimating routes,
(2) data sources for maps information and barriers,
and (3) approaches for route planning.
3 OUR METHOD
Problem Formulation. For GIS applications, the
shortest path based on a road is a basic operation.
In practice, however, users are always interested in
several constraints (such as the combination of spatial
and textual information). From GIS and map analysis
perspective, the routing problem can be described as
a three steps process: the calculation of discrete cost,
accumulated cost and steepest path (Berry, 1993).
The idea is, using base maps (such as roads), create
other derived maps (to calculate information that is
too difficult to collect, such as curb ramps) in order
to finally create cost/avoidance maps which translate
this information into decision criteria. Within this per-
spective, map layers are thematic representations of
geographic information, as shown in Figure 1. In par-
ticular, base maps can be represented by streets, street
blocks (Figure 5) and sidewalks, among others.
The derived maps, composed by large polygon
subdivisions, are often simplified in order to reduce
the total number of vertices which defines it (known
as the map simplification problem (Estkowski and
Mitchell, 2001)). The calibration of the individual
cost maps is an important and sensitive step in the sit-
ing process. Since the computer has no idea of the rel-
ative preferences this step requires human judgment.
As an example, you might be interested in identify-
ing the most preferred route for a wheelchair user that
minimizes its visual exposure to huge avenues, and
maximizes the visual exposure to bus stops.
From the geometry perspective, streets are one or
more single lines (which can also be represented by
one ore more edges in a graph), which thereby are
composed by points (which can also be represented
by a vertice in a graph). Blocks (Figure 5) can be
decomposed by the respective lines, and lines can be
decomposed by respective points (Figure 6).
Formally, a GIS database contains a set of geome-
tries which can be resumed as a set P of points on a
network G = (V, E), where V represents vertices and
E represents edges. The network is a directed con-
nected graph. A point p ∈ P locates on an edge e ∈ E.
The distance between any two points (or vertices) can
An Alternative and Smarter Route Planner for Wheelchair Users - Exploring Open Data
95
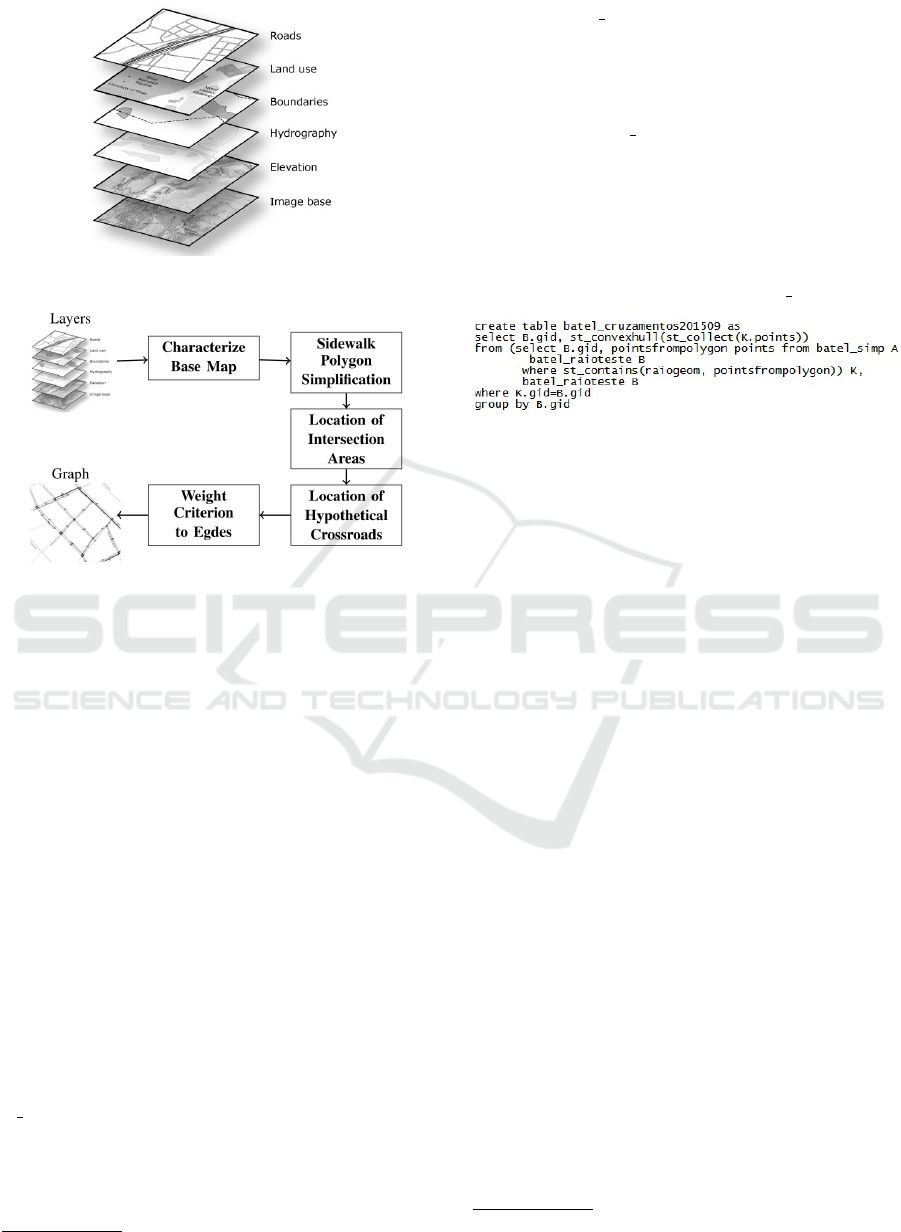
Figure 1: Map Layers
10
.
Figure 2: Overview of the proposed system.
be denoted as d(p
i
, p
j
), as the length of the shortest
path connecting them.
Our Approach. Our method comprised the follow-
ing steps (shown in Figure 2) toward a sidewalk-based
model: (1) the base map (streets, sidewalks, blocks,
etc.) characterization; (2) the creation of derived map
for sidewalk polygon simplification; (3) the creation
of derived map for location of intersection areas; (4)
the creation of derived map for hypothetical cross-
roads; (5) the establishment of a weighting criterion
to edges (in particular, considering wheelchair users);
and (6) the generation of the graph.
For the characterization of the base maps (iden-
tified by Figures 5 and 6), external open data were
integrated with data from Open Street Map with a spa-
tial database.
The second step started with the simplifica-
tion of sidewalk polygons and their derived points
(performed with a spatial database function named
st simplify).
The next derived map comprised the road inter-
section areas, basically discovering the average dis-
tance among streets and sidewalks. Circles in Figure
7 represent this phase, performed with spatial func-
10
http://webhelp.esri.com/ Last access on 17/09/2015.
tions, such as st buffer.
The last derived map comprised the hypothetical
crossroads, identified by lines, triangles and rectan-
gles inside the road intersection area (circles). Ba-
sically this map was derived using spatial database
functions such as st convexhull (shown in Figure 3).
The weighting criterion (step 5) was initially set
as the distance between points if the ”edge” has no
barriers, or infinite if it does. Lately these weights
could be modified to register temporal issues, such as
constructions which might impact the normal flow of
pedestrians. In practice, these distances can be ob-
tained with spatial functions, such as st distance.
Figure 3: Example of SQL query to compute crosswalks.
From the GIS perspective, the shortest path would
not be based on the street map, but on the compo-
sition of the sidewalk map and on the derived map
for the crossroads. Note that: (i) the same sidewalks
could have temporally distinct costs (if for example,
one sidewalk is next to a construction during the be-
ginning of an year) and (ii) the distinct crossroads ge-
ometries could help the identification of most danger-
ous locations for pedestrians.
4 EXPERIMENTS
We concentrated our efforts in preliminary experi-
mental results, using an ordinary linux server, and ex-
ploring spatial database functions. In order to sim-
plify our tests, we explore the shortest path as a
graph (step 6), but indeed, there are already ongoing
projects (such as pgRouting
11
) which could be used
within the spatial database.
Datasets. In particular, we are exploring a case
study in Curitiba. Curitiba has 1.8 million people in-
side a total area of 430,9 km
2
, IDH of 0,823, accord-
ing to the Brazilian Institute of Geography and Statis-
tics (IBGE)
12
. This area encompasses 75 neighbor-
hood districts. According to the same census, Curitiba
had in the urban region approximately 95 thousand
people with some degree of motor disability. Among
them, more than 31 thousand informed to experience,
11
http://pgrouting.org/ Last visited on 23/09/2015.
12
http://www.ibge.gov.br. Last visited on 14/05/2015.
SMARTGREENS 2016 - 5th International Conference on Smart Cities and Green ICT Systems
96
at least, great difficulty for locomotion. Despite of not
providing more detailed information regarding barri-
ers for motor impaired people, the Census revealed
that only 12.6% of the urban area of Curitiba pre-
sented lowered curbs. Thus, currently, providing ef-
fective and efficient route plannings for people with
motor disabilities, especially wheelchair users, is po-
tentially relevant for removing barriers to people’s
daily lives.
For the acquisition/characterization of the base
maps, the dataset from the Institute of Research and
Urban Planning of Curitiba (IPPUC
13
), along with
data from Open Street Map
14
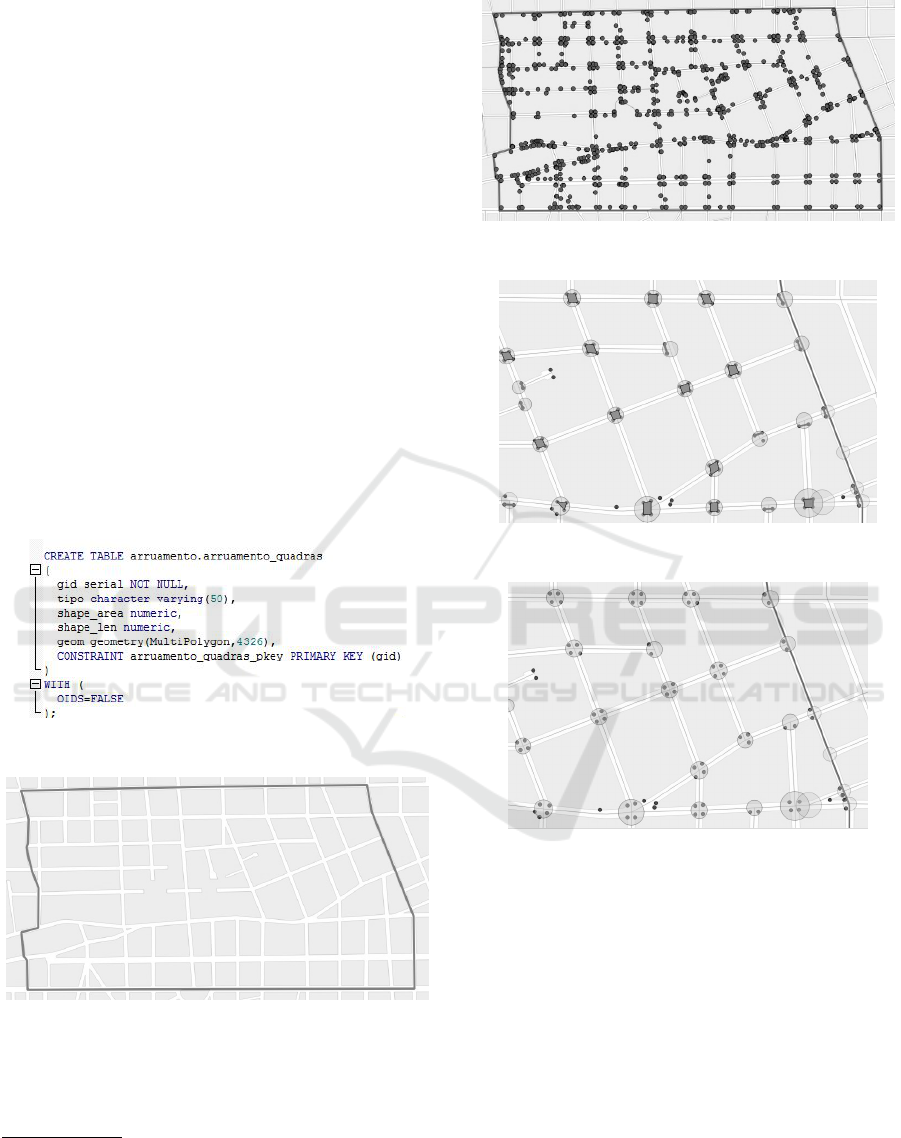
were used. Figure 4
shows the DDL example for the creation of street
block table. The complete data set initially included
streets (39,948 rows), sidewalks (9,614 rows) and
blocks (13,459 rows) from Curitiba. The complete
data set was inserted in a PostGIS
15
database. Later,
specific tablespaces and indexes were created in or-
der to optimize the access. Nevertheless, several se-
mantic errors were present (such as different street ge-
ometries and names - more details in (Barczyszyn,
2015)).The data was visualized with QGIS
16
.
Figure 4: Example of SQL for street block creation.
Figure 5: Example of Street Blocks.
Tests. For our tests, the three base maps toward the
selected area of the Batel district resulted in 51 streets,
13
http://www.ippuc.com.br. Last visited on 14/05/2015.
14
http://www.openstreetmap.org Last visited on
14/05/2015.
15
http://www.postgis.net Last visited on 15/05/2014.
16
http://www.qgis.org Last visited on 15/05/2015.
Figure 6: Example of Sidewalk Points.
Figure 7: Example of Road Intersection Areas.
Figure 8: Hypothethical Crossroad.
94 sidewalks and 71 blocks. The derived maps re-
sulted in 309 road intersection areas (within a zoom
in Figure 7) and 185 number of possible crossroads
(within a zoom in Figure 8). Note that crossroads
within Figure 8 can belong to geometric groups: lines
and polygons (with three or four edges).
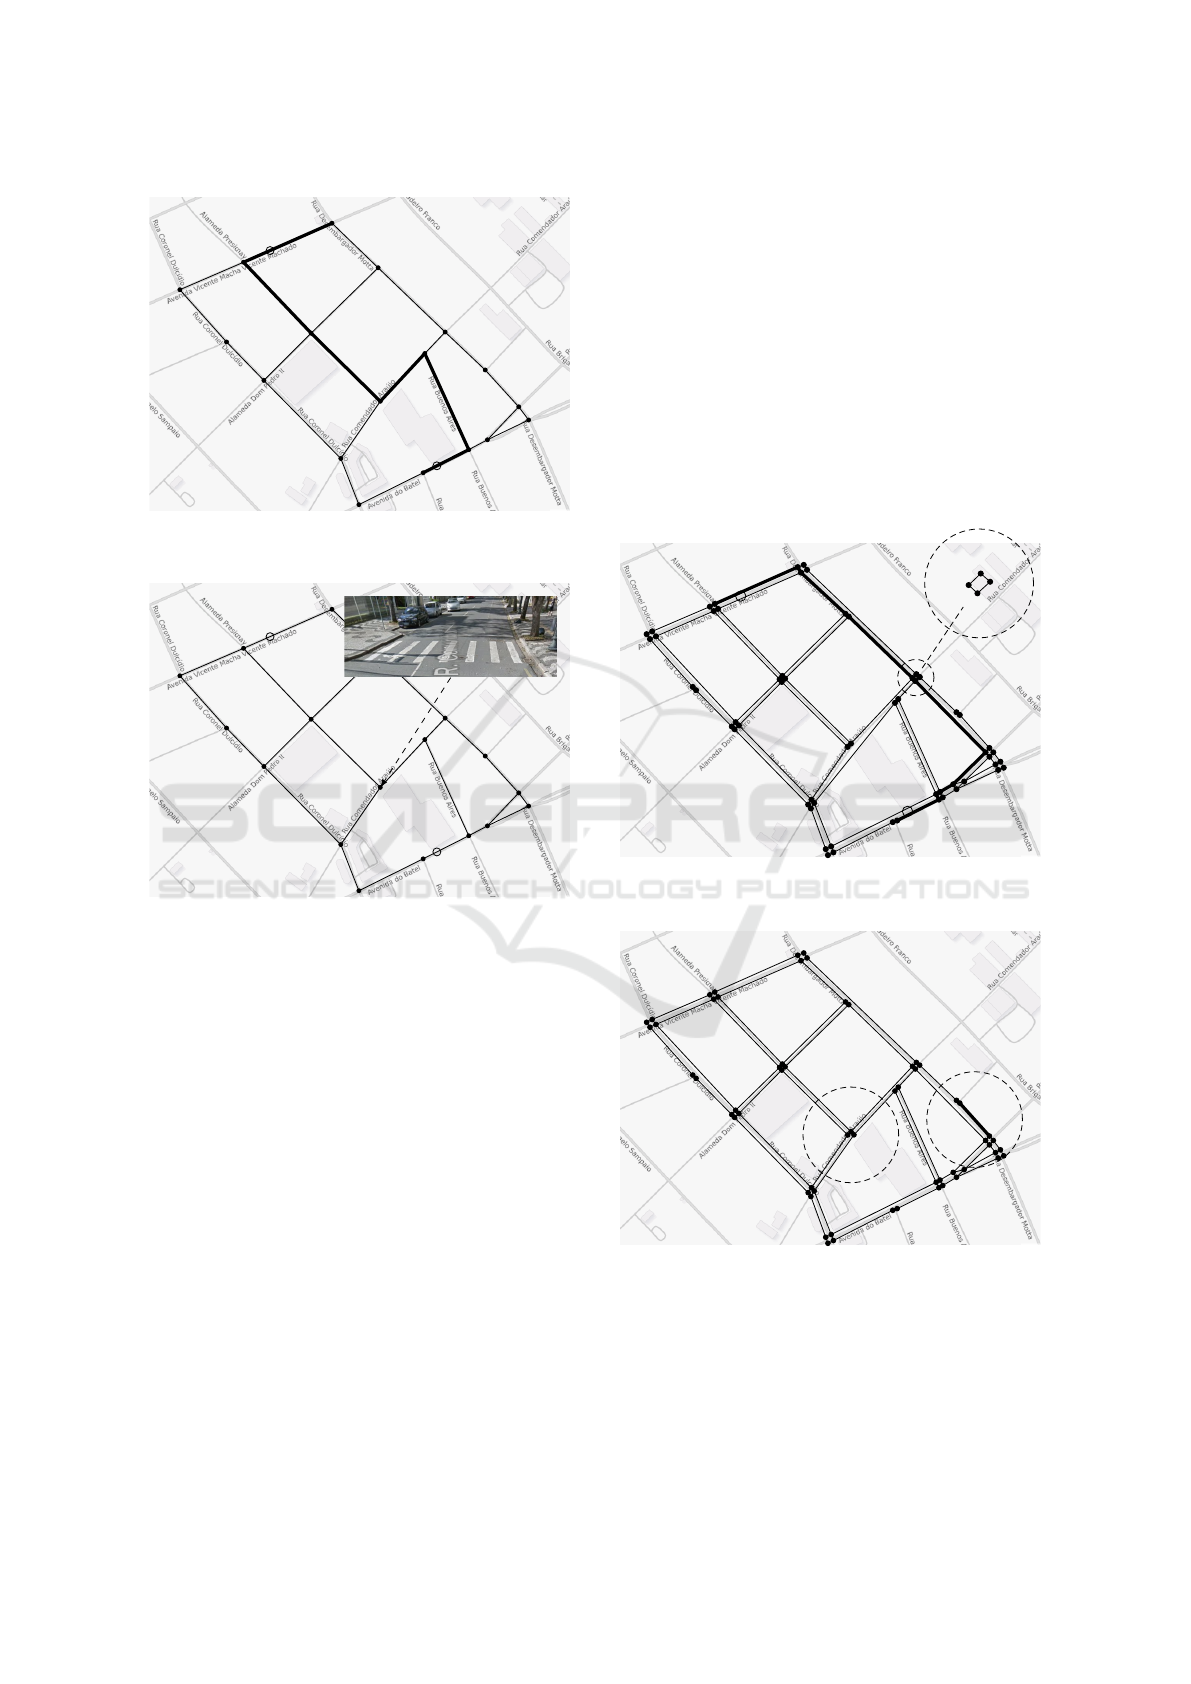
Consider the shortest walking path (highlighted in
Figure 9) from point A on Benjamin Lins Street to
point B on Vicente Machado Avenue. The path is
computed by considering the possible combination of
streets that can be followed in order to get from one
point to another. A subset of the combinations can
be modeled by a graph as the one in Figure 9. The
vertices are a set of intersections and the edges are
segments of streets defined by two intersections.
The graph reflects the input data used for comput-
An Alternative and Smarter Route Planner for Wheelchair Users - Exploring Open Data
97
93
134
205
131
93
52
199
74
71
34
91
105
178
57
119
111
179
187
135
183
128
102
125
176
B
A
Figure 9: Shortest walking path between points A and B
computed using a street-based graph.
93
134
205
131
93
52
199
74
71
34
91
105
178
57
119
111
179
187
135
183
128
102
125
176
B
A
Figure 10: Ordinary route planners do not consider accessi-
bility constraints.
ing shortest paths on common route planning. This is
a street-based graph which takes into account a weight
factor for each edge according to known properties of
street segments, such as the distance between two in-
tersections, the slope of a street segment and the con-
dition of a sidewalk. The graph in Figure 9 considers
distances between intersections.
People with disabilities, such as wheelchair users,
may face some problems due to conditions not cap-
tured in route planners considering such a model. As
highlighted in Figure 10, there is a crossing without
curb ramps that would make it difficult to proceed
along the route. The model must be able to encode
that kind of constraints perhaps by using a weight on
the vertices of the graph or by making it reflect on
the weight of the streets. Anyway, those can also be
flawed solutions: it is possible one street has side-
walks on both sides and one side has problems while
the second one is in perfect conditions to go along.
The sidewalk-based model proposed in this paper
allows to make all of these conditions explicitly avail-
able for a route planner, making it more suitable for
searching paths that meet the needs of people with
disabilities. The model for the same region of the
previous discussion is summarized by the graph in
Figure 11. The hypothetical curb ramps are vertices
of the graph and its edges are sidewalks or adjoining
curb ramps on streets. Thereafter, every sidewalk can
have its own weight and the lack of curb ramps be-
tween adjoining streets also be encoded on the edges
connecting them. It is possible, therefore, to avoid
streets without curb ramps and sidewalks on poor con-
ditions. The shortest path in our model is highlighted
in Figure 11, depicting not only which sidewalk to fol-
low along a street but also which curb ramps to use.
125
218
84
84
87
46
46
193
193
67
65
67
65
28
28
85
184
99
283
51
172
170
173
105
173
181
181
177
129
177
129
224
128
96
199
199
119
119
244
125
170
170
6
6
6
6
B
A
Figure 11: A sidewalk-based model and a route considering
accessibility.
125
218
84
84
87
46
46
193
193
67
65
67
65
28
28
85+50
184
99
283
51
172
170
173
113
131
105
173
181
181
177
129
177
129
224
128
96
199
199
119
119
125
170
170
A
B
Figure 12: Modified walkway-based model: a sidewalk was
given a bigger weight (see region A) and a curb ramp, along
with a crosswalk, was added (see region B).
The model may have its attributes modified by
users: (i) an edge (segment of a sidewalk) of the
graph could have its weigh increased if the condition
of the sidewalk is degraded due to holes in the pave-
ment, narrow width, obstruction, among others; and
SMARTGREENS 2016 - 5th International Conference on Smart Cities and Green ICT Systems
98

(ii) previously nonexistent curb ramps and their re-
lated crosswalks could be added to improve the route
planning. The two types of modifications are illus-
trated in Figure 12. The weight of one edge was mod-
ified due to a possible poor condition of the sidewalk.
In the second modification a vertex and an edge were
added to the model to illustrate that a new curb ramp
has been built.
Discussion. Among the parameters which impact
the planning of a route for wheelchair users, we can
mention: Database Issues: lacks of standard within
the data sources (the different data semantics, geome-
tries, etc.), the domain understanding of how GIS ge-
ometries might be mapped and how they can be ex-
plored in other domains (such as graphs), the theoretic
abstraction of how different layers of points, lines, ge-
ometries can be mapped to multigraphs, among oth-
ers; Domain Issues: how to manage different areas
(such as databases, human computer interaction, the-
ory, urbanism, etc.) toward working in an unified
solution, regarding terms and technologies; Theory:
how to theoretically add temporal events which might
change in a graph (such as edge weights which change
along the interactions); how to develop a mathemati-
cal approach and elaborate algorithms of route build-
ing on the graph on condition of various types of ob-
stacles; how to better calculate the edge weight es-
timation. Although being preliminary, the tests state
that the implementation of the method is suitable for
wheelchair users. In summary, we understand that
better approaches to the routing problem depends on a
sinergic combination of data, knowledge domain, and
user feedback.
5 CONCLUSIONS
Research in accessibility and GIS is not recent, but the
exploration through different domains using real data
is still an ongoing effort. The possibility of imple-
menting models within GIS and integrate them with
different sources provides planners with a powerful
and flexible tool for analyzing applications, and de-
ciding on new business permits. This paper presents
the concepts, application, and challenges of exploring
a route planner for wheelchair users. Later these def-
initions are explored in a practical case study, within
the Curitiba metropolitan region, Brazil.Future work
includes the personalization of weights for different
users, and integration of a off-line mode, among oth-
ers.
ACKNOWLEDGEMENTS
We would like to thank the Curitiba City Municipal-
ity, IPPUC, and RNP.
REFERENCES
ABNT (Brazilian Association of Technical Standards)
(2004). Abnt nbr 9050:2004: Accessibility to build-
ings, equipment and the urban environment.
Barczyszyn, G. L. (2015). Integration of geographic data
for the urban planning of the city of Curitiba (in
portuguese). Universidade Tecnol
´
ogica Federal do
Paran
´
a.
Berry, J. K. (1993). Beyound Mapping - Concepts, Algo-
rithms and Issues in GIS, volume 1. John Wiley Pub-
lishers, 1 edition.
Estkowski, R. and Mitchell, J. S. B. (2001). Simplifying
a polygonal subdivision while keeping it simple. In
SCG ’01, pages 40–49, New York, NY, USA. ACM.
German Institute for Standardization (1998). Barrier-free
design - part 1: Streets, places, roads and recreational
areas; planning basics. Standard Specification 18024-
1, German Institute for Standardization), Berlin.
Kasemsuppakorn, P. and Karimi, H. A. (2009). Person-
alised routing for wheelchair navigation. J. Locat.
Based Serv., 3(1):24–54.
Kulakov, K., Shabaev, A., and Shabalina, I. (2015). The
route planning services approach for people with dis-
ability. In FRUCT ’15, pages 89–95.
Medina, J. L., Cagnin, M. I., and Paiva, D. M. B. (2015).
Evaluation of web accessibility on the maps domain.
SAC ’15, pages 157–162, New York, NY, USA. ACM.
Menkens, C., Sussmann, J., Al-Ali, M., Breitsameter, E.,
Frtunik, J., Nendel, T., and Schneiderbauer, T. (2011).
Easywheel - a mobile social navigation and support
system for wheelchair users. In ITNG ’11, pages 859–
866.
Sumida, Y., Hayashi, M., Goshi, K., and Matsunaga, K.
(2012). Development of a route finding system for
manual wheelchair users based on actual measure-
ment data. In UIC/ATC ’2012, pages 17–23.
Zhan, F. B. (1997). Three fastest shortest path algorithms
on real road networks: Data structures and procedures.
Journal of geographic information and decision anal-
ysis, 1(1):69–82.
An Alternative and Smarter Route Planner for Wheelchair Users - Exploring Open Data
99
