
Managing an Urban Transport System in Enhancing the Area
Stability
Irina Makarova, Rifat Khabibullin, Eduard Belyaev and Vadim Mavrin
Kazan Federal University, Suyumbike, 10A, 423800, Naberezhnye Chelny, Russian Federation
Keywords: Air, Maximum Allowable Concentration, Road Transport, Intensity, Motorway.
Abstract: The urbanized mankind is faced with vulnerability of urban systems, migration and concentration of
population, low quality of habitat, loss of fertile land, and necessity of waste disposal. In large cities, a
significant contribution to atmospheric pollution with sulphur dioxide, nitrogen and carbon oxides, and
industrial dust comes from the motor transport. The motor traffic growth inevitably affects the human health
by causing road and transport traumatism, respiratory diseases and diseases caused by physical inactivity.
The proposed solution is based on optimization of a city transport system parameters. This was achieved by
via simulation modelling taking into account a large number of parameters, both within and outside the
system, many of the latter being stochastic. The recommendations include rearranging of the public
transport routes and changing over to vehicles running on gas motor fuel.
1 INTRODUCTION
Transition to “green” economy is unique for each
country, being affected by various interrelated
factors. However, the main trends and challenges
have been shaped by global processes and are
relevant for both developed and developing
countries. One of those is urbanization, which is an
objective process triggered by social demands,
modes of production, and character of the social
system. As a consequence, a precipitous growth of
urban population, especially in recent decades, has
depleted the reproductive capacity of the
environment in major cities.
As reported by the European Commission
(Eurostat, 2008), transport in 27 EU countries is a
major source of greenhouse gas (GG) emissions,
second after the industry, and their dynamics is
higher than that of any other energy-generating
sector (Transport and its infrastructure).With that,
the share of automotive transport exhaust is over
90% of direct transport exhaust (Eurostat, 2009), and
it is increasing in most countries due to growing
transportation volumes. In large cities, the
atmospheric pollution comes mainly from
automotive transport. Thus, in Moscow and other
Russian megacities the share of automobile exhaust
is over 90% of total emissions to the atmosphere.
The share of vehicle exhaust in less industrialized
cities is but a little smaller (about 80-90). On the
average in Russia, the vehicle emissions account for
42% of the total (Konstantinov, 2012).
One of Russia’s priorities on the way to
sustainable development of the socio-economic
system is transition to low-carbon fuels. More
economical and environmentally friendly vehicles
will facilitate «green» growth, diminish the
environmental loads and increase the processing
depth of natural resources. Considering the public
concern regarding the sustainability of urban
territories and increasing human migration to cities
worldwide, there has been developed a project
concept of a system of city management taking into
account both the mobility needs of population and
environmental factors.
In compliance with the “road map” given by the
European Economic Commission to intelligent
transport systems for the period of 2012-2020 (ITS
for sustainable mobility, 2012) there have been
identified 20 lines of activities promoting the use of
ITS. They incorporate both activities on developing
of uniform terminology and understanding of the
ITS essence and objectives, and measures on
introduction of ITS-related developments. This
concerns both the technical component
(development of road-to-vehicle and vehicle-to-
vehicle communication; integration of different
kinds of transport) and activities on improving of
112
Makarova, I., Khabibullin, R., Belyaev, E. and Mavrin, V.
Managing an Urban Transport System in Enhancing the Area Stability.
In Proceedings of the International Conference on Vehicle Technology and Intelligent Transport Systems (VEHITS 2016), pages 112-117
ISBN: 978-989-758-185-4
Copyright
c
2016 by SCITEPRESS – Science and Technology Publications, Lda. All rights reserved

management and safety of the transport system,
including the environmental safety, as well as
analytical work and development of various
methodologies. Since optimizing of transport system
parameters may follow along two lines, i.e. by
regulating the transport density and by improving
the environmental safety of transport means,
pathways for achieving the best values are being
developed in two directions. It is evident that the
ITS plays an important role in optimization of the
transport system operations. It promotes the
sustainability of the environment (Fengqi, 2010),
diminishes the negative impact of the transport
complex on the environment and also the energy
consumption (Gkritza, 2013). Nowadays the ITS has
turned into tool in transport planning being used for
surveying, decreasing of traffic congestions (Harb,
2011), and planning of shared vehicle use. Since the
ITS is a technology for creating applications and
systems for traffic management and forestalling of
accidents, they diminish the workload on motorists
(Jarašūniene, 2013).
2 EXPERIMENTAL METHODS
2.1 Intelligent Transport Systems
Since the transport system belongs to the class of
major systems, optimizing of its processes involves
processing of great bodies of data and modeling of
processes by using IT technologies. This kind of
research is joined by a common term “intelligent
transport systems”. Alongside with artificial intellect
systems this area is dynamically developing and
embraces different classes of problems.
The sustainability of transport systems in major
cities, including megacities, depends on the stability
of subsystems and links connecting them, which in
turn depends on the quality of management.
Nowadays controlling of large systems, such as the
transport one, is effected by using the systems of
solution support, expert systems, and information
systems of control. Such systems are created for
both strategic and local, tactical, control. Efficient
management not only improves the economic
performance of the system; it also assists socially, by
improving the transport service and reducing the
negative impact of the transport complex on the
environment.
Methodologically, the ITS development is based
on systemic approach, meaning that ITS are created
as systems, not as individual modules (services). The
process involves forming of a unified, open
architecture of the system, protocols of information
exchange, forms of transportation documents,
standardization of parameters of communication,
control and management technologies, management
procedures, etc.
Intellectualization enhances the transport
system’s safety and efficiency both due to
information services and the means and methods
affording to perform intelligent data analyses and
make decisions on their basis. Regarding ITS as an
information service, the authors of work have found
that such systems are mainly needed for informing a
driver of the transport flow parameters along his
route. The ITS tools are also used to ensure the
safety of traffic participants, i.e. in intelligent
onboard systems (safety shields) and pedestrian
recognition systems (Truong Cong, 2011). The
development of alerting systems is connected with
developing of communication technologies and
infrastructure applied in traffic control. Several
studies have been devoted to the analysis of trends
and future evolution of ITS (Ran, 2012;).
2.2 Decision Support Systems in
Management of Transport Flows
Since the quality of decisions in managing of large
systems depends on the quality of information,
adequately selected methods of its analysis, and
effective tools, this calls for creating of decision
support systems. The structure of DSS essentially
depends on the kind of objectives to be tackled, on
the available data, information and knowledge and
also on the system’s users. Therefore a DSS consists
of three main parts:
1. A data system for collecting and storing of
information obtainable from internal and external
sources; as a rule it is a data storage.
2. A dialogue system affording the user to set
the data to be selected and methods for their
processing.
3. A system of models, i.e. ideas, algorithms
and procedures permitting to process and analyse the
data.
Since decision making is based on the real data
of the object under management, both analysis and
adopting of strategic decisions require aggregate
information available from a specially created data
storage (DS). Data storages contain the information
collected from several operative databases of an on-
line transaction processing systems (OLTP). The
core of a road situation control center is a multi-
dimensional intelligent data model (an OLAP cube)
Managing an Urban Transport System in Enhancing the Area Stability
113

which collects, stores and formalizes the road
network parameters (Fig. 1).
Figure 1: OLAP cube: the “kind of transport” dimension.
Storing of information as an OLAP cube and its
subsequent processing will make it possible to
precisely assess the dynamics of street road network
parameters in different dimensions (number of
transport vehicles, road section, season, of the year,
average speed, availability of traffic lights, etc.). By
analyzing the information on varying road
parameters within the day time, week day, and
month it is possible to forecast probable changes in
road situations in the future.
Besides, modeling of variants of possible
solutions with varying system parameters allows to
select the optimal parameters and create a database
of best solutions at fixed parameters of the transport
flow and external environment. Such bases serve for
operative decision making in the case of transport
emergencies. The intellectual core of the DSS is
often composed by simulation models, which affords
not only to make a qualitative analysis of the
processes but to investigate the consequences of
variations and select the variant satisfying all preset
limitations to obtain the system parameters optimal
for the preset conditions (Makarova, 2013).
3 RESULTS AND DISCUSSION
3.1 Field Studies of Transport Flows
Improving the performance of a transport system
presupposes examining of its current state, revealing
of problem areas, developing of a package of
measures, aimed at alleviating the negative factors,
and implementing the measures while controlling
the parameters in order to assess the solutions
efficiency. Therefore the following objectives have
been set:
To carry out field studies of the transport
flows, including their intensity and sites with
frequently occurring accidents;
To carry out field studies on pollutants
distribution in atmospheric air;
To develop a software module for feeding,
storing and analyzing of the obtained statistical
data;
Developing of a model simulating the city’s
traffic infrastructure;
Input and systematization of obtained
information and of a database by using a
software complex;
Analysis of information on the traffic
infrastructure parameters by using the
statistical analysis of obtained information;
Model studies of the impact of vehicles
powered by natural-gas motor fuel on the air
quality.
The field studies were conducted using the
following methods of monitoring the traffic
infrastructure: revealing the regularities of transport
flows formation; evaluating the most congested road
sections and sites of frequent accidents. First, the
city map was split into squares to reveal the
potentially problematic sites (narrowing sections of
thoroughfares and streets, traffic confluence,
complecated road junction with lots "conflicts
points", etc.), with account for peculiarities of the
city’s street-road network (SRN) pattern.
When identifying the sites with higher than
average traffic intensity, we analysed the transport
police data and revealed the places with a high rate
of road traffic accidents. It was hypothesized that the
high accident rates were caused by increased traffic
loads on the SRN. The experiment included
registering by vehicle dash cameras and video
cameras and computer processing of the images.
Measurements were performed at the cross roads
that had been found as the greatest loaded,
potentially dangerous and most in need of
optimization. In order to reveal the peak loads on
SRN, the measurements were performed during the
week days and included the following periods: 1)
07:00–09:00 am; 2) 11:30–13:30 pm; 3) 16:30–
18:30 pm. The following parameters were recorded:
vehicle model, brand and type; traffic direction;
average current velocity.
3.2 Studies of the Atmospheric Air
Pollution
Having analyzed the road layout, the purpose of motor
roads, and information about the traffic load, we
selected the following 5 road portions for instrumental
measurement of ambient air pollution on the following
VEHITS 2016 - International Conference on Vehicle Technology and Intelligent Transport Systems
114
roadside clear zones. Sampling of atmospheric air was
carried out in the immediate vicinity of roads, mainly
from downwind, during the morning and evening rush
hours. For each site there were obtained 2 duplicate
samples, so that the total number of samples was 600.
Both the initial working solutions (600) and 300 blank
solutions were prepared for analysis at a
chromatograph with a photoionization detector and
photometer. Analysis for the presence of carbon
monoxide has required the obtaining and processing of
more than 300 chromatograms.
Company's fixed contamination sources of
Naberezhnye Chelny city are outside the city,
therefore motor transport is the main source of
emissions. We made the environmental analysis,
determined locations of high concentrations of
pollutants and calculated emissions of motor
transport by using certified methodologies: in this
calculation traffic volume was considered. The
volume was determined by making field surveys.
Maps of pollutants (CO, NO
X
, C
X
H
Y
, soot, SO
2
,
formaldehyde, benzopyrene) were made by using
Integral Ecolog 3.0 software. The analysis of these
maps showed that the highest levels of concentration
of polluting substances are located on the
crossroads. Field surveys showed, that maximal
density of traffic cause increasing of concentration
of polluting substance. We have ascertain, that non-
optimum traffic light control is one of the cause of
this situation. Further research is aimed at searching
for optimal parameters of traffic light control by
using simulation models and at the elaborations of
recommendations for optimization of road traffic.
3.3 Developing of Decision Support
System
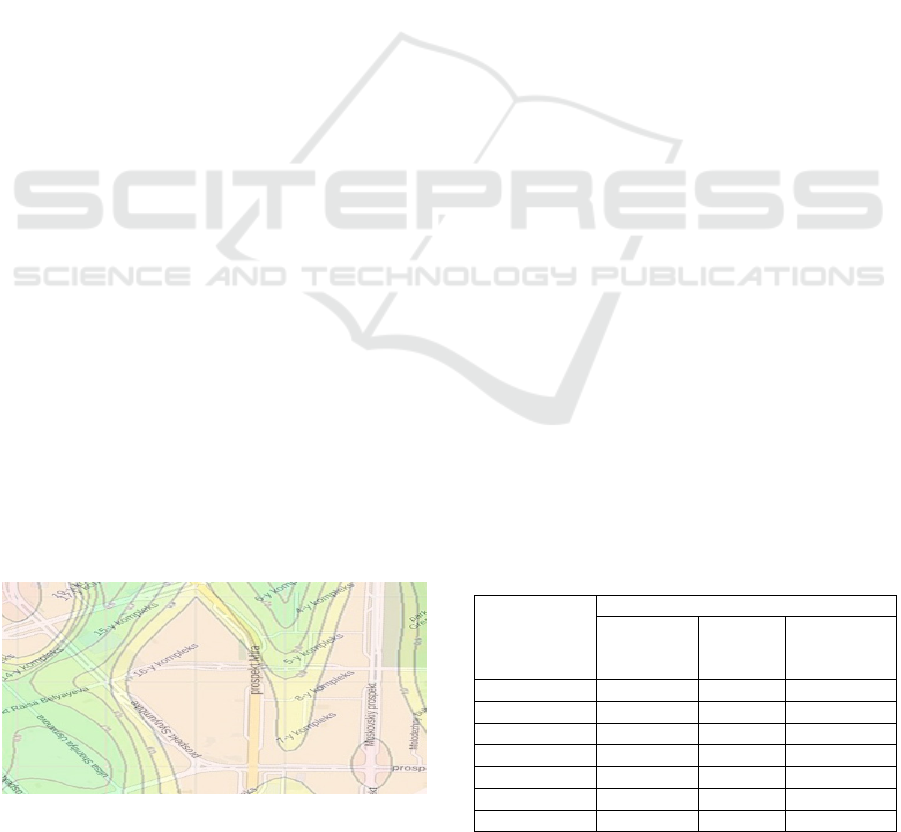
Using the maps of pollutant dispersion from
stationary sources, derived as a result of field
observations (Figure 2), we highlighted the problem
areas, one of which is a complex junction formed by
intersecting Mira, Druzhba Narodov and
Syuyumbike Avenues.
Figure 2: Dispersion of carbon monoxide map.
As shown statistically, this site is characterized
by a higher than average rate of vehicle accidents,
which cumbers the traffic and deteriorates the
atmosphere by frequently occurring congestions. For
more detailed analysis of the area, we constructed a
simulation model using the AnyLogic software
(Russia). The following factors were taken into
account: geometry of the road network portion;
traffic density; intensity of pedestrian traffic along
traffic lanes; pollutants actually emitted by motor
vehicles emission quotas; modes of traffic lights
operation at road portions preceding and following
the portion being analyzed. A constraint for the
model was the value of the emission quota that was
not to be exceeded. This system of simulation
modeling makes possible to examine the effect of
varying transport flow parameters on the city
atmosphere and select the environmentally optimal
parameter values.
The input data were systematized in tables and
then fed into a database using the developed input
forms. Account was made for the transport flow
parameters (its composition and intensity) and the
data on the emission of noxious substances into the
atmosphere. The site for the field study represented a
confluence of two major avenues and
accommodated several public transport routes
connecting the city’s newer and older parts.
Therefore optimizing of the traffic current
parameters primarily involved the route network.
Another approach consisted in using of buses with
greater capacity, which would both diminish the
traffic current density and reduce emissions of
harmful substances. Similar methods are described
in works (Saharidis, 2013). The optimization
experiment on a simulation model was carried out
using an OptQuest device and metaheuristic
methods.
At the first stage of the experiment, we
determined the optimal parameters for the traffic
current, such as density, intensity and speed, falling
within the quota for pollutant emissions.
Table 1: Point sizes and type styles.
Substance
name
The volume of emissions
100% fleet
on diesel
fuel
50% fleet
on gas
motor fuel
100% fleet on
gas motor fuel
CO 1.036 0.870 0.691
NOx 0.974 0.907 0.830
CH 0.499 0.437 0.386
Soot 0.581 0.102 0.043
SO2 0.578 0.422 0.361
formaldehyde 0.681 0.663 0.627
Benzapyrene 0.579 0.514 0.489
Managing an Urban Transport System in Enhancing the Area Stability
115

At the second stage, volumes of vehicular
emissions were determined. While preserving the
original parameters, we replaced a part of the public
transport with more environmentally friendly
vehicles. This considerably reduced the volumes of
emitted pollutants (Table 1).
The city is crossed by a longitudinal
thoroughfare comprising the Musa Djalil,
Naberezhnochelninsky, and Mira Avenues. The
traffic intensity, the highest among the city streets, is
3000 veh/h at a capacity of 3500 veh/h. During the
rush hours the vehicle flow gets stuck, the traffic
gets congested, with frequently occurring
bottlenecks. Maneuvering within the vehicle current
is hindered at turnarounds. There is an dangerous
area adjoining the “Pedinstitut” bus stop, where the
roadway narrows from three to two lanes, after
crossing with Nizametdinov street, as a result of
which vehicles are forced to change lines
immediately after the crossroads. At the nearest road
sections, inadequate traffic management has resulted
in even more dangerous situations. Thus, of the city
total of 472 vehicle crashes during 8 months of
2015, 37 in this avenue.
For more detailed analysis, we designed a
simulation model of the road section that took into
account the following parameters: the section
geometry, traffic flow density, intensity of
pedestrian flow, signalization modes at preceding
and succeeding sections, and the phase number in
traffic signals. As revealed by simulation
experiments, the traffic is negatively affected by
such factors as great density, inappropriate section
geometry, and numerous infrastructural elements
(such as public transport stops and turnarounds). It
was also proved that the flow density at
Naberezhnochelninsky Avenue is affected by two
unregulated turnarounds.
To reduce the aforementioned impacts, we
proposed a scheme of optimization of the crossing
layout, which included elimination of the nearest U-
turn with the lowest discharge capacity and using of
an alternative number of phases in the crossing
regulation, that is the combination of main and
intermediate regulation cycles. Correspondingly, for
changing of phase number we proposed to change
the time intervals between the signals.
Using the enumerative technique based on
metaheuristics, we determined the most appropriate
infrastructure for traffic signalization. A
conventional traffic light with two operation modes
and each phase of 148 seconds was substituted for a
multiphase timing signal automatically correcting
the phases and time of coordination of a set of
signalizing objects adapting to the traffic situation.
To set the adaptive mode in a traffic light, the
model processed the situations at several regulated
turnarounds located in the immediate proximity of
the road section and inter-influenced by the traffic
flow. The model registered the speed and density of
the traffic flow at each section. By analyzing these
characteristics, coming in real-time regime as
feedback from succeeding road system sections, and
it is possible to correct the length of green signal for
all directions according to optimal regimes
established in the model. Table 2 presents changing
of signal phases with adaptive control depending on
the traffic flow density. Adaptive regulation will
permit to smoothly relieve all sections of the road-
street system by responding to critical flow
parameters at individual sections and so forestalling
congestions and bottlenecks at succeeding sections.
Table 2: Variation of signal phase depending on flow
density.
Flow density at
the section
Total phase time,
sec.
Red signal (main
cycle), sec.
Green signal
(main cycle), sec.
Red and yellow
signal, sec.
Yellow signal,
sec.
Green with yellow
signal, sec.
95% 112 40 64 2 4 2
82% 112 42 62 2 4 2
74% 86 43 35 2 4 2
61% 86 48 30 2 4 2
Another problem area in the city of Naberezhnye
Chelny is located at the intersection of Chulman and
Druzhba Narodov Avenues (Figure 3a). According
to the traffic police data, it is a place with a high
concentration of road crashes, which both prevents
the normal operation of the transport system and
affects the environment. For more detailed analysis,
we designed a simulation model taking into account
the road section geometry, the intensity of pedestrian
flow, and traffic light modes at preceding and
succeeding sections. The target function was the
average speed of vehicles since the frequent road
crashes here are caused by high speed. The
simulation results have revealed that the traffic
quality at this section is affected by the following
factors: high flow density, high average speed of
vehicles, and the presence of an unregulated
pedestrian crosswalk.
The results of the road section survey can be
seen in Table 3. The data indicate to the possibility
of radical improvement of the traffic parameters.
VEHITS 2016 - International Conference on Vehicle Technology and Intelligent Transport Systems
116
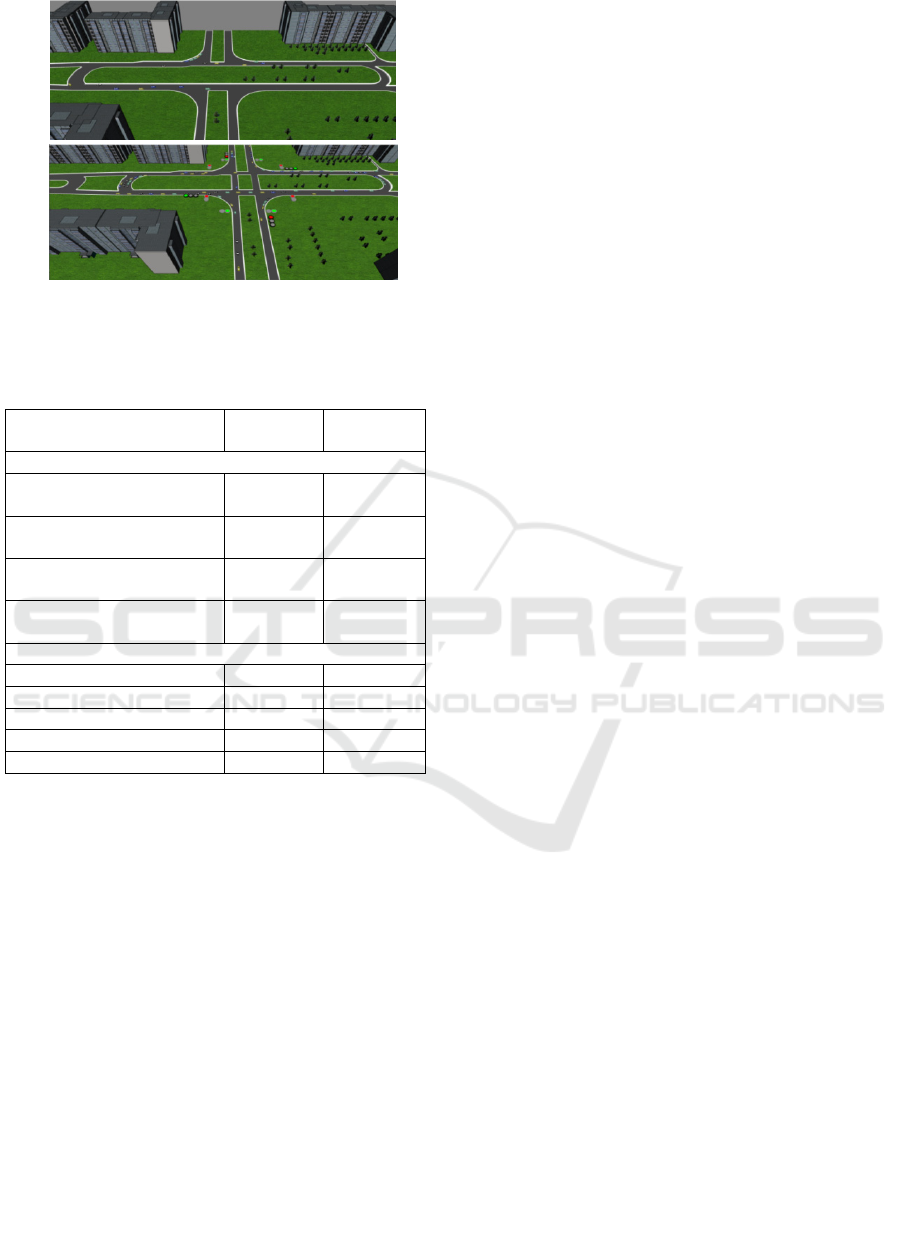
a)
b)
Figure 3: Simulation model: а) before optimizations; б)
after optimizations.
Table 3: Calculated parameters of the road section of
interest.
Parameter name Value before
modification
Value after
modification
Traffic flow parameters
Average speed, km/h at the
section
12 27
Number of stops per unit of
time, pcs
4 1
Flow density relatively the
road, %
92 67
Average time needed to
traverse the section, min
4 1,4
Air pollutants concentration
CO 1.042 0.879
NOx 0.972 0.937
CH 0.495 0.458
Soot 0.583 0.122
SO
2
0.574 0.428
To reduce the negative impacts, we proposed a new
intersection layout, involving a signal control. After the
model was modified (Figure 3b), experiments showed
that using the proposed variant will diminish the
likelihood of road crashes and stabilize the parameters
of vehicular and pedestrian flows.
The proposed plan of reconstruction of crossroad
allowed both to decrease accident hazard of the site
significantly at a lower cost and to decrease negative
impact on the environment. Also optimal traffic light
mode was determined which allowed to increase
pedestrian safety. Traffic police approved the
proposed solution and the reconstruction of the
crossroad had been carried out.
4 CONCLUSIONS
The research findings have demonstrated a
considerable contribution of automotive
transportation to urban air pollution. It has been
established that the problem should be approached
comprehensively. Simulation modelling can help to
identify the optimal parameters for the transport
flow and find rational managerial solutions.
REFERENCES
Eurostat, 2008. Energy and Transport in Figures.
Luxembourg: EC.
Eurostat, 2009. Eurostat database.
http://www.ec.europa.eu/eurostat (accessed
18.12.2015).
Fengqi, Z., Jun, S., 2010. Deploying an Intelligent
Transportation System in Chongming County.
Shanghai Journal of Urban Technology, Vol.17, Iss.3,
p. 39-51.
Gkritza, K., Karlaftis, M.G., 2013. Intelligent
Transportation Systems Applications for the
Environment and Energy Conservation (Part 1).
Journal of Intelligent Transportation Systems:
Technology, Planning, and Operations. Vol. 17, Iss.1,
p. 1-2.
Harb, R., Radwan, E., Abdel-Aty, M., Su, X., 2011. Two
Simplified Intelligent Transportation System-Based
Lane Management Strategies for Short-Term Work
Zones. Journal of Intelligent Transportation Systems:
Technology, Planning, and Operations, Vol. 15, Iss.1,
p. 52-61.
ITS for sustainable mobility, 2012.
http://www.unece.org/trans/publications/its_sustainabl
e_mobility.html (accessed 18.12.2015).
Jarašūniene, A., Batarlienė, N., 2013 Lithuanian road
safety solutions based on intelligent transport systems,
Transport, Vol. 28, Iss. 1, p. 97-107.
Konstantinov, A.P, 2012. Ecology and health: risks
mythical and real. Ecology and life, № 9, p. 82–86.
Makarova, I., Khabibullin, R., 2013. Intellectualization of
transport systems for the benefit of safety and the
sustainable development of territories. Journal of
International Scientific Publications: Ecology&Safety,
Vol. 7, P. 3, p.189-199.
Ran, B., 2012. Perspectives on Future Transportation
Research: Impact of Intelligent Transportation System
Technologies on Next-Generation Transportation
Modeling. Journal of Intelligent Transportation
Systems: Technology, Planning, and Operations. Vol.
16, Iss. 4, p. 226-242.
Saharidis, G.K.D., Dimitropoulos, C., Skordilis, E., 2013.
Minimizing waiting times at transitional nodes for
public bus transportation in Greece. An International
Journal “Operational Research". Vol. 13.
Truong Cong, D., Khoudour, L., Achard, C., Bruyelle, J.,
2011. Intelligent Distributed Surveillance System for
People Reidentification in a Transportation
Environment. Journal of Intelligent Transportation
Systems: Technology, Planning, and Operations, Vol.
15, Iss. 3, p. 133-146.
Managing an Urban Transport System in Enhancing the Area Stability
117
