
Preference based Filtering and Recommendations for Running Routes
Hassan Issa
1,2
, Amir Guirguis
3
, Shary Beshara
3
, Stefan Agne
1
and Andreas Dengel
1,2
1
German Research Center for Artificial Intelligence (DFKI), Kaiserslautern, Germany
2
Kaiserslautern University of Technology, Kaiserslautern, Germany
3
German University in Cairo, New Cairo City, Egypt
Keywords:
Quantified-self, Recommendation Systems, Web Information Filtering, Classification, Fitness.
Abstract:
With the current trend of fitness and health tracking and quantified self, hundreds of relevant apps and devices
are being released to the consumer market. Remarkably, some platforms were created to collect running-route
data from these different sources in order to provide a better value for users. Such data could be employed
in finding running routes based on the user’s preferences rather than being limited to the proximity to the
user’s location. In this work, a classification system for running routes is introduced considering performance
factors, visual factors and the nature of route. A running-route content-based recommender system is built on
top of this classification enabling learning user preferences from their performance history. The system was
evaluated using data from active runners and attained a promising recommendation accuracy averaging 84%
among all subject users.
1 INTRODUCTION
Personal fitness have been gaining an increasing at-
tention from both hardware manufacturers and soft-
ware developers in the recent years. Utilizing the
built-in smartphone sensors and GPS, many apps have
been built to monitor the activity of users and provide
useful insights and recommendations based on their
performance. New fitness gadgets and trackers with
extended capabilities have been also released to the
consumer market to further enhance the personal fit-
ness of users. Interestingly, performance data gath-
ered by users through many different apps and de-
vices are aggregated in online fitness platforms such
as MapMyFitness
1
, which integrates with more than
400 fitness tracking devices, sensors and wearables
and contains data of over 160 million of running, cy-
cling and walking routes around the world. The route
data is mainly used to retrieve nearby routes based on
the user’s current location.
Proximity, however, is not the only feature that
a person considers in her choice of suitable running
routes. In this work, several other aspects of run-
ning routes are considered to enable recommending
the users routes that best fit their preferences. In this
context, the considered features of running routes fall
1
http://about.mapmyfitness.com/
into three categories, namely:
• Performance Features: such as distance and vari-
ation in elevation.
• Visual Features: describing the route’s surround-
ing environment such as proximity to water or to
parks.
• Nature of Route: such as whether a route is a
track or not, an on-road or an off-road route and
whether it ends at its starting point.
In this research, a classification of running routes
based on different features of the route is proposed
in Section 3. Based on this classification, Section 4
presents a route recommender system that is designed
to fit the user’s needs based on her preferences and
performance history. This spares the user the need
to set her preferences when looking up a running
route by learning her preferences over time. The
recommender system is evaluated in Section 5 using
data from active runners assuming the use case where
users are recommended running routes that match
their preferences in new locations in which they had
no previous activity.
Issa, H., Guirguis, A., Beshara, S., Agne, S. and Dengel, A.
Preference based Filtering and Recommendations for Running Routes.
In Proceedings of the 12th International Conference on Web Information Systems and Technologies (WEBIST 2016) - Volume 2, pages 139-146
ISBN: 978-989-758-186-1
Copyright
c
2016 by SCITEPRESS – Science and Technology Publications, Lda. All rights reserved
139

2 RELATED WORK
The use of fitness trackers and apps in human activity
is a current trend in research. (Shafaee et al., 2014)
and (Issa et al., 2015) introduce an approach to as-
sess the reliability of market fitness trackers. (Hirsch
et al., 2014) highlights the significance of MapMyFit-
ness data to place physical activity into Neighborhood
Context. Several studies such as (Chen et al., 2007)
and (Pang et al., 1995) introduced preference-based
route navigation for drivers. (Quercia et al., 2014)
uses Flickr meta-data to determine pleasant locations
and suggests more beautiful walking routes to desti-
nations accordingly. (Knoch et al., 2012) applies arti-
ficial neural networks as a data mining methodology
for a context-aware running route recommender sys-
tem. A walking route recommender system consid-
ering route safety, amenity and walkability is intro-
duced in (Sasaki and Takama, 2013).
3 FILTERING ROUTES BY
FEATURES
A running route is basically a set of ordered loca-
tion points denoting longitude, latitude and elevation.
Through utilizing these data points, several features of
the route are inferred enabling the classification and
filtering of routes to match the personal preferences
of any individual. Sections 3.1 through Section 3.3
describe the significance of the considered features
and the approaches used in their computation. It is
worth mentioning that in the following computations
the original data points are sampled using Ramer-
Douglas-Peucker algorithm (Douglas, 1973) to ob-
tain a sufficiently similar route using a much smaller
subset of the route data points. This step enhances
the performance especially for Section 3.2.2 and Sec-
tion 3.3 where external API calls are used.
3.1 Performance Features
3.1.1 Distance
The distance of a route is perhaps the most critical
feature for people when deciding if a route is suit-
able for them. Usually the distance is provided among
other meta-data in fitness information systems like
MapMyFitness.com. However, if not provided, dis-
tance between two points in a route are accurately cal-
culated using the Haversine formula (Sinnott, 1984)
which computes great-circle distances between two
points on a sphere using their longitudes and latitudes.
3.1.2 Variation in Elevation
The loss and gain in elevation along running routes
are vital for quantifying their strenuousness with re-
spect to steepness. The variation in elevation is rep-
resented by two distinct values, which are the total
descent and total ascent. The total ascent value de-
notes the sum of upward vertical distance covered by
the runner in order to complete the route. The total
descent value is the value of downward vertical dis-
tance that the route entails.
3.2 Nature of Route
According to International Association of Athletics
Federation
2
(IAAF), running events are classified
upon the nature of their location into track, road and
cross-country running. Section 3.2.1 introduces an
approach to verify whether a route is a running track
or not. Section 3.2.2 distinguishes between road and
cross-country running routes.
3.2.1 Running Track
Running tracks are characterized by their standard-
ized shape and length. In order to assess if a route
is a track or not, a supervised learning approach is
applied. Considering the convex shape of a running
track, all the points defining the track must intuitively
trace, in close proximity, the smallest convex set con-
taining these points, i.e. their convex hull. Figure 1
and Figure 2 show the convex hull defined by a run-
ning track and an arbitrary route respectively. The
Quickhull algorithm (Barber et al., 1996) is used to
compute the convex hull for each running route. Two
features are then computed to enable the classification
process, namely:
• Average Distance to Convex Hull: which is the
average of all the distances between the points
constituting a route and its convex hull. This fea-
ture distinguishes convex and non-convex routes.
• Convex Hull Area/Perimeter Ratio: which helps
distinguish an arbitrary convex-shaped route from
a proper running track.
Using a set of 100 labeled routes divided across
20% training data and 80% testing data, the Naive
Bayes classifier is used to achieve a 100% accuracy
in the classification of routes as tracks or non-tracks.
3.2.2 On-road and Off-road Routes
In order to classify whether a route is on-road or off-
road, a mapping API is used to check the proximity
2
http://www.iaaf.org/disciplines
WEBIST 2016 - 12th International Conference on Web Information Systems and Technologies
140
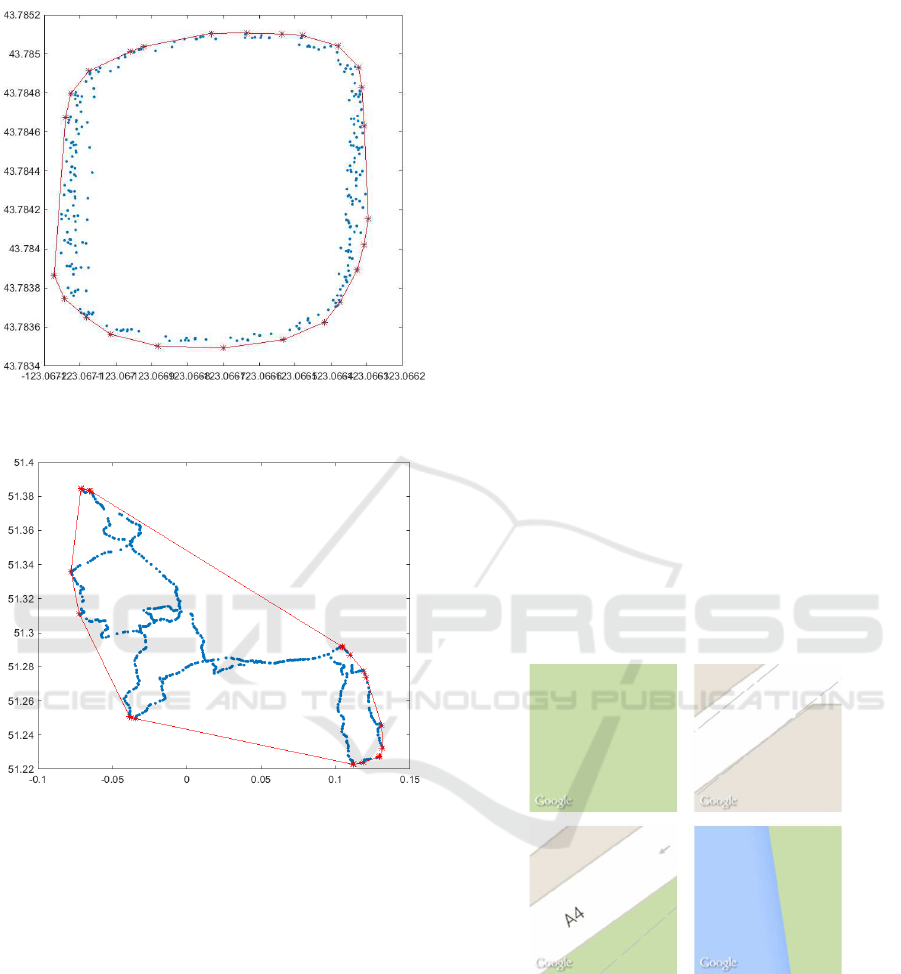
Figure 1: The convex hull defined by the points of a running
track.
Figure 2: The convex hull defined by the points of an arbi-
trary route.
of each of the route points to the nearest road. To
compensate for GPS inaccuracy, a threshold is exper-
imentally chosen above which a point is considered
off-road. Given that running routes can be composed
of both on-road and off-road segments, a route is thus
described by the percentages of its on-road and off-
road segments.
3.2.3 Same Starting and Ending point
People often try to end their runs in the same place
of their start to guarantee an equal total ascents and
total descents in their runs. This also is useful in situ-
ations where the runner starts from a parking spot or
near a bus stop for example. This is simply verified
by assessing the proximity of the starting and ending
points of a route.
3.3 Visual Features
The choice of a perfect running route is also influ-
enced by the route’s surrounding environment. In this
Section, the proximity to parks and water sources (e.g.
lake, sea, etc.) is considered. The same approach,
however, could be extended to include other places of
interest.
3.3.1 Using Google Places API
Google Places API is used to check the proximity of
route’s points to a park or water source. In addition
to the performance overhead using API calls, several
parks and water sources were not recognized by this
method.
3.3.2 Using Color Coding for Each Point
Mapping APIs use different colors to annotate differ-
ent types of terrain in a map. Following the retrieval
of an image showing the pixels surrounding each of
the route’s points as shown in Figure 3, scanning for
the color code of water sources and parks enables
the verifying the route’s proximity to them. This ap-
proach is highly precise, however it is computation-
ally expensive as it requires an API call followed by a
color scan for each point in the route.
Figure 3: Examples of pixels surrounding route points using
Google Maps API.
3.3.3 Using Color Coding for the whole Route
By applying a similar approach to the one presented in
Section 3.3.2, however retrieving one pixel map sur-
rounding the whole route as shown in Figure 4 and
mapping points of the route to an array of pixels in the
retrieved image, highly accurate results are achieved
even with reducing the number of API calls to one per
route.
Preference based Filtering and Recommendations for Running Routes
141
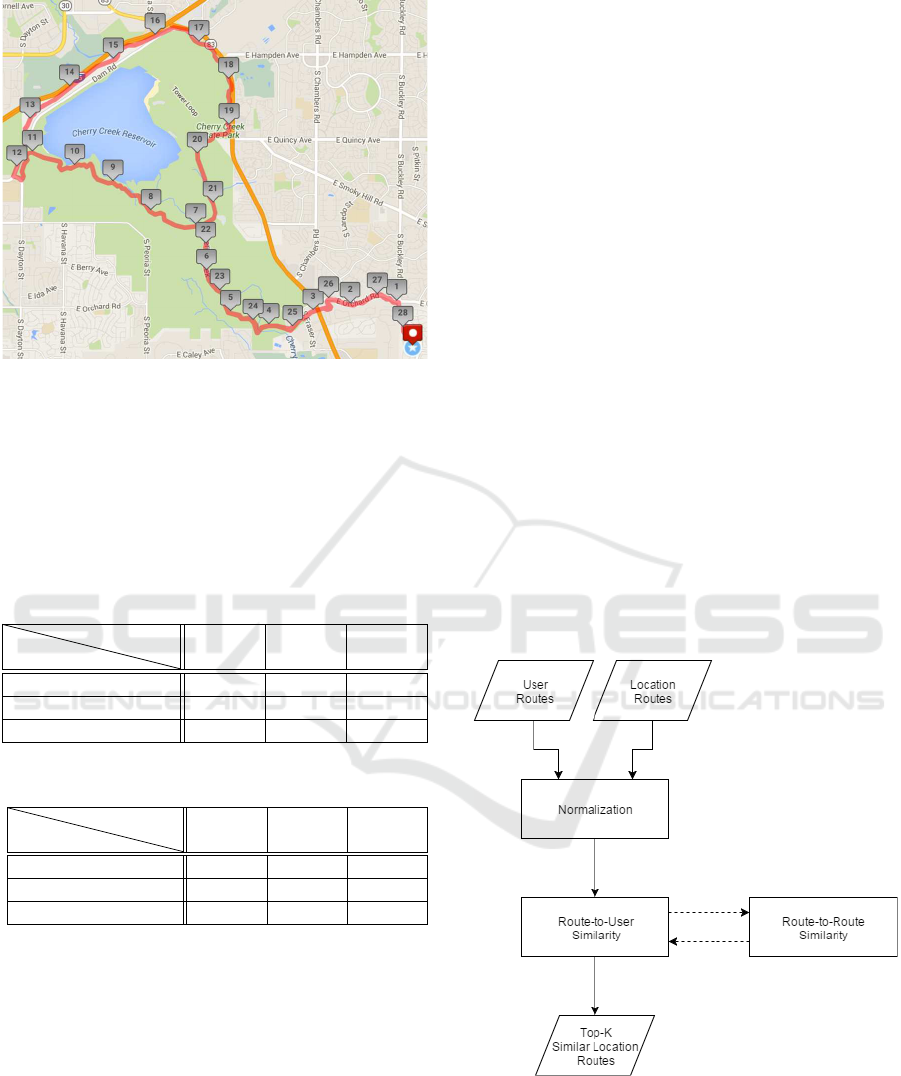
Figure 4: A pixel map surrounding a route as retrieved from
Google Maps API.
Evaluated using 150 labeled routes, this method
resulted in a precision of 98.3% and a recall 96.77%
for park proximity and a precision of 100% and a re-
call of 91.42% for water source proximity. Table 1
and Table 2 show the evaluation results for park prox-
imity and water source proximity respectively.
Table 1: Results of inferring proximity to a park.
Inferred
Truth
Park No Park Total
Park 60 1 61
No Park 2 87 89
Total 62 88 150
Table 2: Results of inferring proximity to a water source.
Inferred
Truth
Water No Water Total
Water 32 0 32
No Water 3 115 118
Total 35 115 150
3.4 Route Filtering Application
As discussed in Section 1, MapMyFitness hosts mil-
lions of user provided routes all over the world and
serves as a reliable data source for physical activ-
ity research (Hirsch et al., 2014). Routes from
the London-area are retrieved through MapMyFitness
API to show the effectiveness of the techniques used
above. After processing the route data, a web appli-
cation is used to enable the user to apply filters to re-
trieve routes that match her preferences. It is worth
mentioning that all the methods introduced can be ap-
plied to any route data regardless of its source and
MapMyFitness was only chosen for the abundance of
its data.
4 ROUTE RECOMMENDER
SYSTEM
The goal for building a running route recommender
system is to be able to provide a user with running
routes recommendations in any location, especially in
new locations where the user has a little knowledge
of the area and potential routes that might match her
preferences. The running route recommender system
is chosen to be content-based and uses the features
introduced in Section 3 to describe a route. Collabo-
rative Filtering, which relies on the notion that users
who have had similar preferences in the past are likely
to have similar preferences in the future, could hardly
be applied in this context. Arguably, collaborative fil-
tering could be used if the recommendations are lim-
ited to locations where a user has a running history,
this however does not apply for the intended use case
where the recommender system should provide rele-
vant routes in any location of the user’s choice.
4.1 Recommender System Overview
Figure 5: Overview of the Route Recommender System.
Figure 5 shows the main components of the pro-
posed recommender system. The system takes as in-
put two lists representing the user routes and the loca-
tion routes. Since each route is represented by mixed
numerical and categorical features, a statistical ap-
proach for normalization of mixed metrics is applied
WEBIST 2016 - 12th International Conference on Web Information Systems and Technologies
142

as introduced in (Suarez-Alvarez et al., 2012) where
the contribution of each feature to the similarity mea-
sure is divided by the contribution mean for this fea-
ture. Several approaches are introduced to compute
similarity of a route to a user, all of which rely on a
consistent route-to-route similarity computation. Af-
ter a proper aggregation of the route-to-user similar-
ities, the top-k location routes similar to a user are
returned as recommendations.
4.2 Similarity Measurement
A normalized route r is defined as an n −dimensional
vector representing the n numeric and categorical fea-
tures of a route namely: distance, elevation, percent-
age of on-road segment, same start and end point,
close to a water source, close to a park, and represents
a track.
r = (dis, ele, road, closed, water, park, track) (1)
Note that elevation is a combined feature of total
ascents and total descents in a route as shown in For-
mula 2. The amount of these contributions, indicated
by α, is determined experimentally in Section 5.3. In-
tuitively, ascents contribute more to the elevation fea-
ture as they have a huge impact on the difficulty of a
running route.
The similarity of two routes is defined as the Eu-
clidean distance separating the two routes and is de-
fined in Formula 3. This similarity is applied to com-
pute the similarity of a route to a user using multiple
approaches as presented in Section 4.2.1 through Sec-
tion 4.2.3.
ele = α.asc + (1 − α).des (2)
ED(r, r
0
) =
s
n
∑
i=1
(r
i
− r
0
i
)
2
(3)
4.2.1 Average Route-to-User Similarity
This approach assigns the average similarity of a loca-
tion route and all user routes as the similarity score of
this location route to the user. Let U and L denote the
sets of all user routes and location routes respectively
and card(U) denote the number of user routes. The
average similarity of a route to a user S
avg
is presented
in Formula 4.
S
avg
(l, U) =
∑
u
i
∈U
ED(l, u
i
)
card(U )
;∀l ∈ L (4)
This approach computes all the pairwise similari-
ties of the location routes and the user routes in order
to obtain the top-k recommended location routes for a
user.
4.2.2 Highest Similarity Pair
Instead of averaging the similarity of a location route
to all user routes as proposed in Section 4.2.1, this
approach also computes all the pairwise similarities
of location routes and user routes, however, for all lo-
cation routes, it assigns the highest similarity score of
a location route to any of the user routes as the route
to user similarity. This means that it is enough for a
location route to be highly similar to only one user
route to be included in the user recommended routes.
S
max
(l, U) = max
u
i
∈U
(ED(l, u
i
));∀l ∈ L (5)
4.2.3 User Representative Route
This approach assigns one route u
rep
to represent all
the user routes as a first step (Formula 6). It then com-
putes the similarity of location routes to this user rep-
resentative route as shown in Formula 7.
u
rep
=
∑
u
i
∈U
U
i
card(U )
(6)
S
rep
(l, U) = ED(l, u
rep
);∀l ∈ L (7)
This approach has a computational advantage over
the previous two approaches because it does not re-
quire the computation of all pairwise location route to
user route similarities.
Following any of the approaches proposed, the
recommender system selects the top-k location routes
and returns them as an output.
5 EVALUATION OF ROUTE
RECOMMENDER SYSTEM
For the evaluation of the proposed system, a testing
dataset is built based on user and location routes from
MapMyFitness and annotated preferences from par-
ticipating active runners.
5.1 Dataset and Metric
A group of 14 active users of MapMyFitness with var-
ious locations and an average of 177 routes per user
are considered for the evaluation. Figure 6 shows the
number of logged routes ran by each of these users.
To resemble a real-life situation where users from
different locations move to a new location with lit-
tle or no information about its running routes, a set
of 100 routes were selected from the city of London
as location routes. The 14 users were required to an-
notate their ratings on Likert scales for a total of 30
Preference based Filtering and Recommendations for Running Routes
143
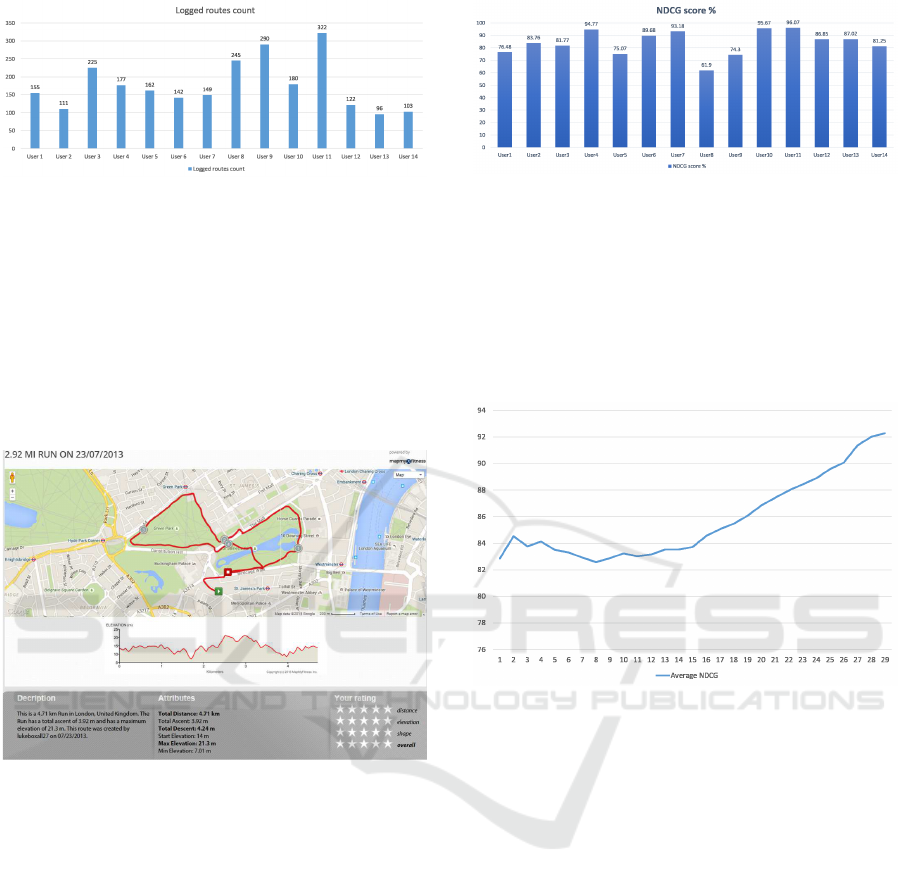
Figure 6: Number of Logged Routes per User.
routes each through a webpage which presents them
a map for every running route along with additional
data about the route as shown in Figure 7. The user
ratings form the ground truth to which the system-
produced recommendations are compared. Normal-
ized Discounted Cumulative Gain (nDCG) is then
used to measure the performance of the recommenda-
tion system based on the graded relevance of the rec-
ommended routes (J
¨
arvelin and Kek
¨
al
¨
ainen, 2000).
Figure 7: A snapshot of a Route Rating’s Webpage.
5.2 Overall Recommendation
Evaluation
After tuning the system to the experimentally deter-
mined optimal contribution ratio of ascents to de-
scents and using the best approach to compute route-
to-user similarity and as shown in Section 5.3 and
Section 5.4 respectively, the nDCG scores of the top
5 recommended routes for each user are presented in
Figure 8. The average nDCG score attained in this fi-
nal configuration is 84.13%. This indicates the qual-
ity of the recommendations provided by the system
in terms of both the routes selected and the order in
which they are recommended.
The performance of the system varies along with
the variation of the number of returned recommen-
dations by the system. To study the effect of this
variation, nDCG scores of one and up to 30 recom-
mendations per user are computed. The resulting av-
Figure 8: nDCG-5 Scores for System Recommendations
per User.
erage nDCG scores per number of recommendations
are presented in Figure 9. For a total of 30 rated routes
per user, a recommendation of up to five routes seems
reasonable as it is not probable to have much more
highly similar routes to the user’s routes among the
30 rated location routes.
Figure 9: Average nDCG Scores for Different Number of
Returned Recommendations.
5.3 Optimal Ascents-to-Descents Ratio
As previously indicated in Section 4.2, the contribu-
tion of ascents (resp. descents) to the computation of
elevation feature is determined by α (resp. (1 − α))
in Formula 2. Figure 10 exhibits the effect of varying
the elevation weight in steps of 0.05 between ascents
and descents. The optimal value for α is 0.75 − 0.8
as shown in the figure where the nDCG hits a max-
imum of 84.13% indicating that ascents are three to
four times as important as descents for determining
runners preferences on average.
5.4 Route-to-User Similarity Evaluation
Three approaches for aggregating the similarity of
each location route with respect to the user as a whole
have been introduced in Section 4.2. The perfor-
mance of these different approaches is shown in Fig-
ure 11. The Representative Route approach produces
the highest average nDCG score among the 14 partici-
WEBIST 2016 - 12th International Conference on Web Information Systems and Technologies
144
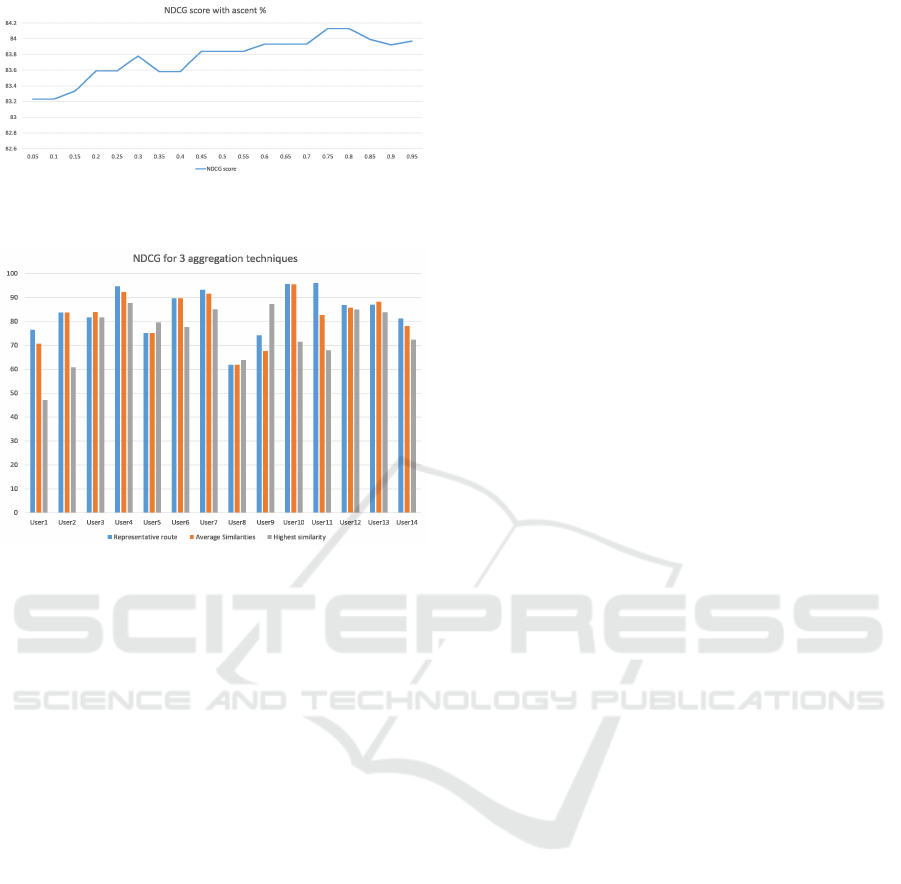
Figure 10: Effect of Varying the Weight of Ascents-to-
Descents (α) on the Overall Quality of Recommendations.
Figure 11: Comparison of the Effect of the different Route-
to-User Similarity Methods.
pants, with a score of 84.13%. The Average Route-to-
User Similarity approach came in second place with
a score of 81.93%. Finally, the Highest Similarity
Pair method produced the lowest result of 75.14%.
Notably, and as indicated in Section 4.2.3, the Rep-
resentative Route approach has the best performance
among the three considered approaches as it does not
require computing all the pair-wise similarities among
all the user routes and location routes.
6 CONCLUSIONS AND FUTURE
WORK
In this research, a classification of running routes
based on route’s nature, performance and visual fea-
tures is introduced. The classification enables filter-
ing the vast amount of running routes available on the
web according to the user’s preferences. Using the
same features of a route, a recommender system is
built to learn the user’s preferences from her previous
recorded runs and provide recommendations of suit-
able running routes in the user’s location of choice.
The recommendations are tested using active runners
history data and annotations and attained a recom-
mendation accuracy of 84.13%.
To further extend the capabilities of the system,
additional data from sensors included in fitness track-
ers and smartphones are to be utilized by the system.
Such data can provide more information about the
surface of the route and the running styles of people.
Additionally, providing recommendations for other
types of activities such as cycling or skiing forms a
potential future use case for this research.
ACKNOWLEDGEMENTS
This work was partially funded by the BMBF project
Multimedia Opinion Mining (MOM: 01WI15002)
and is part of the project SERVICEFACTORY.
REFERENCES
Barber, C. B., Dobkin, D. P., and Huhdanpaa, H. (1996).
The quickhull algorithm for convex hulls. ACM Trans.
Math. Softw., 22(4):469–483.
Chen, Y., Bell, M., and Bogenberger, K. (2007). Reli-
able pretrip multipath planning and dynamic adapta-
tion for a centralized road navigation system. Intel-
ligent Transportation Systems, IEEE Transactions on,
8(1):14–20.
Douglas, D. (1973). Algorithms for the reduction of the
number of points required to represent a line or its a
caricature. The Canadian Cartographer, 10(2):112–
122.
Hirsch, J. A., James, P., Robinson, J. R. M., Eastman,
K. M., Conley, K. D., Evenson, K. R., and Laden,
F. (2014). Using mapmyfitness to place physical ac-
tivity into neighborhood context. Frontiers in Public
Health, 2(19).
Issa, H., Shafaee, A., Agne, S., Baumann, S., and Dengel,
A. (2015). User-sentiment based evaluation for market
fitness trackers - evaluation of fitbit one, jawbone up
and nike+ fuelband based on amazon.com customer
reviews. In ICT4AgeingWell 2015 - Proceedings of
the 1st International Conference on Information and
Communication Technologies for Ageing Well and e-
Health, Lisbon, Portugal, 20-22 May, 2015., pages
171–179.
J
¨
arvelin, K. and Kek
¨
al
¨
ainen, J. (2000). IR evaluation meth-
ods for retrieving highly relevant documents. In SI-
GIR, pages 41–48.
Knoch, S., Chapko, A., Emrich, A., Werth, D., and Loos, P.
(2012). A context-aware running route recommender
learning from user histories using artificial neural net-
works. In Database and Expert Systems Applications
(DEXA), 2012 23rd International Workshop on, pages
106–110.
Pang, G., Takahashi, K., Yokota, T., and Takenaga, H.
(1995). Adaptive route selection for dynamic route
guidance system based on fuzzy-neural approaches.
In Vehicle Navigation and Information Systems Con-
ference, 1995. Proceedings. In conjunction with the
Preference based Filtering and Recommendations for Running Routes
145

Pacific Rim TransTech Conference. 6th International
VNIS. ’A Ride into the Future’, pages 75–82.
Quercia, D., Schifanella, R., and Aiello, L. M. (2014).
The shortest path to happiness: Recommending beau-
tiful, quiet, and happy routes in the city. CoRR,
abs/1407.1031.
Sasaki, W. and Takama, Y. (2013). Walking route recom-
mender system considering saw criteria. In Technolo-
gies and Applications of Artificial Intelligence (TAAI),
2013 Conference on, pages 246–251.
Shafaee, A., Issa, H., Agne, S., Baumann, S., and Den-
gel, A. (2014). Aspect-based sentiment analysis
of amazon reviews for fitness tracking devices. In
Trends and Applications in Knowledge Discovery and
Data Mining - PAKDD 2014 International Work-
shops: DANTH, BDM, MobiSocial, BigEC, CloudSD,
MSMV-MBI, SDA, DMDA-Health, ALSIP, SocNet,
DMBIH, BigPMA,Tainan, Taiwan, May 13-16, 2014.
Revised Selected Papers, pages 50–61.
Sinnott (1984). Virtues of the haversine. skytel, 68:158.
Suarez-Alvarez, M. M., Pham, D.-T., Prostov, M. Y., and
Prostov, Y. I. (2012). Statistical approach to nor-
malization of feature vectors and clustering of mixed
datasets. Proceedings of the Royal Society of London
A: Mathematical, Physical and Engineering Sciences,
468(2145):2630–2651.
WEBIST 2016 - 12th International Conference on Web Information Systems and Technologies
146
