
Interactive Visualization and Big Data
A Management Perspective
Thomas Plank
1
and Markus Helfert
2
1
Controlling, Finance and Accounting Department, University of Applied Sciences Upper Austria,
Wehrgrabengasse 1-3, Steyr, Austria
2
School of Computing, Dublin City University, Glasnevin, Dublin, Ireland
Keywords: Interactive Visualization, Effective Decision Making, Big Data, Human-Information-Interaction.
Abstract: This position paper presents a systematic literature review that aims to identify research topics and future
research possibilities in the area of interactive visualizations of big data in a management perspective.
Therefore, the authors reviewed journals listed in the Index of Information Systems Journals and the
Computing Research and Education Association derived from the databases “EBSCO Business Source
Premier”, “Sage Premier” and “Science Direct” from 2005 to 2015. The authors reviewed 993 abstracts and
identified 122 peer-reviewed publications as relevant to the topic. Based on this interdisciplinary collection
of research papers, the authors will identify the key research topics and derive future research possibilities
that need to be undertaken.
1 INTRODUCTION
In recent years the amount of available data is
rapidly increasing and due to technological
improvements it will further expand dramatically in
the next years. This vast amounts of data
(summarised as “Big Data”) are the result of
innovation in the era of the so called “Internet of
Things” and investments to digitalize the value chain
of a company to gain deeper insights. Big data will,
according to Philip Chen and Zhang (2014) and
others, revolutionize many fields, including
business, public administration and also scientific
research.
There are various definitions of big data centre
upon the 3Vs and are lately extended to 4Vs. Doug
Laney uses volume, velocity and variety (Laney,
2001) as the 3Vs and Zikopoulos and Eaton (2011)
added the fourth V that can be interpreted as value,
variability or virtual. Philip Chen and Zhang (2014)
more commonly describe big data as a collection of
very huge data sets with a great diversity of types so
that there occur difficulties in processing these vast
amounts of data with state-of-the-art approaches.
This development sets the business intelligence and
analytics field for huge challenges. Nevertheless,
Chen et al. (2012) describe the importance of
business intelligence and analytics and the related
field of big data analytics for both researchers and
practitioners, to solve data-related problems in
contemporary business organizations.
The number of dedicated venues, initiatives and
publications regarding this topic reveal a continuous
and growing trend. Beside the academic interest,
practitioners in government, industry and business
have found that there arise enormous opportunities
through big data (Arave et al., 2014). Philip Chen
and Zhang (2014) and Schoenherr and Speier-Pero
(2015) also claim that big data is highly valuable to
increase productivity in business and produce
evolutionary breakthroughs in scientific disciplines.
There is a consensus among these scholars that the
future competitions in business will surely converge
into the big data explorations. However, they
conclude that with big data arise many challenges.
Other scholars support this point of view and claim
that the nascent issues reach from data capture, data
storage over data analysis to data visualization.
(Philip Chen and Zhang, 2014; Chen et al., 2012;
Arave et al., 2014; Lemieux et al., 2014)
Arave et al. (2014) and Howe et al. (2008) state
that the data, that is produced at great expense and
effort, are only as useful as the possibilities to
analyse and interpret them. Therefore, the cognition-
based perspective is an important aspect of
information visualization and impacts the quality of
42
Plank, T. and Helfert, M.
Interactive Visualization and Big Data - A Management Perspective.
In Proceedings of the 12th International Conference on Web Information Systems and Technologies (WEBIST 2016) - Volume 2, pages 42-47
ISBN: 978-989-758-186-1
Copyright
c
2016 by SCITEPRESS – Science and Technology Publications, Lda. All rights reserved

decision- and sense-making based on this data (Al-
Kassab et al., 2014). The the human information
processing system cannot process these amounts of
information due to the limitation of the working
memory (Lemieux et al., 2014).
1.1 Data Visualization and Big Data
Card et al. state that “the goal of visualization is
insight and not pictures” (Card et al., 1999). Thus, to
provide a comprehensive insight into the enormous
amount and variety of data, the information
visualization discipline has to adjust to the changing
requirements and framework conditions that arise by
the vast growth and diversity of data in the last
decade.
Especially for big data applications, it is difficult
to conduct visualization arising from the large size
and variety of data. Philip Chen and Zhang (2014)
argue that current big data visualizations (Heer et al.,
2008; Keim et al., 2004) mostly have poor
performance and that the techniques to capture,
curate, analyse and visualize the data are far away
from meeting the variety of needs. They state that it
is necessary to rethink the way we visualize big data.
Cuzzocrea et al. (2011) support this argument by
claiming that actual analytics still does not go
beyond classical components like diagrams, plots
and dashboards, but complex business-intelligence
processes demand for more advanced tools. In their
opinion, visualization issues represent a leading
problem in current research. Card et al. (1999)
describe “visualization” as “the use of computer-
supported, interactive visual representation of data to
amplify cognition.” This definition outlines the
intersection of the research field information
visualization with the field of human-information-
interaction.
An essential influencing factor on the usage of
information is the purpose and the information-
seeking-behaviour. For example, Parson and Sedig
(2013) analyse the influencing properties of
interactive visualizations that tend to have an impact
on the cognitive processes and on visual reasoning.
They argue that, performance of complex cognitive
activities involves active and goal-directed
information processing by human beings (Funke,
2010). This information processing consists of using
and interacting with given information to derive
insight (Knauff and Wolf, 2010). That implies that
humans interact with information to support their
thinking processes that are used for solving
problems and making decisions. As a consequence,
Parson and Sedig (2013) characterize “humans” in
their research as actors, because they focus on the
activity aspect of human-information-interaction.
Following this, they argue that static visualizations
tend to force the actor to exert a great deal of mental
effort in order to reason and think about the
information. The mental processes (e.g. abstractions,
comparison) take place over a span of time and
involve constant assimilation and reorganization of
information, which is not sufficient assisted by static
visualizations. Interaction, instead, can potentially
bridge this issue by encouraging the actor to grapple
with the provided information. (Parson and Sedig,
2013) Authors such as (Elmqvist et al., 2011; Green
and Fisher, 2010; Meyer et al., 2007; Sedig and
Parsons, 2013; Spink and Cole, 2006) state that the
process of stimulation and enabling reasoning with
the aid of interactive visualizations is still a highly
unexplored field. They also argue that current
research barely scratched the surface of this new line
of research and much work remains to be done.
Another relevant aspect in the concert of human-
information-interaction and visualization are the
different display opportunities such as smartphones,
tablets and smartwatches. Burford and Park (2014)
hypothesise that mobile computing devices are a
significant access point for information seeking
activities and current theories and models do not
consider the role of the individual devices in digital
information interactions. Alongside with the
interaction, the representation of information
depends on the individual purpose. The purpose is,
on a high level, separated into explanatory and
exploratory issues. Exploratory data analysis has a
high intersection with human-information-
interaction and data mining. Current visual data
mining techniques are of high value in exploratory
data analysis and are especially useful when little is
known about the data and the exploration goals are
vague (Keim, 2002). However, information
visualization tools and data mining algorithms
originate from two separate lines of research. On the
one hand, data mining researcher claim that
statistical algorithms and machine learning is the key
to find the interesting patterns. On the other hand,
information visualization researchers believe in the
importance of giving users an overview and insight
into the data distributions (Shneiderman, 2002).
Shneiderman (2002) argues that, the combination of
the advantages of data mining and information
visualization will lead to new insights and a more
efficient processing with high amounts of data.
The interaction with information can, for
explanatory purposes, be paraphrased as a story that
is told through data. Narrative visualizations
Interactive Visualization and Big Data - A Management Perspective
43

especially focus on this area of research. Segel and
Heer (2010) describe narrative visualization as the
melting pot of computer science, statistics, artistic
design and storytelling. Diagrams and charts
embedded in a larger body of text where used to tell
a story with static visualizations. However, in a big
data world these visualizations have to adapt to this
new frame conditions. In today’s business and rapid
changing environment, complex cognitive activities
cannot be based on a static visualization without
context or metadata. Decision maker need to know
the assumptions, source and quality of underlying
data and explanatory power to sufficient support
their thinking-process. Therefore, Segel and Heer
(2010) claim that visual storytelling is of critical
importance for providing intuitive and fast
exploration of very large amounts of data.
This overlap between different areas of research,
the mentioned research gaps and the impact on the
different areas through big data suggest that, a
comprehensive and cross-sectional view on the
topics big data, information visualization and
human-information-interaction and their connections
is essential.
1.2 Purpose
The purpose of this paper is to provide an
interdisciplinary foundation for future research and
therefore examines and clusters current literature on
big data, information visualization and human-
information-interaction. The paper therefore seeks to
address the following research questions:
1. Which relevant topics within the subject of
“interactive visualizations” can be
identified?
2. What are the research opportunities and
controversies identified by the authors?
These research questions aim to identify
and abstract future issues out of current literature for
empirical exploration. To unveil further research
relevance and topics, an interdisciplinary and
critical review of empirical research as well as
theoretical foundations is conducted. Therefore, a
systematic literature review was chosen by the
author above other alternatives to answer the stated
research questions (Okoli and Schabram, 2010;
Webster and Watson, 2002).
2 METHOD
2.1 Systematic Literature Review
Due to the recent increase in published papers
(Figure 2) and to structure this interdisciplinary area
of interest, we decided to apply a systematic
literature review and shed light on current streams
and future research possibilities. Our review of
articles in the area of interactive visualization of big
data in a management perspective is not just a
summary of available and relevant literature.
Therefore, it is interdisciplinary because it aims to
identify interferences, similarities and differences
among the various management perspectives and
show to what extent they have discussed this area of
interest. Additionally, this research should also help
readers to better understand the area of focus and
highlight possible purposes for their own work.
Systematic reviews of pertinent literature are
conducted for a broad range of objectives. They
reach from providing a theoretical background for
subsequent research or answering practical questions
by understanding the existing research to constitute
an original and valuable work of research itself.
Therefore, this systematic literature review aims to
identify intersections between the different streams
and among disciplines. The outcome of this paper
should lead to a complete understanding of
information visualization of big data in a
management perspective and highlight future
research area. According to Okoli and Schabram
(2010) a rigorous stand-alone literature review has to
be systematic and guided by a methodological
approach. It is essential to explain the procedures by
which it is conducted, exhaustive in its scope and
including all pertinent literature to be reproducible
by others who want to follow the same approach to
review the topic.
In this research paper we follow the guide of
Okoli and Schabram (2010) and use a detailed
protocol for recording our approach. This should
provide a sound basis to retrace this systematic
literature review. In the first step, we gathered a first
list of key words to start the initial literature search.
After reading through the first papers, the relevant
keywords were marked and added to the list. This
list, originally based on Falschlunger et al. (2015)
and Falschlunger et al. (2016), expanded to a mind
map grouping all relevant keywords into topics and
serves as starting point for this systematic review of
relevant literature (Figure 1).
WEBIST 2016 - 12th International Conference on Web Information Systems and Technologies
44
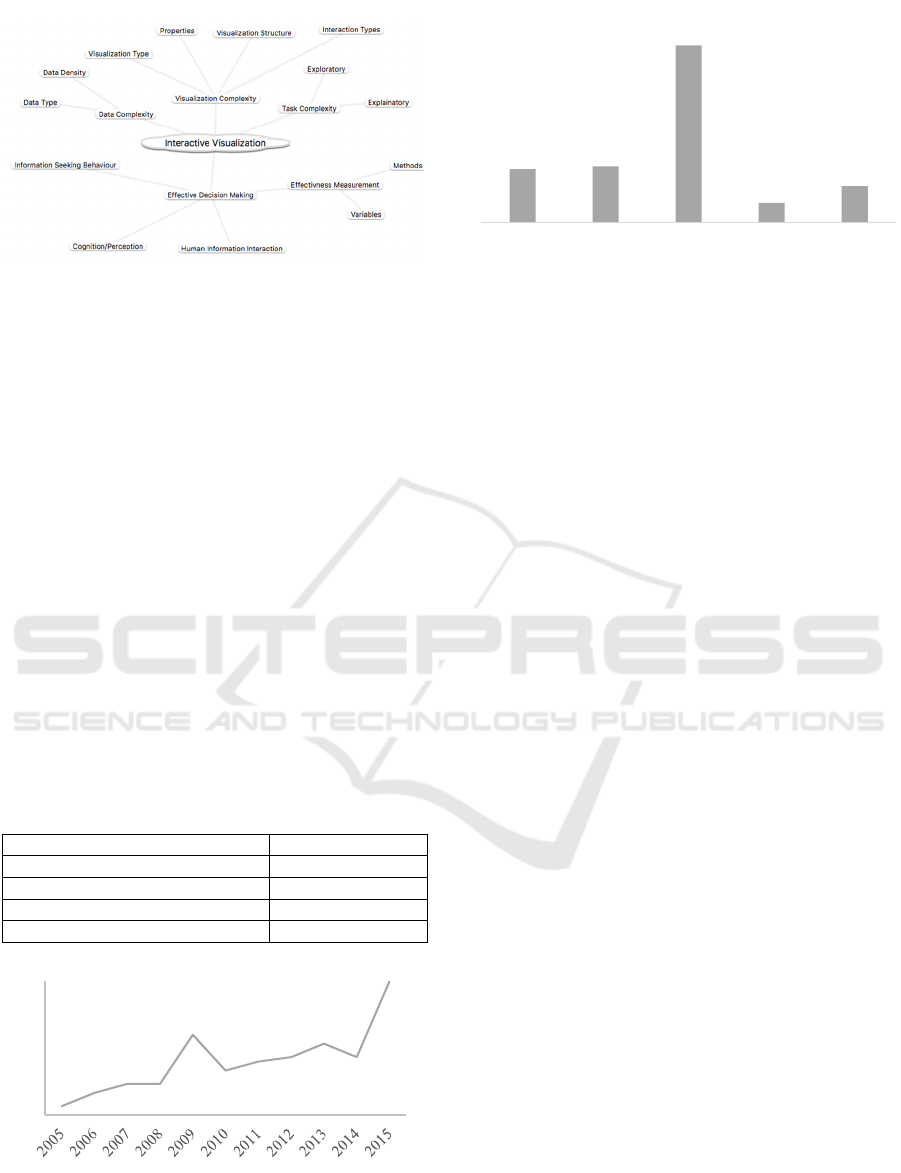
Figure 1: Relevant keywords grouped by topics.
This review consists of papers published in
peer reviewed journals listed in the Index of
Information Systems Journals and the Computing
Research and Education Association derived from
the databases “EBSCO Business Source Premier”,
“Sage Premier” and “Science Direct” from 2005 to
2015. To take the broad scope of
the interdisciplinary topic into account, it was
necessary to extend the focus on several databases
and journals. The used database allowed a keyword
search in the title or abstract with the keywords
derived from the authors initial literature search
(Figure 1) and combined by the Boolean operator
‘AND’. Applying this approach resulted in a list of
993 abstracts. After reviewing all these abstracts,
122 publications in 46 journals were identified as
relevant by the authors and form the basis of the
systematic literature review. The distribution of the
peer-reviewed articles arising from the keyword
search is as follows (Table 1, figure 2 and figure 3):
Table 1: Distribution by databasis.
Database Papers identified
EBSCO Business Source Premier 29
SAGE Journals 58
ScienceDirect 35
Total 122
Figure 2: Identified papers by year of publication.
Figure 3: Identified papers grouped by Scientific Journal
Ranking (SJR).
Levy and Ellis (2006) state that, theoretical
saturation can only be achieved by applying a
backward search beneath the keyword search. The
backward search will be based on the identified
publications and added to the collection of papers.
2.2 Limitations
In this research the authors applied the keyword
search as well as the backward search to ensure
theoretical saturation. However, the author cannot
guarantee that all relevant studies for answering the
research questions have been identified. By failing
to identify all relevant studies, important models or
theories might not be included in this review.
Furthermore, by only including studies published in
journals listed in the Index of Information Systems
Journals and the Computing Research and Education
Association, studies relevant to the subject not
published in listed journals have not been
considered. (Bryman and Bell, 2011).
3 CONCLUSION AND SUMMARY
According to the number of published peer-reviewed
publications, there has been an increasing interest in
this the field of interactive visualizations. This
recent development and the increasing involvement
of several major research areas seek for a critical,
systematic and transparent view of current literature.
The initial review of abstracts and identified papers
draws the conclusion, that interactive visualization
in a management perspective is a nascent field of
research. Traditionally, visualizations were
investigated in a scientific context and far too little
attention has been paid to the application
possibilities in management research. Additionally,
the implications of cognition processes and
0
30
19
20
63
7
13
0 - 0,500 0,501 -
1,000
1,001 -
1,500
1,501 -
2,000
> 2,000
Interactive Visualization and Big Data - A Management Perspective
45

information seeking behaviour on effective decision
making are also underrepresented in current
literature.
However, latest research starts to address
implications of cognition processes and information
seeking behaviour on sense-making and indicates a
growing interest in this area of research. To date
there has also been little evidence about
effectiveness measurement methods and associated
variables. This area of interest should also be
investigated in future research to prepare the ground
for quantitative analysis of interactive visualizations.
To examine this preliminary findings the authors
follow the instructions for a systematic literature
review provided by Okoli and Schabram (2010) and
continue by conducting a backward search to gain
theoretical saturation (Levy and Ellis, 2006). The
additional encountered publications will be added to
the previous gathering. This collection of peer-
reviewed publications will afterwards be reviewed
and classified into relevant research topics.
The several relevant research topics will then be
summarized and the quality of the included studies
will be appraised. For each topic the following
questions will be answered
• What are the key theories or concepts?
• What are the main questions and problems that
have been addressed to date?
• What are the major issues and debates about
the topic?
• Who are the main authors or research
institutions driving this research topic?
These findings will enhance our understanding of
interactive visualizations of big data in a
management context. Future research should
therefore concentrate on the investigation of the
influence of interactive visualizations on effective
management decision-making, and therefore
provides valuable insights into developing
innovative visualization tools.
REFERENCES
Al-Kassab, J. et al., 2014. Information visualization to
support management decisions. International Journal
of Information Technology & Decision Making, 13(2),
pp.407–428.
Arave, G. et al., 2014. Big data, bigger dilemmas: A
critical review. Journal of the Association for
Information Science and Technology, (AUGUST).
Bryman, A. & Bell, E., 2011. Business Research Methods,
Burford, S. & Park, S., 2014. The impact of mobile tablet
devices on human information behaviour. Journal of
Documentation, 70(4), pp.622–639.
Card, S.K., Mackinlay, J.D. & Shneiderman, B., 1999.
Readings in Information Visualization: Using Vision
to Think. In Information Display. p. 686.
Chen, H., Chiang, R.H.L. & Storey, V.C., 2012. Business
Intelligence and Analytics: From Big Data to Big
Impact. MIS Quarterly, 36(4), pp.1165–1188.
Cuzzocrea, A., Song, I.-Y. & Davis, K.C., 2011. Analytics
over large-scale multidimensional data: the big data
revolution! … 14th international workshop on Data,
pp.101–104.
Elmqvist, N. et al., 2011. Fluid interaction for information
visualization. Information Visualization, 10(4),
pp.327–340.
Falschlunger, L., Lehner, O., Losbichler, H., Grabmann,
E., 2015. Deriving a holistic cognitive fit model for an
optimal visualization of data for managmeent
decisions. Proceedings of the International
Symposium on Partial Least Spare Path Modeling,
Seville, pp.1-6.
Falschlunger, L., Lehner, O., Treiblmaier, H., Eisl, C.,
2016. Perceptive efficiency given visual
representations of information: the effect of
experience. Proceedings of 49th Hawaii International
Conference on System Sciences (HICSS-49), pp. 668-
676.
Funke, J., 2010. Complex problem solving: A case for
complex cognition? Cognitive Processing, 11(2),
pp.133–142.
Green, T.M. & Fisher, B., 201f0. Towards the personal
equation of interaction: The impact of personality
factors on visual analytics interface interaction. VAST
10 - IEEE Conference on Visual Analytics Science and
Technology 2010, Proceedings, pp.203–210.
Heer, J. et al., 2008. Graphical histories for visualization:
Supporting analysis, communication, and evaluation.
IEEE Transactions on Visualization and Computer
Graphics, 14(6), pp.1189–1196.
Howe, D. et al., 2008. Big data: The future of biocuration.
Nature, 455(7209), pp.47–50.
Keim, D., 2002. Information Visualization and Visual
Data Mining. IEEE Transations on Visulization and
Computer Graphics, 8(1), pp.1–8.
Keim, D.A. et al., 2004. Visual Data Mining in Large
Geospatial Point Sets. IEEE Computer Graphics and
Applications
, 24(5), pp.36–44.
Knauff, M. & Wolf, A.G., 2010. Complex cognition: The
science of human reasoning, problem-solving, and
decision-making. Cognitive Processing, 11, pp.99–
102.
Laney, D., 2001. 3D Data Management: Controlling Data
Volume, Velocity, and Variety. Application Delivery
Strategies, 949(February 2001), p.4.
Lemieux, V.L., Gormly, B. & Rowledge, L., 2014.
Meeting big data challenges with visual analytics.
Records Management Journal, 24(2), pp.122–141.
Levy, Y. & Ellis, T.J., 2006. A Systems Approach to
Conduct an Effective Literature Review in Support of
Information Systems Research. Science Journal, 9(1),
pp.181–212.
WEBIST 2016 - 12th International Conference on Web Information Systems and Technologies
46

Meyer, J. et al., 2007. From Visualization to Visually
Enabled Reasoning. Scientific Visualization Advanced
Concepts, 1, pp.227–245.
Okoli, C. & Schabram, K., 2010. A Guide to Conducting a
Systematic Literature Review of Information Systems
Research. Working Papers on Information Systems,
10(26), pp.1–51.
Philip Chen, C.L. & Zhang, C.-Y., 2014. Data-intensive
applications, challenges, techniques and technologies:
A survey on Big Data. Information Sciences, 275,
pp.314–347.
Schoenherr, T. & Speier-Pero, C., 2015. Data Science,
Predictive Analytics, and Big Data in Supply Chain
Management: Current State and Future Potential.
Journal of Business Logistics, 36(1), pp.120–132.
Sedig, K. & Parsons, P., 2013. Interaction Design for
Complex Cognitive Activities with Visual
Representations: A Pattern-Based Approach. AIS
Transactions on Human-Computer Interaction, 2(5),
pp.84–133.
Segel, E. & Heer, J., 2010. Narrative visualization: Telling
stories with data. IEEE Transactions on Visualization
and Computer Graphics, 16(6), pp.1139–1148.
Shneiderman, B., 2002. Inventing discovery tools:
combining information visualization with data mining.
Information Visualization, 1(1), pp.5–12.
Spink, A. & Cole, C., 2006. Human Information Behavior:
Integrating Diverse Approaches and Information Use.
Journal of the American Society for Information
Science and Technology, 57(1), pp.25–35.
Tortosa-Edo, V. et al., 2013. The antecedent role of
personal environmental values in the relationships
among trust in companies, information processing and
risk perception. Journal of Risk Research, 17(8), pp.1–
17.
Webster, J. & Watson, R.T., 2002. Analyzing the Past to
Prepare for the Future: Writing a Literature Review.
MIS Quarterly, 26(2), pp.xiii – xxiii.
Zikopoulos, P. & Eaton, C., 2011. Understanding Big
Data: Analytics for Enterprise Class Hadoop and
Streaming Data.
Interactive Visualization and Big Data - A Management Perspective
47
