
Modelling and Simulation of the Temperature Control System in the
Heating Installations from Nonresidential Buildings
Daniel Popescu
1
and Ioan Borza
2
1
Department of Electrical Engineering in Civil Engineering and Building Services,
Technical University of Civil Engineering, Bd. Pache Protopopescu 66, Bucharest, Romania
2
Department of Civil Engineering and Building Services, Politehnica University,
Str. Traian Lalescu No. 2, Timisoara, Romania
Keywords: Temperature Control, Nonlinear Control Systems, Modelling, Simulation, Building Automation,
Civil Engineering.
Abstract: The article addresses specific issues of the automated heating systems for non-residential buildings, which
aim to ensure thermal comfort with low energy consumption. The specialized automatic system maintains
constant the indoor temperature when the heat input in building equals the heat loss through the building
envelope. The specialized automatic system consists of several subsystems. The model for each subsystem is
obtained considering the particularities of the heating processes from buildings and requirements for the
thermal comfort. By simulating the operation of the specialized automatic system is obtained the time
behavior for the main physical values that characterizes the system, relevant to the quality of the heating
temperature control in the building. The operation of the automatic controller and the control valve are
analyzed by simulation, in a comparable time interval with transient regime of the automatic heating system
of the real building. The validation of the model is done by comparing the results obtained by simulation with
results of experimental measurements in the real automatic system, implemented in the building chosen for
study.
1 ENSURING THE THERMAL
COMFORT IN
NONRESIDENTIAL BUILDINGS
The automation of heating systems in buildings can
be made differently from one building to another,
depending on the size of the building, the thermal
comfort imposed, the rooms destination in the
building, the number of persons in the building, the
heat source used, the building materials used, etc.
(Popescu and Ciufudean, 2012; Popescu, 2004;
Clements-Croome, 1996; Castilia et al., 2014;
Arguello and Velez, 2002; Balan, Stan and Lapusan,
2009; Balan et al., 2009; Chmielnicki, 2011; Liao and
Dexter, 2004; Ma et al., 2011; Kim and Ahn, 2013).
In an individual dwelling are easly to impose the
requirements for indoor thermal comfort: is chosen a
room "witness" (reference) for imposed thermal
comfort and, into the room, is placed the transducer
that measure the indoor temperature adjusted
(Popescu, 2014; Castilia et al., 2014). Choosing a
room as being the reference for indoor thermal
comfort is not recommended for non-residential
buildings because: the number of building occupants
is high and the thermal comfort exigencies differ from
one person to another, even if performing the same
task (Clements-Croome, 2011; Wagner and Schakib,
2011); also, heated spaces in the building may have
different destinations and a good labor productivity
impose adequate thermal comfort for the activity
carried (Oancea and Caluianu, 2012; Clements-
Croome and Li, 2000; Seppanen et al., 2006;
Clements-Croome, 2006; Wargocki, 2006).
Heating systems in non-residential buildings have a
heat source and contain multiple independent thermal-
hydraulic circuits, in which the water temperature is
adjusted to the corresponding values. The desired water
temperature in a heating circuit is established using the
selected heating curve for that circuit (Mira et al., 2010;
Ilina et al., 2010); flow temperature changes correlated
with outdoor temperature values.
Ensuring the thermal comfort in a zone of building
that is heated with an own heating circuit, depends on
the correct choice of heating curve for that zone. The
graph must lead to a heat input in building that is
454
Popescu, D. and Borza, I.
Modelling and Simulation of the Temperature Control System in the Heating Installations from Nonresidential Buildings.
In Proceedings of the 5th International Conference on Smart Cities and Green ICT Systems (SMARTGREENS 2016), pages 454-461
ISBN: 978-989-758-184-7
Copyright
c
2016 by SCITEPRESS – Science and Technology Publications, Lda. All rights reserved
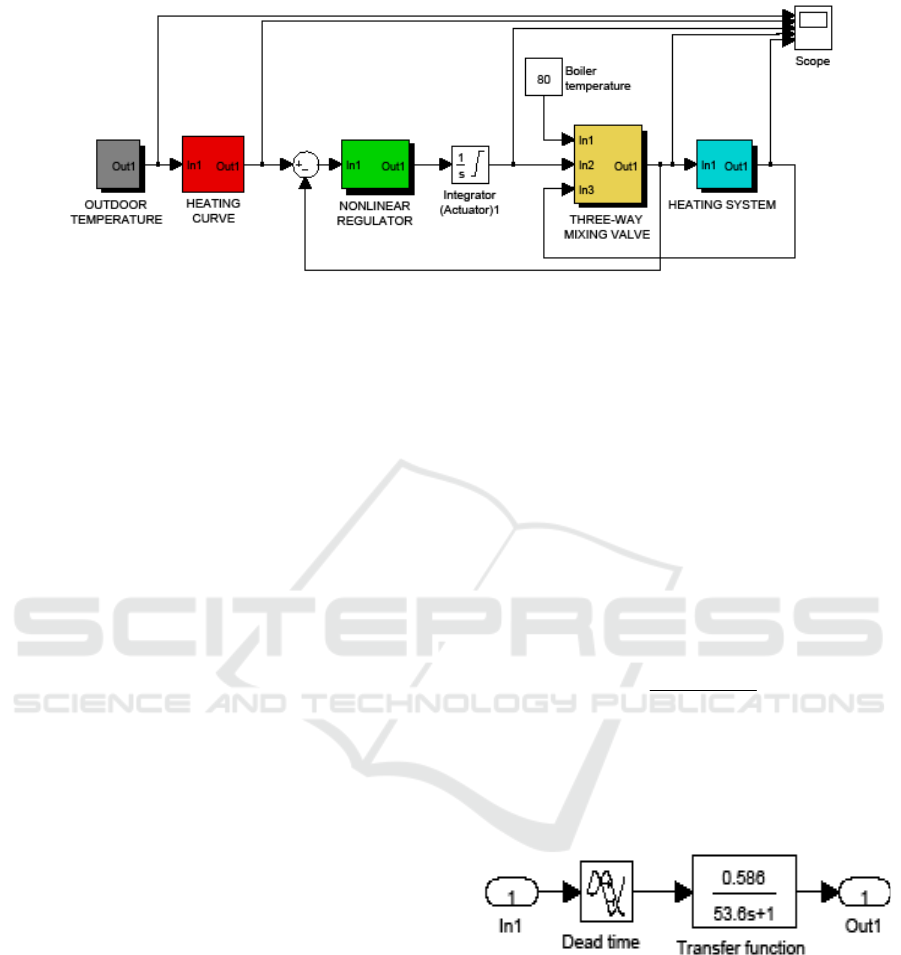
Figure 1: Model of the automatic system that adjusts the water temperature in a heating circuit.
able to compensate the heat loss through the building
envelope in the heated zone; indoor temperature in
the building is maintained constant.
Heating automation in a non-residential building
involves:
- an automated system that adjusts the temperature of the
heat source (boiler) to a constant value, usually 80
0
C;
- distinct automatic systems that independently adjust
the temperature of the water in each heating circuit.
2 MODELLING OF THE
AUTOMATIC SYSTEM FOR
ADJUSTING THE WATER
TEMPERATURE IN A HEATING
CIRCUIT
The model of the automatic system was developed in
Simulink from Matlab and is composed of several
subsystems, interconnected as shown in Figure 1.
Automatic adjustment of water temperature in the
heating circuit of the building is done using a
combined control loop, i.e. a control that supervises
the value of deviation (error), simultaneously with a
control that supervises the dominant disturbance.
Heating curve of the building establishes the required
flow temperature in the heating circuit; the flow
temperature increases (decreases) at the decrease
(increase) of the outdoor temperature, which
represents the dominant disturbance. Heat input in the
building is automatically adjusted and, therefore, the
indoor temperature is maintained constant.
3 MODEL OF THE HEATING
SYSTEM
The building chosen for modeling the automatic
system for temperature control of the thermal agent in
the heating installation, belongs to the Faculty of
Building Services Engineering from Bucharest. In
this building were conducted experimental research,
which had the purpose of ensuring the thermal
comfort by automatically controlling the quantity of
heat that is lost through building envelope (Popescu,
2008; Popescu and Ciufudean, 2008; Popescu,
Ciufudean and Ionescu, 2009; Popescu and
Ciufudean, 2012). One of the three independent
heating circuits with which it is equipped the building
was experimentally identified (Popescu, Ciufudean
and Ghiaus, 2009) and the transfer function of the
heating installation for this circuit is
1s6,53
e586,0
)s(H
s7,19
F
+
⋅
=
−
(1)
The dead time
7,19=
M
T
and the inertial time
constant
6,53=
F
T
are expressed in minutes.
The HEATING SYSTEM model, in Simulink, is
shown in Figure 2.
Figure 2: Model of the HEATING SYSTEM.
4 MODEL OF THE OUTDOOR
TEMPERATURE SUBSYSTEM
OUTDOOR TEMPERATURE subsystem generates
outdoor temperature values (dominant disturbance),
which changes similar to the outdoor temperature.
The subsystem is designed to provide a sinusoidal
signal with a period of 24 hours. Sinusoidal signal is
centered on an average outdoor temperature of -10
0
C
Modelling and Simulation of the Temperature Control System in the Heating Installations from Nonresidential Buildings
455
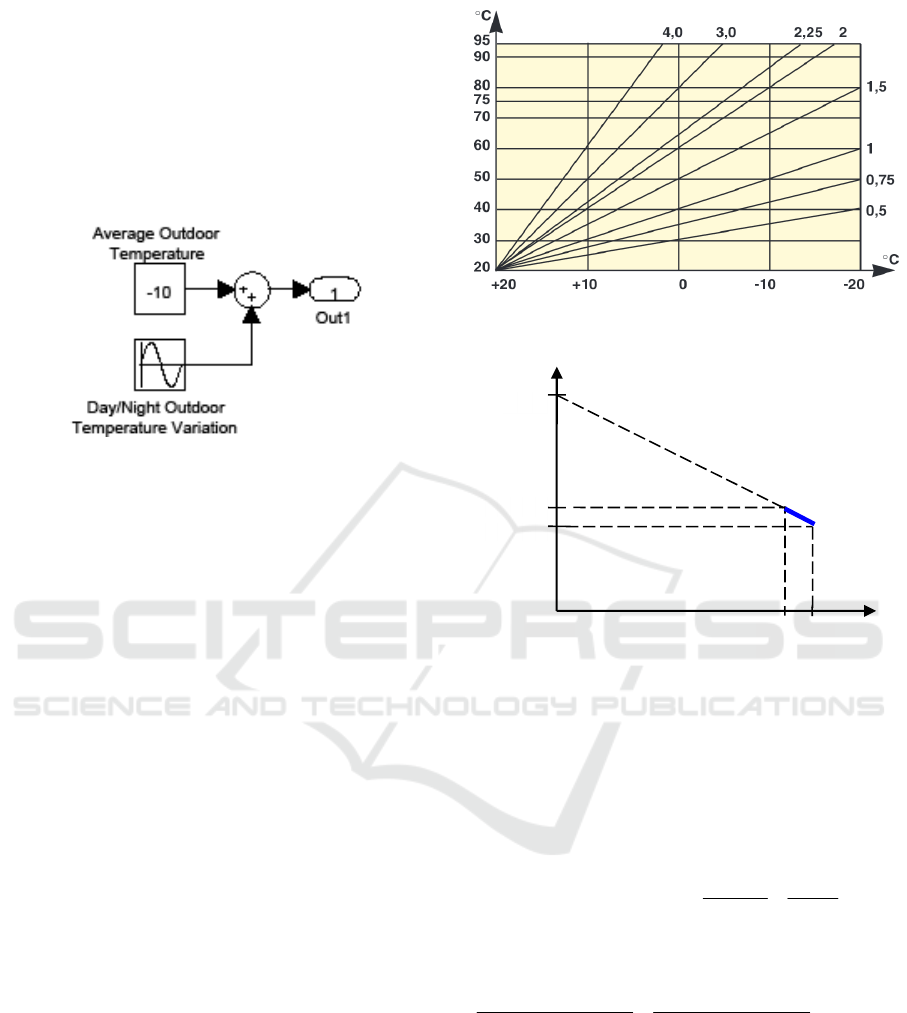
and the outdoor temperature extremes variations in 24
hours range between 0
0
C (day) and -20
0
C (night).
Values for the outdoor temperature have been chosen
particularly lower, similar to those actually recorded
in Romania at the beginning of the year 2015,
temperatures that pose particular problems in
maintaining thermal comfort in the building.
OUTDOOR TEMPERATURE model is shown in
Figure 3.
Figure 3: Model of the OUTDOOR TEMPERATURE.
5 MODEL OF THE HEATING
CURVE SUBSYSTEM
HEATING CURVE subsystem generates the flow
temperature setpoint in the heating circuit of the
building. Water temperature dependence on the
outdoor temperature is set by heating curve, which is
a line with a slope of 1.5. Slope value was chosen
adequate for the studied zone in the heated building.
Automation equipments used for heating
buildings allow choosing the slope of the heating
curve within the range 0.5 ... 4.0, as shown in Figure
4. Heating curves are taken from the technical
documentation of automation equipments and the
temperatures are given in Celsius degrees.
Temperatures in the HEATING CURVE
subsystem are expressed in Kelvin degrees.
The heating curve used in model was designed
based on the heating curve, in Celsius degrees, with a
slope of 1.5, from the set of heating curves shown in
the Figure 4. The ranges of temperatures are equal,
regardless of unit Kelvin or Celsius chosen for
temperatures, so we can write
)K(T)C(
0
Δ=θΔ
(2)
Therefore, the variation of flow temperature in the
heating installation is
0000
( ) 80 20 60
ft
CCCC
θ
Δ=−=
(
() 60
ft
TK KΔ=
)
and the outdoor temperature variation
is
0000
( ) 20 20 40
ot
CCCC
θ
Δ=−−=−
(
() 40
ot
TK KΔ=−
)
.
Figure 4: Heating curves for a three-way mixing valve.
Figure 5: Heating curve used in the model.
The heating curve used in the model is the straight
segment noted AC (figure 5), which has the general
equation
nx
m
y +⋅=
(3)
With the values written on the graph axes is
calculated the slope
5,1
40
60
)(
)(
−=
−
=
Δ
Δ
=
K
K
KT
KT
m
ot
ft
.
Using the resemblance of triangles ABC and ADE,
we can write
353,15 293,15 293,15 253,15
293,15 293,15 0
KK KK
nK KK
−−
=
−−
, from
where shall be determined the value
Kn 87,732=
.
Heating curve has the equation
[ ] 1, 5 [ ] 732,87
ft ot
TK TK K=− ⋅ +
(4)
Equation (4) represents the basis for HEATING
CURVE subsystem from Figure 6.
D
A
T
ft
(K)
E
C
B
0
T
ot
(K)
n
353,15
293
,
15
293,15
253,15
MoMa-GreenSys 2016 - Special Session on Modelling Practical Paradigms of Green Manufacturing Systems
456
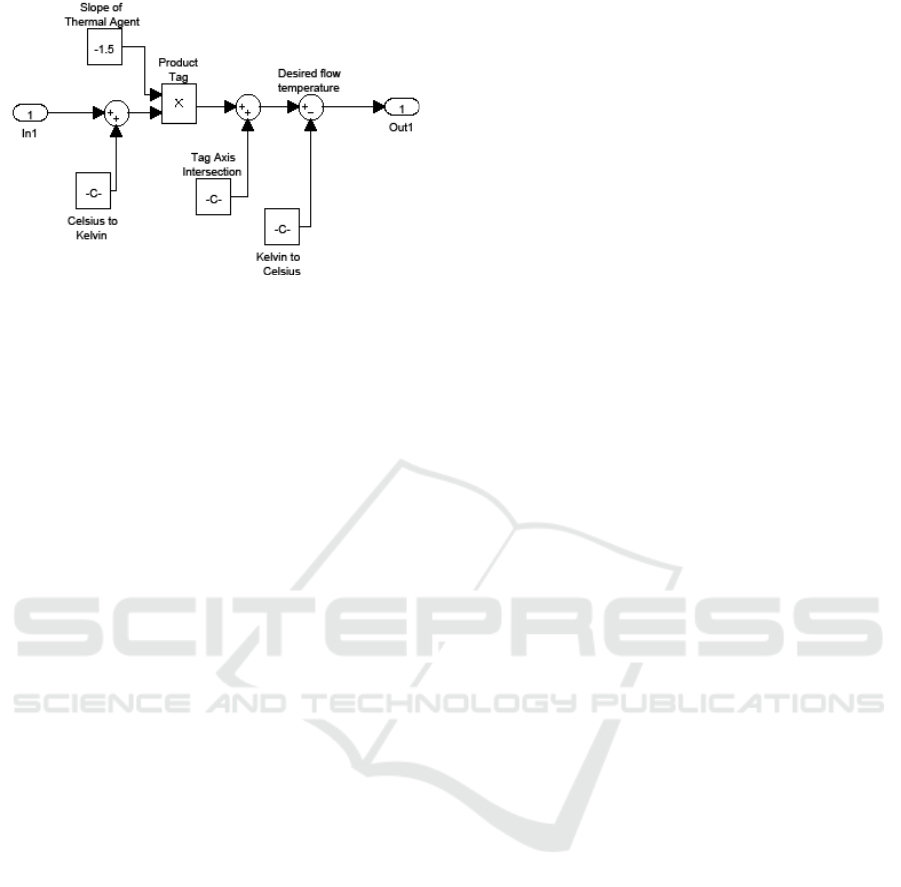
Figure 6: Model of the HEATING CURVE.
Choosing a heating curve with slope value greater
than 1.5 will lead to overheating of the building; a
value of the slope less than 1.5 will lead to insufficient
heating of the building.
If the outdoor temperature reaches extreme
values, -20...-30
0
C, the set temperature at the boiler
must be fixed at values higher than 80
0
C, in order to
not negatively affect the indoor temperature in the
building. Practical experience in the heating of
buildings has shown that a set temperature at the
boiler higher than 80
0
C is rarely needed and for small
time intervals. The boiler automation equipment
allows to establish the working temperature at
maximum 95
0
C.
6 MODEL OF THE NONLINEAR
REGULATOR SUBSYSTEM
NONLINEAR REGULATOR subsystem is a three-
point regulator to which the switching thresholds and
the dead zone were established in the static
characteristic of the regulator. The model of the
regulator was realised by authors and this regulator
ensures a good precision in operation.
This type of nonlinear regulators can be
successfully used for the automation of the heating
installations, due to the high thermal inertia for
buildings (Arguello and Velez, 2002).
7 MODEL OF THE THREE-WAY
MIXING VALVE SUBSYSTEM
The boiler has its own automatic control loop that
maintains the temperature of boiler at the constant
value 80
0
C
The three-way mixing valve send the thermal
agent in the heating installation at a temperature
obtained by mixing the thermal agent taken over from
the boiler with the thermal agent taken over from the
return of the heating installation. The angular position
of the three-way mixing valve is variable between -
45
0
and +45
0
. The temperature of the thermal agent at
the output of the control valve is comprised between
the temperature in the heating installation return
(minimum value for the angular position -45
0
) and the
boiler temperature (maximum value for the angular
position +45
0
). Temperature regulated with mixing
valve depends linearly on the angular position of the
valve; for angular position 0 degrees, the valve takes
over thermal agent in equal proportions from the
boiler and from the heating installation return.
Model of three-way control valve was realised by
authors in Simulink.
8 SIMULATION OF THE
AUTOMATIC CONTROL
SYSTEM
The simulation was performed during 50 hours
(180,000 seconds), which is relevant for thermal
comfort in the building studied. The results obtained
by simulation are shown graphically in Figure 7.
The first graph is for the outdoor temperature. The
evolutions in time for the next graphs must be
analyzed in correlation with the graph for the outdoor
temperature.
Flow temperature values imposed for the heating
installation (ranging between 50
0
C and 80
0
C) are in
accordance with the values of the outside temperature
(ranging between 0
0
C şi -20
0
C) and with the heating
curve with slope 1,5.
The values of angular position for three-way
control valve indicate a greater amount for thermal
agent taken from the boiler, compared to the amount
of thermal agent taken from the heating return. For
the angular position of 40
0
, the flow temperature
reaches 77 ... 78
0
C; for the angular position of 45
0
, the
flow temperature should reach a maximum value of
80
0
C. The error comes from the nonlinear regulator.
The temperature in the heating installation return
varies due to the changes of the flow temperature and
through the exchange of heat between the installation
and building. The difference between flow
temperature and return temperature of the heating
installation is maintained approximately in the range
20 ... 30
0
C, which indicates that the installation heats
efficiently the building (Ilina et al., 2010).
Modelling and Simulation of the Temperature Control System in the Heating Installations from Nonresidential Buildings
457
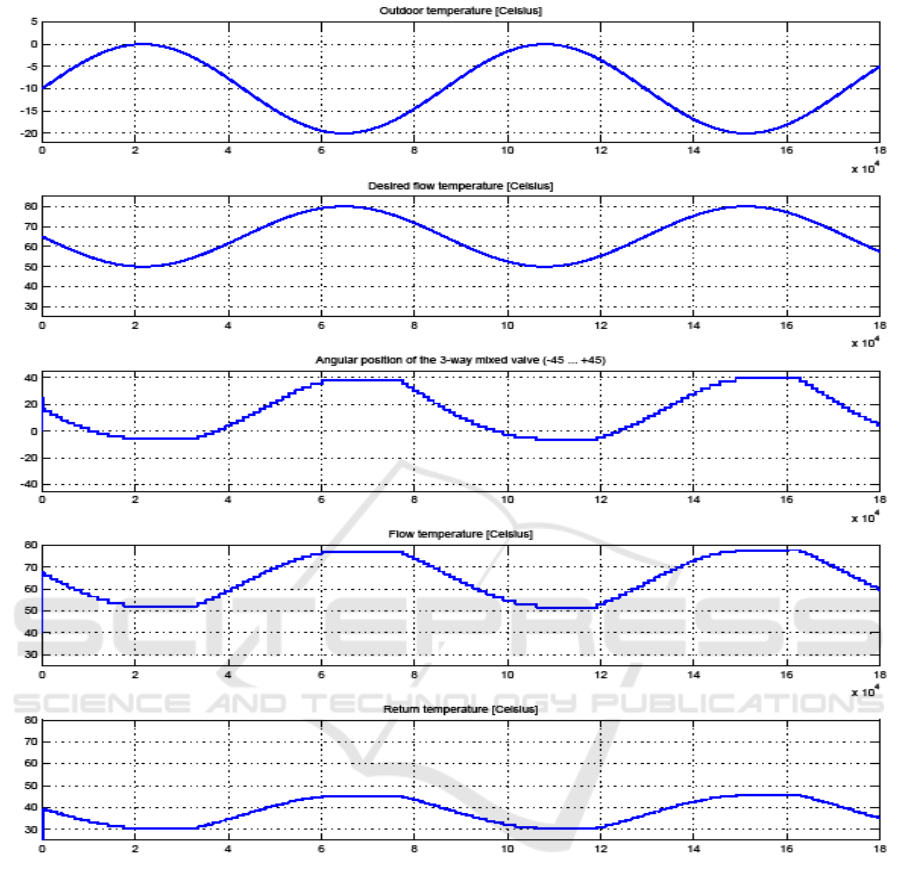
Figure 7: Results obtained by simulation of the automatic control system.
Correct operation of the automatic regulator and
the control valve can be evaluated using the graphs
from Figure 8, during the transitional regime.
The 300 seconds simulation time is relevant to
analyze the transitory regime of the automatic heating
system used in non-residential buildings.
The error adjusting decreases to the value 2,5K,
which is very good if we take into account that relates
to temperature in heating installation and not to the
indoor temperature of the building.
The regulator commands, for adjusting the
angular position of the control valve during the
transitory regime, are generated at time intervals from
10 to 100 seconds. These values are large enough to
find that the actuator of the control valve is not
overloaded by repeated orders during transitory
regimes. Furthermore, in the operation of the heating
installation of a building, transitory regimes follow
each other at intervals of tens of minutes or even
larger, usually when the outdoor temperature
changes.
9 VALIDATION OF THE MODEL
FOR AUTOMATIC CONTROL
SYSTEM
Faculty of Building Services Engineering from
Bucharest is the non-residential building equipped
MoMa-GreenSys 2016 - Special Session on Modelling Practical Paradigms of Green Manufacturing Systems
458
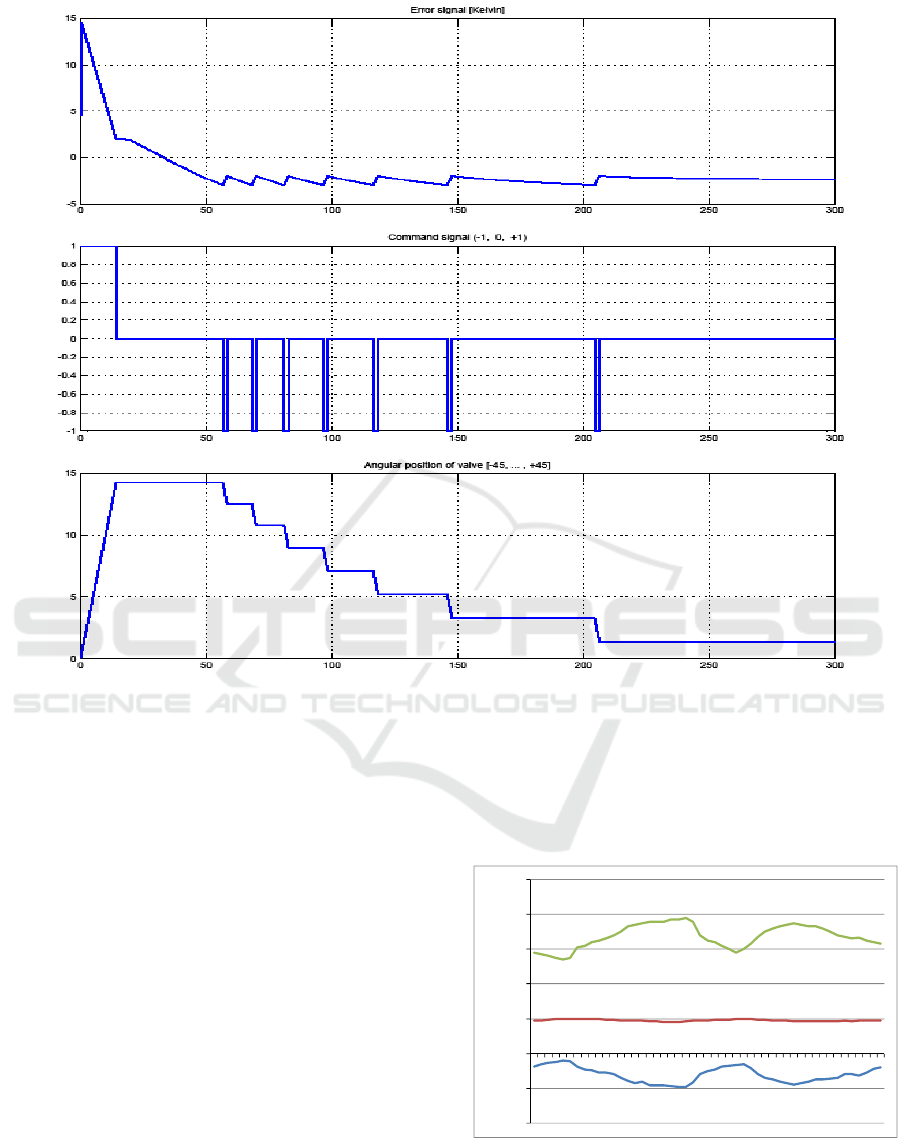
Figure 8: Results obtained by simulation automatic control system in transitional regime.
with automatic heating system which formed the
basics for the model presented this article. It was
monitored the operation of the automatic heating
system of the building during two days, in the first
part of January from 2015, when outdoor
temperatures were extremely lower. Were measured
and were recorded hourly the values for outdoor
temperature, indoor temperature in the building and
flow temperature in the heating installation. The
graphs for the three temperatures are plotted in the
Figure 9.
Outdoor temperature variation experimentally
measured is approximately sinusoidal; the deviation
from sinusoidal form in the model is due to the
particular weather conditions existing in Bucharest in
period chosen for experimental measurements.
Experimentally measured flow temperature on the
heating installation has evolved over time by
following outdoor temperature values, according to
the heating curve with slope 1.5, selected in the
control cabinet of the boiler.
The experimental measurements have also
included indoor temperature in an office of the
building. Indoor temperature variations were between
18,1
0
C and the 19,9
0
C; these values are acceptable for
activities in an office of the building in cold winter
days.
Figure 9: Graphs for experimentally measured
temperatures.
The comparative analysis of values and graphs for
-40.00
-20.00
0.00
20.00
40.00
60.00
80.00
100.00
1 3 5 7 9 11 13 15 17 19 21 23 25 27 29 31 33 35 37 39 41 43 45 47 49
Outdoor temperature
Indoor temperature
Flow temperature
[hours]
[Celsius]
Modelling and Simulation of the Temperature Control System in the Heating Installations from Nonresidential Buildings
459

significant temperatures, obtained by simulation and
experimental measurements in the building, show that
the model of automatic system was done correctly
and accurately.
10 CONCLUSIONS
The finite duration of the transitory regime show the
stability of the automatic system modeled and a large
reserve of stability.
The accuracies for temperature control of the
thermal agent have close values in the case of the
simulation and the case of the operating for real
system in building.
The nonlinear regulator and the three-way mixing
valve are suited for the purpose.
There are no overloads for the three-way mixing
valve caused by the transitory regimes of the
automatic system.
The change of the angular position during
operation at the three-way mixing valve takes place
within the domain of variation thereof, from -45
0
to
+45
0
. Consequently, are not producing saturations of
the regulator commands which would reduce the
adjusting performances.
Slope value for heating curve must be adapted to
the particularities from the building heated zone.
The model for the automatic system can be used
as an auxiliary tool in design of automatic heating
systems for non-residential buildings; it is necessary
to know prior the mathematical model of the heating
process.
The model of the automatic heating system is
validated by comparing the significant temperatures
obtained by simulation and experimental
measurements in the studied building.
The article presents how the temperature of the
thermal agent is controlled in the heating installation
from a non-residential building. Thermal comfort
depends on the indoor temperature of the building,
which in turn depends on the temperature of the
thermal agent in the heating system. Adding a
subsystem called the heated space to the automatic
system model, provides a better solution to ensure the
thermal comfort inside the building.
REFERENCES
Arguello-Serrano, B., Velez-Reyes, M., 2002. Nonlinear
control of a heating, ventilating, and air conditioning
system with thermal load estimation”. Control Systems
Technology, IEEE Transactions 7(1).
Balan, R., Stan, S.D., Lapusan, C., 2009. A Model Based
Predictive Control Algorithm for Building Temperature
Control. IEEE International Conference on Digital
Ecosystems and Technologies: 541-546.
Balan, R., Hancu, O., Stan, S., Lapusan, C., Donca, R.,
2009. Application of a Model Based Predictive Control
Algorithm for Building Temperature Control. Book
Series: Energy and Environmental Engineering Series:
97-101.
Castilia, M.M., Alvarez, J.D., Rodriguez, F., 2004.
Berenguel, M., Comfort Control in Buildings. Springer,
ISBN 978-1-4471-6347-3 (e-book).
Castilia, M.M., Alvarez, J.D., Rodriguez, F., Berenguel,
M., 2014. Comfort Control in Buildings. Springer,
ISBN 978-1-4471-6347-3 (e-book).
Chmielnicki, W.J., 2011. Impact of the indoor temperature
control algorithm in the building on the consumption of
the heat. Rynek Energii 6: 66-73.
Clements-Croome, D.J., 1996. Freshness, ventilation and
temperature in offices. BSERT, 17 (11), 21-27.
Clements-Croome, D.J., 2011. The interaction between the
physical environment and people. In: S.A. Abdul-
Wahab, ed. Sick building syndrome in public buildings
and workplaces. Berlin Heidelberg: Springer-Verlag,
239-261.
Clements-Croome, D.J., Li, B., 2000. Productivity and
Indoor Environment, BSERT, 1, pp. 629-634.
Clements-Croome, D.J., Editor, 2006. Creating the
productive workplace. Second Edition, 468 pages,
ISBN 13: 978-0-415-35138-6, Taylor & Francis,
London and New York.
Ilina, M. (coordinator), 2010. Technical Encyclopedia of
Installations, vol. I, ISBN 978-973-85936-5-7,
Publishing House Artecno Bucharest.
Kim, B.-Y., Ahn, H.-S., 2013. Coordination and control for
building automation systems, International Conference
on Control, Automation and Systems, Pages 614-616.
Liao, Z., Dexter, A.L., 2004. A simplified physical model
for estimating the average air temperature in multi-zone
heating systems. Building and Environment, 39(9):
1013-1022.
Ma, Y.D., Anderson, G., Borrelli, F., 2011. A Distributed
Predictive Control Approach to Building Temperature
Regulation. Proceedings of the American Control
Conference.
Mira, N. (coordinator), 2010. Technical Encyclopedia of
Installations, vol. E, ISBN 978-973-85936-5-7,
Publishing House Artecno Bucharest.
Oancea, C., Caluianu, S., 2012. Analysis of non-residential
buildings in Romania from the labour productivity and
intelligent buildings concept point of view. Intelligent
Buildings International, Volume 4, Issue 4, pages 216-
227, Publisher Taylor & Francis Ltd., ISSN 1750-8975.
Popescu D., 2004. Régulation d’un système de chauffage
des bâtiments. Proceedings of the 7th International
Conference on Development and Application Systems.
pp. 6-9, ISBN 973-666-106-7.
Popescu, D., 2014. Specific problems on the operation of
the automatic control system of temperature into an
MoMa-GreenSys 2016 - Special Session on Modelling Practical Paradigms of Green Manufacturing Systems
460

individual dwelling. WSEAS Transactions on Systems,
Volume 13, 2014, pp. 482-491. E-ISSN: 2224-2678.
Popescu, D., 2008. A New Solution for Automatic Control
of Heating Systems in Buildings Based on Measuring
Heat Transfer Through Outer Surfaces. Proceedings of
the 10th WSEAS International Conference on
Automatic Control, Modeling and Simulation, pp. 206-
209, ISSN 1790-5117.
Popescu, D., Ciufudean, C., 2012. Indoor thermal comfort
by controlling heat transfer through building envelope
The 13th International Conference on Automation &
Information, pp. 150-155, ISBN 978-1-61804-099-2.
Popescu, D., Ciufudean, C., 2008. Automatic Control
System for Heating Systems in Buildings Based on
Measuring the Heat Exchange through Outer Surfaces.
Proceedings of the 8th WSEAS International
Conference on Simulation, Modelling and
Optimization, pp. 117-121, ISSN 1790-2769.
Popescu, D., Ciufudean, C., 2012. Indoor thermal comfort
by controlling heat transfer through building envelope.
The 13th International Conference on Automation &
Information, pp. 150-155, ISBN 978-1-61804-099-2.
Popescu, D., Ciufudean, C., Ionescu, D., 2009.
Experimental Analysis of the Automated System for
Heating Control based on Heat Losses through
Building’s Envelope. 9th WSEAS International
Conference on Simulation, Modelling and
Optimization. pp. 160 – 166, ISSN 1790-2769.
Popescu, D., Ciufudean, C., Ghiauş, A., 2009. Specific
Aspects of Design of the Automated System for
Heating Control that Accounts for Heat Losses Through
the Building’s Envelope. Proceedings of the 13th
WSEAS International Conference on Systems. pp. 352
– 356, ISSN 1790-2768.
Seppanen, O., Fisk, W.J., and Lei, Q.H., 2006. Room
temperature and productivity in office work. Berkeley:
Lawrence Berkeley National Laboratory. Available
http://escholarship.org/uc/item/9bw3n707.
Wagner A. and Schakib-Ekbatan K., 2011. User
satisfaction as a measure of workplace quality. Detail
Work Environments, Edited by Christian Schittlich, 54-
57.
Wargocki, P., Seppanen, O., Andersson, J., Boerstra, A.,
Clements-Croome, D., Fitzner, K., Hanssen, S.O.,
2006. Indoor Climate and Productivity in Offices.
REHVA Guidebook no 6. ISBN 2-9600468-5-4.
Modelling and Simulation of the Temperature Control System in the Heating Installations from Nonresidential Buildings
461
