
A Case Study of Team Learning Measurements
from Groupware Utilization
A Proposal of Measurement Method for the Contribution Ratio of Knowledge
Ayako Masuda
1
, Chikako Morimoto
2
, Tohru Matsuodani
3
and Kazuhiko Tsuda
4
1
FeliCa Networks, Inc., 1-11-1 Osaki, Shinagawa-ku, Tokyo, Japan
2
Tokyo Institute of Technology, 2-12-1 Oookayama, Meguro-ku, Tokyo, Japan
3
Debug Engineering Research Laboratory, 4-16-1 Hijirigaoka, Tama-shi, Tokyo, Japan
4
University of Tsukuba, Tokyo Campus, 3-29-1 Ootsuka, Bunkyo-ku, Tokyo, Japan
Keywords: Contribution Ratio, Team Learning, Groupware, Gini Coefficient, Software Development.
Abstract: In software development, there is a need to share a variety of knowledge; therefore, team learning
(organizational learning) is required. As tools to support team learning, various groupware has been utilized.
In groupware utilization, there is variation among development sites, which is suggested to reflect the maturity
of team learning. Therefore, a case analysis on a team with a higher maturity of team learning was performed
using groupware utilization as a measure of knowledge sharing. The Gini coefficient is used to represent the
distribution of assets in economics. An inversion of the Gini coefficient was used to represent the groupware
utilization and defined as the contribution ratio of knowledge. When the contribution ratio of knowledge is
large, knowledge sharing is considered to be progressing. The contribution ratio of knowledge in this case
study was observed to improve in proportion to the duration of the team. In future, we will expand the
measurement range and continue to verify the measurement of team learning maturity using the contribution
ratio of knowledge. This study measures the state of the team by analyzing their responses to the questionnaire.
If this verification is successful, we would be able to measure the progress of team learning using the
contribution ratio of knowledge, which can be measured more easily and objectively without resorting to the
questionnaire.
1 INTRODUCTION
Most resources involved in software development are
human resources; therefore, effective human resource
management is critical to this industry. As software
development becomes more complicated, the
development of human resources with advanced
knowledge of software technology and advanced
information and communication technology (ICT)
skills is required (MIT, 2009). In the development of
human resources for advanced ICT, technical as well
as comprehensive skills, for example, communication
skills, problem finding, and solving skills, are
particularly important (Takasaki et al., 2014). Within
an actual software development site, it is difficult to
devote resources for advanced training. Therefore,
the development of human resources through real
work, or on-the-job training (OJT), is required.
Organization, or team learning, was promoted by
Peter Senge (Senge, 2006) and subsequently adopted
by the software development industry, where the pace
of technological change is rapid. In addition to basic
knowledge such as domain-specific specifications,
software development requires learning and sharing
of expertise, for example, operating system (OS) and
the use of the interface of a communication system.
For team learning, communication and other various
tools that comprise groupware are used. An example
of a communication tool is mailing list (ML), and
examples of groupware include Wiki and Moodle for
groups.
The purpose of our study is to develop a method
for measuring software development team growth
and contribute to its efficiency. In this paper, the
utilization of groupware as a tool for team learning
and growth was assumed as an indicator of
knowledge sharing, and its measurement was
Masuda, A., Morimoto, C., Matsuodani, T. and Tsuda, K.
A Case Study of Team Learning Measurements from Groupware Utilization - A Proposal of Measurement Method for the Contribution Ratio of Knowledge.
In Proceedings of the 8th International Conference on Computer Supported Education (CSEDU 2016) - Volume 2, pages 193-198
ISBN: 978-989-758-179-3
Copyright
c
2016 by SCITEPRESS – Science and Technology Publications, Lda. All rights reserved
193
attempted. A software development team was
selected for the case study. The quality of their
products was highly evaluated, and members of this
team were also actively involved in team activities.
Therefore, some analytical results of team
performance have been reported (Masuda et al.,
2015a; 2015b). It is assumed that groupware
utilization is at a high level and that this indicates a
high level of team maturity.
Kitayama analyzed cases using the Lorenz curve
and the Gini coefficient to measure the utilization of
ML (Kitayama, 2009). In our study, the inversion of
the Gini coefficient, which indicates the contribution
to shared knowledge, was defined as the contribution
ratio of knowledge (CRK). It is considered that when
CRK is high, many members are providing
knowledge.
In Chapter 2, based on previous studies of using
the Gini coefficient for measuring ML utilization, the
application to the measurement of groupware
utilization is considered. In Chapter 3, the time-series
change of CRK in this case is described. Chapter 4
presents the results of an analysis comparing the
characteristics of the case team and other groups. In
Chapter 5, the correlations between groupware
utilization and CRK are discussed.
2 RELATIONSHIP WITH
PREVIOUS STUDIES
It is considered that groupware utilization can be
ascertained by the amount of information and the
usage situation. The amount of information can be
easily measured by the traffic per period. The usage
situations are the ways in which members participate
in groupware. There are various ways to measure
usage situations. The Gini coefficient, as employed
by Kitayama, focused on the distribution of senders
in ML. This previous study showed a characteristic
that can represent utilization with a single factor.
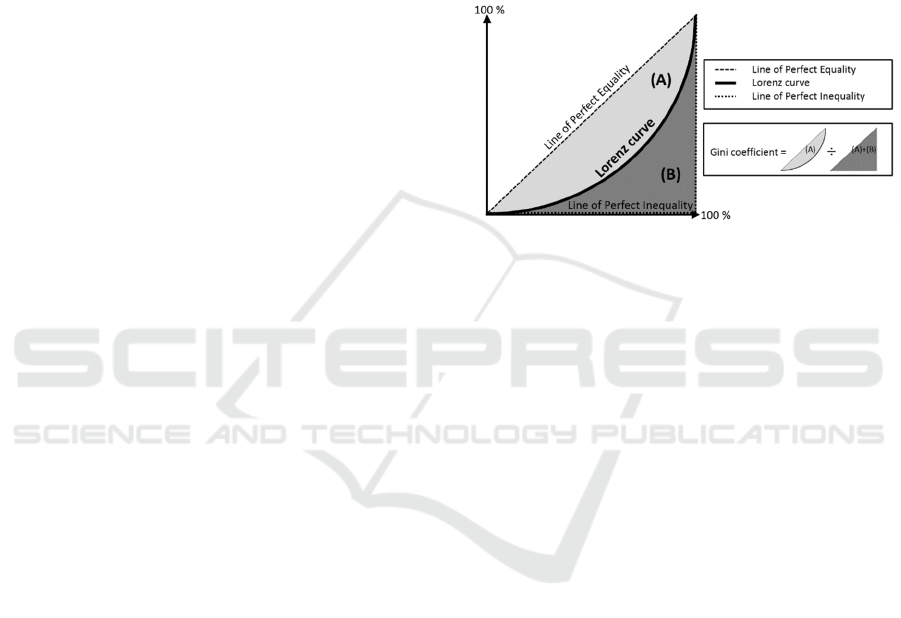
2.1 Lorenz Curve and Gini Coefficient
The Lorenz curve and Gini coefficient are common
indexes used to analyze the distribution of household
income (Gastwirth, 1972; Nakamura, 2005).
The Lorenz curve describes income distribution
among households in order of income, with the
cumulative of households on the horizontal axis and
cumulative income on the vertical axis. When there is
no income gap and all the income is the same, the
Lorenz curve is a 45-degree line (Line of Perfect
Equality). When there is a bias in the distribution of
income and wealth, the Lorenz curve bulges
downward (Line of Perfect Inequality).
The Gini coefficient is a representation of the
downward bulge of the Lorenz curve and is expressed
by the ratio of the area (A) and the areas (A) + (B) in
Figure 1. The value of the Gini coefficient is between
0 and 1. Therefore, it can be said that when the value
of the Gini coefficient is closer to 0, the income gap
is small. In contrast, when the value of the Gini
coefficient is closer to 1, the income gap is large.
Figure 1: Lorenz curve and Gini coefficient.
2.2 Previous Research
Kitayama measured bias in the number of member
transmissions in 29 MLs using the Gini coefficient
and Lorenz curve. The Lorenz curve of each ML is
lined up with the members in order of the number of
transmissions, taking the cumulative number of
people on the horizontal axis and cumulative number
of ML transmissions on the vertical axis. The average
Gini coefficient for 29 MLs was 0.69. As a result, the
characteristics and utilization of each ML were
captured by the Gini coefficient. The correlation
coefficient of the ML scale (ML registration number)
and the Gini coefficient value was 0.308. Although
this value was a weak correlation, it indicates a
tendency for the Gini coefficient value to increase
when the number of people increases (Kitayama,
2009).
Kitayama’s studies demonstrate that it is possible
to compare the utilization of communication tools
using the Lorenz curve and to represent utilization
differences as a single factor using the Gini
coefficient.
2.3 Application to Groupware
Our research focuses on the learning maturity of the
team. It was considered that team learning maturity is
advanced when the provision of knowledge
frequently occurs among team members. In contrast,
CSEDU 2016 - 8th International Conference on Computer Supported Education
194
it was considered that when team learning is
immature, members provide only information related
to their own role. Thus, team learning maturity is
measured by groupware utilization among the team.
Groupware for team learning includes Wiki and
Moodle, which in order to the sharing of professional
knowledge. In this paper, the target groupware is
distinguished from general groupware and called
“groupware for team learning” (GWTL). The
difference between GWTL and general groupware
and ML is in its content. The burden of the contributor
is larger when posting to GWTL in terms of quantity
and quality than when posting to general groupware
because the contributor is engaged with sharing their
knowledge or contemplating current issues.
Therefore, the number of posts is lesser than that with
general groupware. For example, the Gini coefficient
for e-learning with respect to teachers and students is
close to 1. It is considered that as team learning
matures, information exchange among members will
increase and the Gini coefficient becomes smaller.
When the appropriate GWTL is selected and the
Gini coefficient for the contributors is obtained, team
learning maturity can be measured. Originally, the
Gini coefficient represented “INCOME”; however, in
this paper, the coefficient represents the
“OUTCOME” of knowledge. These represent
different characteristics; thus, CRK is defined as the
Gini coefficient to avoid confusion:
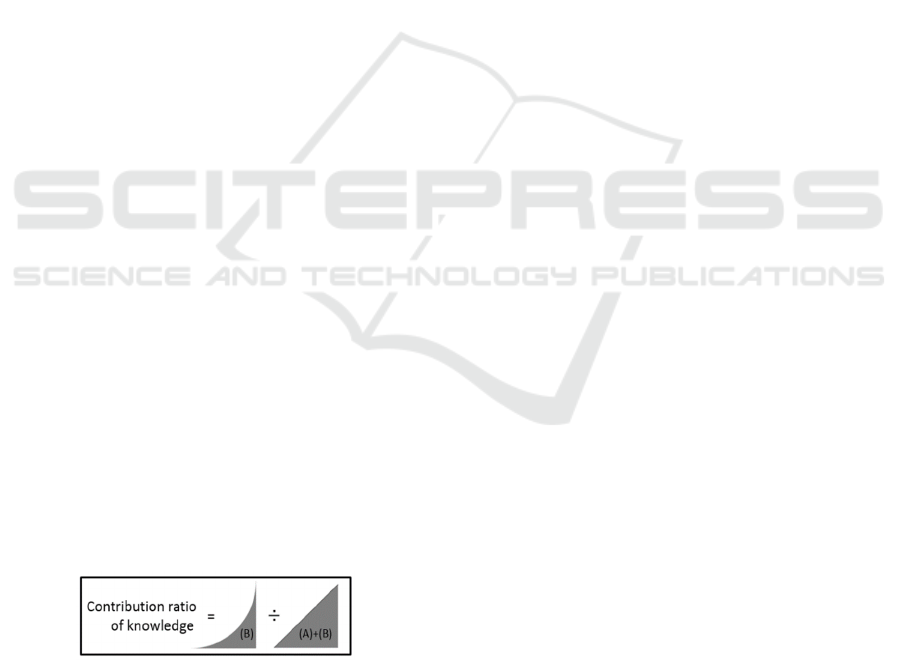
The contribution
ratio of knowledge
=1 − the Gini coefficient
For a group or organization, knowledge provided
by members is regarded as the “income” of the
Lorenz curve. Moreover, the inversion of the Gini
coefficient in this Lorenz curve is defined as CRK
(Figure 2). CRK is expressed by the ratio of the area
(B) and the areas (A) + (B) in Figure 1. Therefore,
when the value of CRK is closer to 0, the difference
in the amount of knowledge provided by members is
large. In contrast, when the value of CRK is closer to
1, the difference in the amount of knowledge
provided by members is small.
Figure 2: Contribution ratio of knowledge (CRK).
In the case of using groupware (GWTL) that
satisfies the conditions as a tool for team learning, it
is considered that the provision of knowledge from
members increases as team learning matures. The aim
of this paper is to indicate this situation as CRK. The
groupware used by the team under study in Chapter 3
satisfies the conditions of GWTL. The details are
described in the next chapter.
3 MEASUREMENT OF GWTL
UTILIZATION
A software development team (Team X) actively
engaged in team learning was chosen as the
measurement target. Team X is one of the few teams
to adopt Formal Methods to development in Japan.
The groupware conditions required of GWTL were
that it should be operated by members on a voluntary
basis and exclusively for technical content. The
measurements of GWTL utilization were the number
of posts and number of contributors. Measurements
were performed in two time periods to test whether
team growth was affecting GWTL utilization. The
measurement results and considerations are described
in this chapter.
3.1 Case Overview
Team X is developing a chip-embedded software for
which high security is required. Over several
generations of development spanning 10 years, their
products have encountered no serious problems in the
market and have a high reputation. The number of
members during the development period has been
varied between approximately 60 from
approximately 20 people. In addition, since the start
of the project, team building activities have been
incorporated aggressively (Masuda, 2014a; 2014b).
3.2 Time-series Changes
The numbers of posts and contributors were measured
using data from the team’s two GWTL platforms:
GWTL2012:
This platform was used from its start in 2012,
mainly to share information on the impact of
specification changes. It was operated using
Wiki (Wikipedia, 2015).
GWTL2014:
This platform was used from 2014 to expand
into information sharing for testing and
maintenance. It was operated using Moodle,
with an excellent user interface (Moodle, 2015).
The measurement results were analyzed using the
statistical package R and are described below.
A Case Study of Team Learning Measurements from Groupware Utilization - A Proposal of Measurement Method for the Contribution
Ratio of Knowledge
195
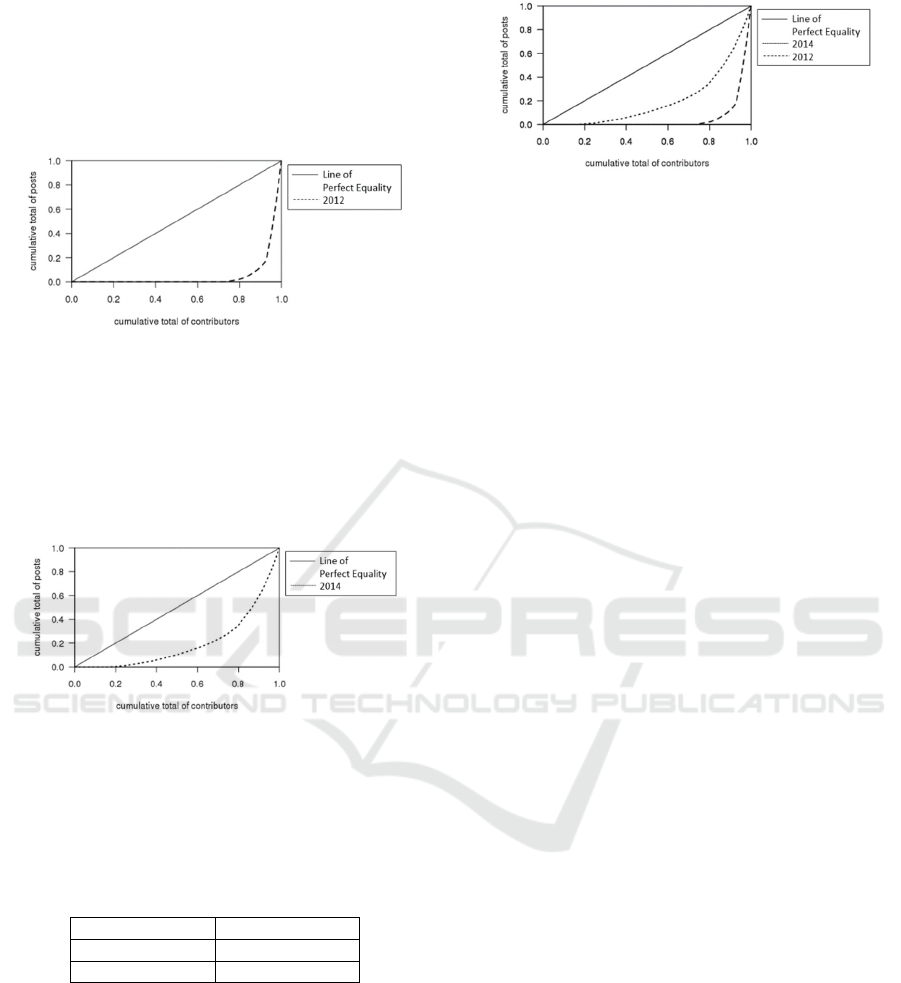
3.2.1 Lorenz Curve of GWTL2012
Figure 3 illustrates the Lorenz curve of utilization in
GWTL2012.
In 2012, contributors represented approximately
25% of the total.
Figure 3: Lorenz curve of GWTL2012.
3.2.2 Lorenz Curve of GWTL2014
Figure 4 illustrates the Lorenz curve of utilization in
GWTL2014.
In 2014, the number of contributors had risen to
approximately 80% of the total.
Figure 4: Lorenz curve of GWTL2014.
3.2.3 Comparison of CRK
Table 1 displays CRK in the cases of Sections 3.2.1
and 3.2.2.
Table 1: Comparison of contribution ratio of knowledge.
Case CRK
GWTL2012 0.10
GWTL2014 0.40
As shown, the value of CRK grew from 0.10 in
GWTL2012 to 0.40 two years later (GWTL2014).
3.3 Consideration of the Time-series
Change
Figure 5 compares the Lorenz curves of utilization for
GWTL2012 and GWTL2014.
Figure 5: Lorenz curves of GWTL2012 and GWTL2014.
Differences in CRK shown in Table 1 verify that
team learning had progressed, as represented by
increased CRK.
Other studies that measure CRK of groupware
utilization have not been found. The average value of
the Gini coefficient of MLs in the previous study was
0.69 (Kitayama, 2009). When this value is converted
to CRK, the value comes to 0.31. The CRK value of
knowledge of GWTL2014 in this case was 0.40,
which is greater than 0.31. This result indicates that
knowledge sharing has advanced in Team X.
It was thought that in the course of promoting
collaborative software development, members
became actively involved in team learning; this has
led to an increase the number of posts and
contributors. If this hypothesis were correct, it is
considered that the team performance of Team X
should have become higher than that of the other
teams.
To perform a preliminary verification, it was
decided to measure the team performance of Team X
and compare it with that of the other teams.
4 COMPARATIVE EVALUATION
OF TEAM PERFORMANCE
It has been determined that Team X is in the mature
stage of team learning. Team performance was then
evaluated and compared with that of the other teams.
These evaluations were performed using a previously
validated survey instrument (questionnaire)
(Matsuodani, 2014; Masuda et al., 2015a; 2015b).
The evaluation results are described below.
4.1 Evaluation Overview
Team performance is evaluated on the basis of a
plurality of factors that represent “performance”.
These factors were determined by statistical analysis
of the questionnaire responses.
The purpose of the evaluation is to demonstrate
clear differences between Team X and other ordinary
CSEDU 2016 - 8th International Conference on Computer Supported Education
196
software development teams using discriminant
analysis.
4.2 Discriminant Analysis by
Questionnaire Items
Twenty-two items from the 24-item questionnaire
were used for discriminant analysis. The analytical
result is presented in Table 2.
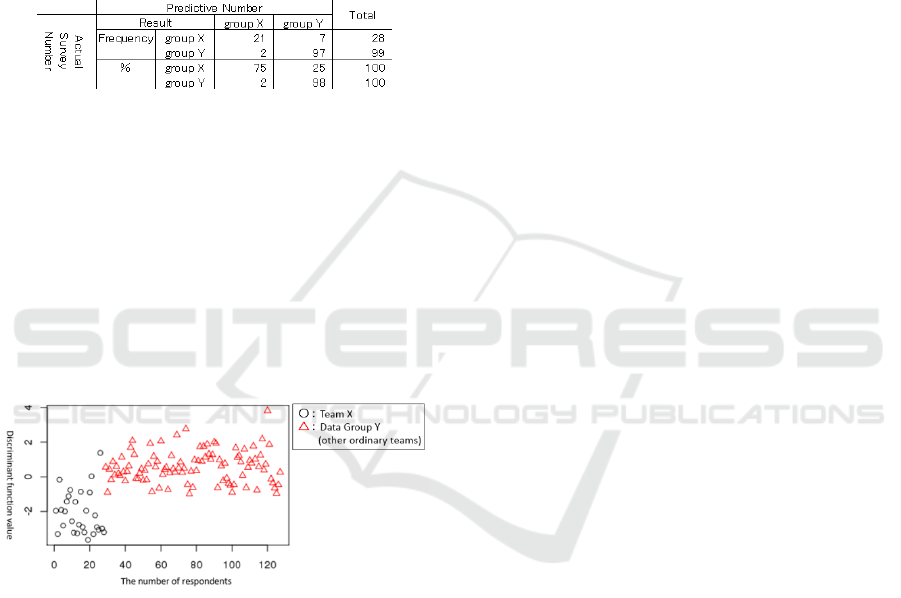
Table 2: Result of discriminant analysis of questionnaire
items.
Each discrimination rate was 75% and 98%, and
the total discrimination rate was 93%. As a result,
discernible differences were found in responses
between Team X and other data group (group Y).
4.3 Discriminant Analysis by Factors
Discriminant analysis was performed in the same way
as that in Section 4.2 using the factors of team
performance (Masuda et al., 2015a; 2015b). The
scatter plot of discrimination scores obtained from the
results is shown in Figure 6.
Figure 6: Scatter plot of discriminant analysis by factors of
team performance.
Figure 6 clearly shows that the performance of
Team X was different from the ordinary team data. It
should be noted that the polarity of the graph does not
represent the magnitude of the performance.
5 DISCUSSION
In this study, CRK was defined as a method for
measuring the maturity of team learning; moreover,
its measurement was verified. In this chapter, we
summarize and discuss the results.
Groupware utilization:
Groupware utilization can be analyzed using the
Lorenz curve as with ML utilization. However,
because the Gini coefficient has a different
meaning between ML and groupware, the
inversion of the Gini coefficient was defined as
CRK.
Case evaluation of CRK:
Team X’s two groupware platforms
(GWTL2012 and GWTL2014) were measured
and analyzed.
Comparative evaluation of team performance:
It was established that Team X and other
ordinary teams could be distinguished on the
basis of a comparison of their team performance
results. Indeed, in this case, high team
performance can be confirmed by the evaluation
of their products.
It is a challenge to analyze causality between
increases in CRK and changes from GWTL2012 to
GWTL2014. There is a need to investigate whether
these changes are related to better proficiency in
using the groupware tools or to the maturation of team
learning.
6 CONCLUSIONS
This study focused on knowledge sharing among
team members and its relation to team learning
maturity. The Lorenz curve and inverted Gini
coefficient were used as measures, with the inverted
Gini coefficient defined as the contribution ratio of
knowledge. The measurements were analyzed to
generate the following results:
1) It is possible to demonstrate groupware
utilization using CRK; thus, CRK can be used as
a substitute for groupware utilization.
2) When team performance is high, CRK is also
high.
Because the number of samples was small, it did
not reach the limits required of a statistical test;
however, it is clear that the hypothesis cannot be
denied from the time-series changes to CRK
discussed in Chapter 3 and the comparison with
other groups’ performance in Chapter 4.
In future, we will expand the measurement range
and continue to verify the measurement of team
learning maturity using CRK. This study measures
the state of the team by analyzing their responses to
the questionnaire. If this verification is successful, we
would be able to measure the progress of team
learning using the contribution ratio of knowledge,
A Case Study of Team Learning Measurements from Groupware Utilization - A Proposal of Measurement Method for the Contribution
Ratio of Knowledge
197

which can be measured more easily and objectively
without resorting to the questionnaire.
ACKNOWLEDGEMENTS
This work was supported by Nomura School of
Advanced Management.
REFERENCES
Kitayama, S., 2009. Social Network Analysis of
Communities in Organization, The Journal of
Communication Studies 29, 3-16.
Gastwirth, J. L., 1972. The Estimation of the Lorenz Curve
and Gini Index, The Review of Economics and Statistics
Vol. 54, No. 3 (Aug., 1972), pp. 306-316.
Masuda, A., 2014a. The Strengths of a team will grow
people, and implementing the techniques: TIPS, which
is obtained from nine years of activity, Software
Symposium 2014.
Masuda, A., 2014b. Spread Team Culture that made with
Team Building to Other Organizations: Effect we’ve
continue to carry out team building, Software Quality
Symposium 2014.
Masuda, A., Morimoto, C., Matsuodani, T., Tsuda, K.,
2015a. Effect Measurement of Team Building
Activities: Result of the Activity for 10 Years, Software
Symposium 2015.
Masuda, A., Morimoto, C., Matsuodani, T., Tsuda, K.,
2015b. A Trial of Team Performance Evaluation and
Team Learning Evaluation in Software Development,
International Conference on Education, Psychology,
and Social Sciences 2015.
Matsuodani, T., 2014. Whether the “Genba-Ryoku” exists
in the IT: Attempt of Evaluation and Measurement,
Software Symposium 2014.
MIT (Ministry of Internal Affairs and Communications),
2009. The development of ICT human resources,
http://www.soumu.go.jp/main_sosiki/joho_tsusin/joho
_jinzai/ (accessed: 29-12-15).
Nakamura, K., 2005. Index for measuring the Income Gap:
the Gini coefficient and the Lorenz curve ,
http://www.pref.toyama.jp/sections/1015/ecm/back/20
05apr/shihyo/ (accessed: 29-12-15).
Moodle, 2015. The Moodle community,
at: https://moodle.org/ (accessed: 29-12-15).
Takasaki, S., Igaki, H., Higo, Y., Kusumoto, S., 2014.
TixRec: Task Recording Support for Retrospectives in
Software Development PBL, IPSJ Journal Vol.55 No.1
199-209.
Senge, P. M., 2006. The Fifth Discipline: The Art and
Practice of the Learning Organization, Broadway
Business.
Wiki, 26 December 2015 23:07 UTC. In Wikipedia: The
Free Encyclopedia. Retrieved from
https://en.wikipedia.org/w/index.php?title=Wiki&oldi
d=696918561 (accessed: 29-12-15).
CSEDU 2016 - 8th International Conference on Computer Supported Education
198
