
Framework to Efficiently Measure Firm Smart Business Performance
in a Global Management Environment
Chui Young Yoon
Department of IT Applied-Convergence, Korea National University of Transportation,
61 Deahak-ro, Jeungpyeong-gun, Chungbuk, South Korea
Keywords: Smart Business, Smart Business Performance, Measurement Factors and Items, Structural Framework.
Abstract: Many firms have implemented their smart business capabilities to efficiently perform management activities
and improve the performance of business tasks in a smart management environment. Firms have applied their
smart business capabilities to management activities in order to raise the performance of business execution
in a global management environment. That is, the measurement and management for the performance of a
firm’s smart business execution need to efficiently build and improve the smart business capability
appropriate for its management strategy and business departments. Hence, a measurement framework is
necessary for efficiently measuring a firm’s smart business performance in order to manage and improve its
smart management capability. The validity and reliability of the developed framework are verified by factor
analysis and reliability analysis based on previous studies. We find a 10-item framework that can reasonably
measure a firm smart business performance in a total performance perspective.
1 INTRODUCTION
Most enterprises perform their management activities
and business tasks with partially and fully utilizing
smart device, network, solutions and systems in a
smart business environment (Busquets, Rodon, and
Wareham, 2009; Chang, Chen, and Zhou, 2009; Heck
and Vervest, 2009; Hilty, Aebischer, and Rizzoli,
2014). Smart business technology is an important
means to improve and preserve a firm’s task
performance in the ever-changing business
environment. Firm smart business capability needs to
increase its business performance in a smart
management environment (Yoon, 2014). Firm smart
business capability needs to increase its business
performance in a smart management environment
(Yoon, 2014). Its smart business performance has to
be measured by a scientific and practical tool in order
to efficiently build and improve a smart business
capability appropriate for the management activities
and business tasks. Enterprise smart business
capability should be improved by objective criteria
based on the analysis results of its smart business
performance in a comprehensive performance
perspective. Enterprise smart business performance
means the business results that a firm performs its
management and business activities based on its
smart business capability in a smart business
perspective. But a comprehensive and practical tool
to measure a firm smart business performance has not
been studied in previous studies. Namely, we need a
measurement framework that can effectively gauge a
firm smart business performance in terms of its entire
smart business performance.
Therefore, this study provides a measurement
framework that can efficiently gauge a firm smart
business performance to effectively build its smart
business capability and improving its smart business
performance in terms of a total smart business
performance.
2 RELATED RESEARCH
Previous literature has considered smart business as
the critical factor to efficiently improve a firm’s
business performance and competitiveness, and to
effectively prepare for a future business environment
with progress of smart technology (Yoon, 2014).
Smart business can be defined as an approach to
increase the competitiveness of organizations by
improving management activities through using
smart technology such as smart devices, networks,
and solutions environment (Busquets, Rodon, and
Yoon, C.
Framework to Efficiently Measure Firm Smart Business Performance in a Global Management Environment.
In Proceedings of the 18th International Conference on Enterprise Information Systems (ICEIS 2016) - Volume 2, pages 625-629
ISBN: 978-989-758-187-8
Copyright
c
2016 by SCITEPRESS – Science and Technology Publications, Lda. All rights reserved
625

Wareham, 2009; Chang, Chen, and Zhou, 2009; Heck
and Vervest, 2009; Hilty, Aebischer, and Rizzoli,
2014). Smart business can be described as a business
process that uses the smart technology medium as a
conduit to fulfil business transactions (Yoon, 2014).
Hence, smart business (SB) can be defined as an
approach to efficiently perform the firm’s
management activities by applying the smart
technology and solutions, and systems to its business
tasks and management activities in a global business
environment.
Literature on enterprise performance provides a
variety of perspectives (Bi and Zhang, 2008; Hu and
Xiang, 2008; Jiao, Chang, and Lu, 2008; Liao and
Chuang, 2006; Liu and Feng, 2008; Mei and Nie,
2007; Sun, Ding, and Gu, 2008; Tseng, Chiu, and
Chen, 2009). The firm performance includes three
factors such as improving client satisfaction,
enhancing organizational competitiveness, and
enhancing organizational image (Sun, Ding, and Gu,
2008). These studies focused on financial and non-
financial perspectives. In financial research, the
measurement of firm performance was studied in
terms of sale growth, earning growth, market share,
return on assets (ROA), return on sales (ROS), and
market value (Liu and Feng, 2008). In non-financial
research, a firm’s performance was measured by
efficiency, effectiveness, profitability, quality of
service, client satisfaction, and productivity (Bi and
Zhang, 2008; Hu and Xiang, 2008; Jiao, Chang, and
Lu, 2008; Liao and Chuang, 2006; Liu and Feng,
2008; Mei and Nie, 2007; Sun, Ding, and Gu, 2008).
This is their satisfaction level about their firm’s
performance in terms of growth in sale, growth in
profits, and growth in market share (Mei and Nie,
2007). By exploring these studies, this research
describes enterprise performance as the effectiveness
and efficiency of its management activities that are
improved by utilizing enterprise IT capability for its
management activities. Firm smart business
performance is able to transform enterprise
performance into a type of enterprise performance
based on a smart business performance perspective.
Hence, firm smart business performance (FSBP)
can be defined as the performance that a firm can
obtain with applying the smart business capability to
its management activities and business tasks in a
global management environment. Namely, FSBP
means a total smart business performance that a firm
can get from applying its smart business capability to
its management activities and business tasks in a
smart management environment.
Based on these previous literature, we extract the
analysis factors and items to measure firm
performance in a smart business perspective as
follows: operation performance (efficiency of
business process, inventory turnover and accounts,
quality of services, and client satisfaction), growth
performance (sale revenue growth, market growth,
market value, and return on sale), profitability
performance (sale gross and profit margin, net
income growth, growth in profits, and cash turnover
ratio), and competitiveness performance (sale growth
rate, capital structure, market share, number of
patents, customer share, and R&D expenditure ratio)
(Bi and Zhang, 2008; Hu and Xiang, 2008; Liao and
Chuang, 2006; Liu and Feng, 2008; Mei and Nie,
2007; Sun, Ding, and Gu, 2008; Tseng, Chiu, and
Chen, 2009). We use these items as measures with
which to gauge the FSBP through the verification
process of a validity and reliability analysis.
3 METHODS
This study initially generated 19 measurement items
for FSBP based on definitions and components of
enterprise performance (Bi and Zhang, 2008; Hu and
Xiang, 2008; Jiao, Chang, and Lu, 2008; Liao and
Chuang, 2006; Liu and Feng, 2008; Mei and Nie,
2007; Sun, Ding, and Gu, 2008; Tseng, Chiu, and
Chen, 2009). We analyzed the construct validity of
the refined items to ensure that FSBP is efficiently
measured by the items. The construct validity of the
model was researched by many researchers. These
studies presented two methods of model construct
validation: (1) correlations between total scores and
item scores, and (2) factor analysis (Etezadi-Amoli
and Farhoodmand, 1996; Mei and Nie, 2007;
Torkzadeh and Doll, 1999; Torkzadeh and Lee, 2003).
Etezadi-Amoli and Farhoodmand (1996) used factor
analysis to verify the validity of the measurement tool
construct. Torkzadeh and Doll (1999) and Torkzadeh
and Lee (2003) used correlation analysis to verify the
validity of the measurement tool construct. This study
is likely to verify the validity of the analysis tool
construct and the extraction of adequate analysis
items by factor analysis and reliability analysis. The
ratio of sample size to number of measurement items
(11:1) was above the minimum (10:1) ratio suggested
for factor analysis (Etezadi-Amoli and Farhoodmand,
1996; Torkzadeh and Doll, 1999; Torkzadeh and Lee,
2003). The analysis questionnaire used a five-point
Likert-type scale; where, 1: not at all; 2: a little; 3:
moderate; 4: good; 5: very good. The survey was
gathered data from a variety of industries, business
departments, experience, and education. We
performed two kinds of survey methods: direct
ICEIS 2016 - 18th International Conference on Enterprise Information Systems
626

collection and e-mail. The respondents either directly
mailed back the completed questionnaires or research
assistants collected them 2-3 weeks later. The
collected questionnaires represented 41 % of the
respondents.
3.1 Sample Characteristics
This research collected a sample of 166 usable
responses obtained from a variety of industries and
business departments. We excluded nine incomplete
or ambiguous questionnaires, leaving 157 usable
questionnaires for statistical analysis. The
respondents in terms of business departments were
identified as strategy planning (16.6%), development
and maintenance (16.0%), business application
(36.9%), and administration support (30.5%). The
respondent had on average of 9.6 years of experience
(S.D. =1.018) in their field, their average age was
34.9 years old (S.D. =5.168), and their gender, male
(70.7%) and female (29.3%). This survey was
intentionally focused on various industries and
persons working above the 10 years within their firms.
Namely, the respondents could efficiently provide the
correct responses for our questionnaire survey.
3.2 Analysis and Discussion
After factor analysis and reliability analysis, the first
19 measurement items were reduced to 10 items, with
9 items were deleted, with applying the criterion of
previous studies (Etezadi-Amoli and Farhoodmand,
1996; Torkzadeh and Doll, 1999; Torkzadeh and Lee,
2003). The elimination was sufficiently considered to
ensure that the retained items were adequate analysis
items of FSBP. The validity and reliability of the
developed framework were also verified through
factor analysis and reliability analysis. They were
used to identify the underlying factors or components
that comprise the FSBP construct. Each of the 10
items had a factor loading > 0.634. The reliability
coefficients (Cronbach’s alpha) of four potential
factors had values > 0.801 as indicated in Table 1,
above the threshold recommended for exploratory
research (Etezadi-Amoli and Farhoodmand, 1996;
Torkzadeh and Doll, 1999; Torkzadeh and Lee,
2003). This research calculated the corrected item-
total correlations between each variable and its
corresponding factor in order to investigating the
reliability and validity of the measurement items.
These correlations along with alpha coefficients of
each factor are presented in Table 1.
Table 1: Reliability, validity, and factor loadings of FSBP
construct.
These coefficients indicate the relative contribution
of a measurement item to the construction of a scale
for gauging a particular factor. Most corrected item-
total correlations were greater than 0.602, showing
that the measurement items are good indicators of
their corresponding factors. The extracted items have
a validity and reliability in terms of an analysis
construct based on the analysis results as presented in
Table 1. These results may be successfully achieved
by accumulating many research findings and case
studies. Through reflecting the analysis results of case
studies, the developed analysis tool can be became
more objective and practical scale in the application
of industrial fields.
4 MEASUREMENT
FRAMEWORK OF FSBP
We provided the 10 measurement items appropriate
for measuring FSBP. This research classified four
factor groups from the factor analysis. The factor
groups indicate the potential factors as major
measurement components to gauge FSBP. By
exploring the measurement items of each factor group,
we identified the following four potential factors:
factor 1: SB operation performance; factor 2: SB
growth performance; factor 3: SB profitability
performance; and factor 4: SB competitiveness
performance. These factors comprise the overall
measurement content for FSBP from SB operation
performance to SB competitiveness performance.
The potential 4 analysis factors are used as the 4 core
measurement factors of our framework construct. The
meanings and measurement items of each factor are
as follows. SB operation performance represents the
Va ri ab l e
Factor Loading
Corrected
Item-Total
Correlation
Coefficients
Alpha
Factor 1 Factor 2 Factor 3 Factor 4
V01 0.771 0.679
0.815V03 0.794 0.731
V04 0.665 0.637
V06 0.802 0.733
0.833
V08 0.826 0.636
V10 0.801 0.725
0.837V13 0.836 0.641
V15 0.711 0.612
V17 0.796 0.659
0.801
V19 0.634 0.602
Framework to Efficiently Measure Firm Smart Business Performance in a Global Management Environment
627
efficiency and effectiveness improved by applying
the firm smart business capability to its management
activities in a firm operation perspective. That is, the
operation performance indicates the result that a firm
obtains from its smart management activities in terms
of business execution. It includes efficiency of
business process, quality of service, and client
satisfaction in firm management activities. SB growth
performance presents the efficiency and effectiveness
raised by applying the firm smart business capability
to its management activities in a firm growth
perspective. It comprises sale revenue growth and
market growth. SB profitability performance means
the efficiency and effectiveness improved by
applying the firm smart business capability to its
management activities in an enterprise profit
perspective. It has sale gross and profit margin,
growth in profits, and net income growth. And, SB
competitiveness performance refers to the efficiency
and effectiveness increasing by utilizing the firm
smart business capability for its management
activities. Namely, SB competitiveness performance
means the total smart business performance of an
enterprise in a competitiveness perspective. It
contains sale growth rate and market share. Our
findings provide a structural framework that can
efficiently measure FSBP in terms of a total smart
business performance from SB operation
performance to SB competitiveness performance,
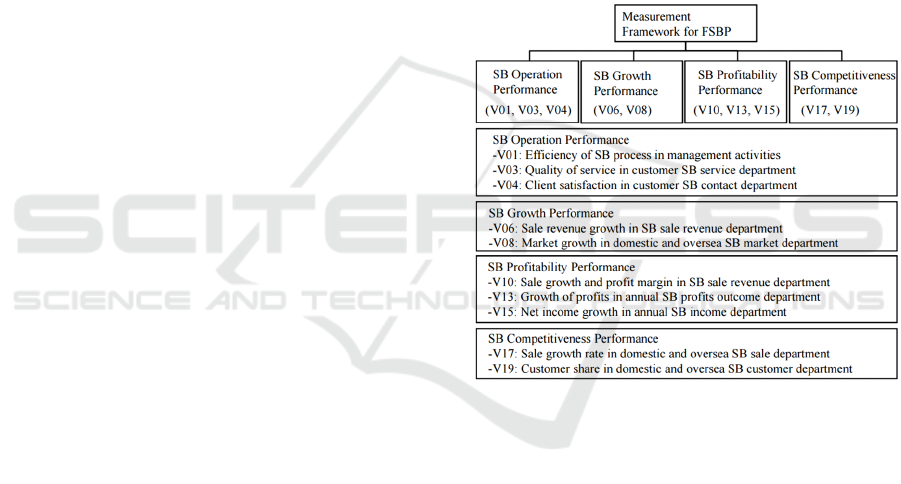
including 4 measurement factors and 10 items. This
framework includes four measurement factors such as
SB operation performance, SB growth performance,
SB profitability performance, and SB
competitiveness performance (Fig. 1). Each factor
has two or three measurement items. As indicated in
Table 1 and Fig.1, SB operation performance has the
analysis items, such as V01, V03, and V04. SB
growth performance includes V06 and V08. SB
profitability performance contains V10, V13, and
V15. SB competitiveness performance comprises
V17 and V19. These factors affect FSBP, that is, the
total FSBP of a firm. It is important to improve and
manage FSBP by measuring a firm’s SB performance
with a valid and reliable instrument. Using this
framework can facilitate efficiently raising a firm’s
SB performance. Measuring FSBP is a critical
method to investigate the total smart business
performance of an enterprise, based on its SB
operation performance, SB growth performance, SB
profitability performance, and SB competitiveness
performance. Hence, the developed framework for
FSBP consists of 4 measurement factors and 10 items
verified by the previous analysis results as shown in
Figure 1. The developed framework is an important
theoretical construct to efficiently measure the total
smart business performance that a firm can obtains by
utilizing its smart business capability for its
management activities in a smart management
environment.
Hence, understanding the FSBP construct is
essential to measure the success of FSBP that denotes
the total SB performance to efficiently support its
management activities. We can use the structural
framework to measure FSBP across different
industrial fields and business departments, and
perhaps even as a global measure. Therefore, the
developed framework is an important theoretical
construct to efficiently gauge the total SB
performance that a firm can obtains by utilizing its SB
capability for its management activities in a global
management environment.
Figure 1: The developed measurement framework
construct.
5 CONCLUSIONS
This study provides a structural framework that can
measure perceived FSBP from a total smart business
performance perspective. This 10-item scale
framework is implicative, concrete, easy to use, and
appropriate for practical and research purposes. We
also have some limitations in terms of a specific
FSBP perspective. This problem can be solved by
many comparative and cumulative research findings.
The developed framework with adequate validity and
reliability provides groundwork for the development
of a standard framework of FSBP.
Therefore, this study presents a structural
framework that can efficiently measure FSBP that a
ICEIS 2016 - 18th International Conference on Enterprise Information Systems
628

firm can obtain by applying a firm smart business
capability to its management activities and business
tasks in a global management environment. In future
research, we will find the practicality and availability
of the developed framework with providing the
measurement results by applying it to many case
studies.
ACKNOWLEDGEMENTS
This research was supported by Basic Science
Research Program through the National Research
Foundation of Korea (NRF) funded by the Ministry
of Education, Science and Technology (NO:
2013R1A1A2012350).
REFERENCES
Bi, X., Zhang, H., 2008. An Empirical Research on
Relationship between Information Technology
Capability and Firm Performance: the Evidence from
Listed Companies and Information Power 500 in China.
Proceedings of 2008 International Conference on
Computer Science and Software Engineering. 540-544.
Busquets, J., Rodon, J., Wareham, J., 2009. Adaptability in
smart business networks: An exploratory case in the
insurance industry. Decision Support Systems. 47, 287-
296.
Chang, Y. F., Chen, C. S., Zhou, H., 2009. Smart phone for
mobile commerce. Computer Standards & Interface. 31,
740-747.
Etezadi-Amoli, J., Farhoomand, A. F., 1996. A Structural
Model of End User Information Satisfaction and User
Performance. Information & Management. 30, 65-73.
Heck, E. V. and Vervest, P., 2009. Smart business networks:
Concepts and empirical evidence. Decision Support
Systems. 47, 275-276.
Hilty, L. M., Aebischer, B., Rizzoli, A., 2014. Modeling
and evaluating the sustainability of smart solutions.
Environmental Modeling & Software. 56, 1-5.
Hu, B., Xiang, Y., 2008. An Empirical Study of Effects of
Information Systems Resources. Proceedings of 2008
International Seminar on Future Information
Technology and Management Engineering. 335-338.
Jiao, H., Chang, C., Lu, Y., 2008. The Relationship on
Information Technology Capability and Performance:
An Empirical Research in the Context of China’s
Yangtze River Delta Region. Proceedings of the IEEE
International Conference on Industrial Engineering
and Engineering Management. 872-876.
Jiang, J., Zhang, J., 2008. Strategic Co-operative E & D and
Firm Performance in Emerging B2B E-Commerce.
Proceedings of the IEEE International Conference on
e-Business Engineering. 537-542.
Liao, C., Chuang, S. H., 2006. Exploring the Role of
Knowledge Management for Enhancing Firm’s
Innovation and Performance. Proceedings of the 39th
Hawaii International Conference on System Sciences.
7, 158a-167a.
Liu, Z. Q., Feng, Y. J., 2008. An Analysis of Diversification
and Firm Performance. Proceedings of the 15th
International Conference on Management Science &
Engineering. 456-461.
Mckeen, J. D., Zack, M. H., Singh, S., 2006. Knowledge
Management and Organizational Performance: An
Exploratory Survey. Proceedings of the 39th Annual
Hawaii International Conference on System Sciences.
1-9.
Mei, S., Nie, M., 2007. Technology Capability, Marketing
Capability and Network Capability: Keys to Enhancing
Competitiveness and Improving Performance.
Proceedings of the 14th International Conference on
Management Science & Engineering. 728-733.
Sherif, K., Hoffman, J., Thomas, B., 2006. Can technology
build organizational social capital? The case of a global
IT consulting firm. Information & Management. 43(7),
795-804.
Sun, J., Ding, L., Gu, X., 2008. Empirical Study on Impact
of Information Technology on Construction Firm
Performance. Proceedings of 2008 International
Conference on Information Management, Innovation
Management and Industrial Engineering. 54-57.
Tippins, M. J., Sohi, R. S., 2003. IT Competency and Firm
Performance: Is Organizational Learning a Missing
Link. Strategic Management Journal. 24, 745-761.
Torkzadeh, G., Doll, W. J., 1999. The Development of a
Tool for Measuring the Perceived Impact of
Information Technology on Work. Omega,
International Journal of Measurement Science. 27,
327-339.
Torkzadeh, G., Lee, J. W., 2003. Measures of Perceived
End-user’s Information Skills. Information &
Management. 40, 607-615.
Tseng, F. M., Chiu, Y. J., Chen, J. S., 2009. Measuring
business performance in the high-tech manufacturing
industry: A case study of Taiwan’s large-sized TFT-
LCD panel companies. The International Journal of
Management Science. 37, 686-697.
Yoon, C. Y., 2014. A Structural Tool to Efficiently Analyze
Enterprise Smart Business Capability in a total Smart
Business Capability Perspective. iNFORMATION An
International Interdisciplinary Journal. 17(11-A),
5607-5618.
Framework to Efficiently Measure Firm Smart Business Performance in a Global Management Environment
629
