
Gathering GPR Inspections and UAV Survey in Cultural Heritage
Documentation Context
Alessandro Arato
2
, Flora Garofalo
2
, Giulia Sammartano
1
and Antonia Spanò
1
1
(DAD) Department of Architecture and Design, Politecnico di Torino, Torino, Italy
2
(DIATI) Department of Environment, Land and Infrastructure Engineering, Politecnico di Torino, Torino, Italy
Keywords: UAV Photogrammetry, Ground Penetrating Radar (GPR), Historical Maps, GIS, Cultural Heritage.
Abstract: The archaeological researches and more generally the Cultural Heritage (CH) documentation and
conservation activities have been favourably disposed to the use of new technologies, with renewed and
increasing interest in the use of integrated techniques.
In the field of Geomatics the advent of advanced technologies has allowed and facilitated multidisciplinary
studies as well as combined approaches to the documentation in various contexts. The production of spatially
located data (e.g. from active or passive sensors placed in different system segments, from terrestrial to aerial
to satellite position) and their interoperability from different source, with the help of Geographic Information
Systems (GIS), were then made easier.
The work has the aim of investigating the integration of multiple data derived from aerial photogrammetry
products through Unmanned Aerial Vehicles (UAV) survey, from geophysical Ground Penetrating Radar
(GPR) prospection technique and analysis of historical maps. An archaeological area in the south of Piedmont
(Italy), next to the ancient Roman settlement of Pollentia, has been the test case. The present fulfilled test was
objected to exclude ancient presences, although this type of workflow is generally aimed to analyse and
compare results in order to formulate some hypothesis about the potential presence of submerged elements or
built substructures in the investigated area.
1 INTRODUCTION
Adding to the widening of cultural assets typologies
subject to the safeguard aims, ranging from ancient to
modern heritage, from architectural to landscape, and
from mobile assets to intangible cultural heritage, the
increasing challenges of CH conservation has given
rise to an incessant specialization of methods
involved in the protection projects. This trend has
become visible in data collecting and survey, data
archiving and structuring, and finally in
communication and dissemination processes. Some
features are increasingly requested to acquisition
techniques: mainly 3D nature of data, quick acquiring
and low cost solutions, keeping high accuracies and
overall quality. On these bases, the present paper wish
to investigate the integration of strengthened
techniques as Ground Penetrating Radar purposed to
search possible submerged archaeological remains,
with emergent methods for quick large-scale
mapping, generated from UAV photogrammetry.
Moreover the examination of historical maps,
generally highly significant in this kind of project,
have been compared and commented by GIS tools in
final results.
2 METHODS
2.1 UAV Photogrammetry
The UAV photogrammetry has developed very
rapidly whereas it is able to fulfil successfully the
large-scale maps updating in many fields such as
environmental, CH applications. (Haala et al., 2011)
One relevant strong point of UAV systems for
photogrammetry is the nadiral point of view
connected with the ability to choose the height of
flight depending on the requested scale of survey.
The low cost, the high handily with contained
playloads, and the ability to perform autonomous
flights starting from a predefined flight plan, are other
decisive advantages. Navigation sensors such as
GNSS receivers (Global Navigation Satellite System)
Arato, A., Garofalo, F., Sammartano, G. and Spanò, A.
Gathering GPR Inspections and UAV Survey in Cultural Heritage Documentation Context.
In Proceedings of the 2nd International Conference on Geographical Information Systems Theory, Applications and Management (GISTAM 2016), pages 85-91
ISBN: 978-989-758-188-5
Copyright
c
2016 by SCITEPRESS – Science and Technology Publications, Lda. All rights reserved
85

and inertial sensors (IMU, Inertial Measurement
Unit) are conveniently integrated; the effectiveness of
the whole system depends from the balance of their
accuracy and reliability with the Flight control
device. (Rinaudo et al., 2012)
The product of UAV photogrammetry consists in
a set of images from which it is possible to extract
point clouds, 3D textured models, Digital Surface
Model (DSM) and Orthophoto the processes are
mainly automated by an image matching technique,
so it’s clear the reasons of increase.
In the next experience the only ortophoto will be
used, which is absolutely the most automated product
that is possible to derive, and this is one of the main
reason of the method choice.
Structure-from-Motion (SFM) systems allow
estimating the 3D position of points represented in
multiple images, reconstructing the geometry of the
represented object (structure) and the acquisitions
position (motion), even when are not available the
defined camera calibration parameters. The
characteristic elements (tie-features) of images are
automatically preliminarily extracted; in particular
they are extracted objects (points) recognizable by the
software thanks to the radiometric contrast in
different directions, which identifies unambiguously
the pixel. One of the most common algorithms for
features identification and description for the
association and the consequent orientation of images
in photogrammetric software and computer vision is
SIFT (Scale-Invariant Feature Transform). (Lowe,
2004; Szeliski,
2011)
In the next step of feature matching, points with
more similar descriptors (recognized by the software
as homologous) are aligned to make the next step of
triangulation - bundle adjustment.
In SFM processes the orientation parameters are
not necessarily known; so, using the rules of the
epipolar geometry, which regulates relations between
the tie points (TP), the acquisition centers and the
point 3D position, to direct acquisitions and estimate
internal and external orientation.
Figure 1: Two example of unmanned vehicles, the ones
used in the further test: hexacopter by Mikrokopter and
Ebee by Sensfly.
2.2 GPR (Ground Penetrating Radar)
Survey
GPR method is based on the generation of an
electromagnetic (EM) impulse through a signal
generator, connected to a transmitting antenna (Tx)
and a receiving antenna (Rx). The GPR systems work
in the frequency range between 10 MHz and 3 GHz.
The choice of the system frequency is essential and
has to be made according to the scope of the survey.
In fact, being the frequency inversely proportional to
the wavelength, lower frequencies imply deeper
signal penetration but lower resolution, while higher
frequency allow the increase the resolution but
reducing the signal penetration.
In archaeological researches, GPR survey is used
in order to correlate electromagnetic impedance
contrasts to possible submerged remains.
The electromagnetic discontinuities (or dielectric
interfaces), act as signal reflectors, refractors and
diffractors, via multiple mechanisms (e.g. Davis and
Annan, 1989; Reynolds, 1997). Soil specific
characteristics, like structure and texture, mineral
composition, pore-fluid distribution and chemistry,
influence the signal penetration as well (e.g. Sen et
al., 1981; Friedman, 1998; Cosenza et al., 2003).
Each reflection implies an energy loss, and the
received signal is strongly attenuated with respect to
the constant transmitted signal. Common GPR
surveys are carried out along profiles, with the aim of
obtaining 2-dimensional (2-D) sections of the subsoil.
A radar profile is a composition of all the recorded
signals, called traces, and allows to understand the
subsoil inhomogeneity, or dielectric interfaces. In
archaeological context, the analysis of a single profile
is not sufficient, and a 3-D survey must be done to
map the lateral discontinuities. The results are usually
presented in the form of time-slices, horizontal maps
at constant time (or depth).
2.3 Historical Maps Contribution and
Their Spatial Reference
The success of the GPR survey is highly affected by
the prevision of searched remains. The shape of
possible submerged building elements related with
the period of construction and especially the depth at
whom they are expected to be found are very relevant
in order to correctly plan the parameters of GPR
survey. Then a panoramic examination of historical
cartography is usually highly advisable.
The geometric and projective characteristics and
properties of early cartographic representations have
been largely studied when digital technologies have
GISTAM 2016 - 2nd International Conference on Geographical Information Systems Theory, Applications and Management
86

spread new perspectives for the visualization in the
same spatial reference of recent maps. (e.g.
Livieratos, 2006; Balletti, 2006).
Many research projects has directed efforts towards
the use of GIS techniques of calibration, georeferencing
and transformation of projection, for enabling the
comparison among historical and actual maps.
In brief, the relation among the points coordinates
of historical maps that have been transformed in image
coordinates and the homologous coordinates in recent
reference system are searched by Ground control
points, derived by GPS survey or digital recent maps.
3 THE EXPERIENCE ON THE
ARCHAEOLOGICAL AREA
The site under investigation is a plot of about 200 x 200 m;
the area is flat, with some irregularities and some obstacles
but the key point is the proximity to the ancient Roman
settlement of Pollentia, the most ancient city of Tanaro
Valley in South Piedmont. Archaeological researches
lightened that the roman village was extended south to the
roman amphitheatre, currently visible because of the village
developed upon it. (Figure 2, 3). (Spanò et al., 2007)
Since the plot is placed close to the road for Alba
Pompeia, some funerary remains or burials were the only
ancient elements that were reasonably expectable to be
found.
Figure 2: Excerpt from the
orthophoto IT 2000 -
Piedmont Region and
highlighting the involved lot.
Figure 3: The Pollentia
large-scale archaeological
map superimposed on the
regional digital map.
The site presents a plantation of walnut trees, arranged
in the 1960s, so the usually desirable maps or aerial
photograms recognition aimed to search crop-marks was
in this case to be discarded. Therefore, the GPR survey,
spatially located by the UAV photogrammetrical
application, was performed according to the next report
and after results some historical maps have been useful to
complete the reading.
3.1 Photogrammetric Survey of Lot
2076 in Pollenzo by Drones
The first purpose of the photogrammetric flight on the
Pollenzo 2076 lot was exactly the fast generation of a
high resolution ortophoto, using aerial photos acquired
contemporary to GPS survey in order to keep easily the
spatial reference of GPR profiles. Actually two flights
have been fulfilled by two different systems: a fix wing
drone performing a 120 m height flight (Ebee SenseFly)
and a hexacopter drone (by Mikrokopter) for a lower
flight ensuring higher resolution. Provided that the two
aircrafts are featured by different maximum altitude,
maximum flight time, radio link range etc. they share
important abilities for mapping purposes. Mainly it is the
automated plan flight that is based on waypoints: that
enable to foresee all parameters in order to acquire
perfectly planned photogrammetric strips, including the
desired overlapping and ground sampling distance.
The setting up of a topographic network and the
measure of control points by GPS/GNSS techniques
preceded the flights, guaranteed the processing of the
orthophoto in the reference system of regional maps
(WGS84-ETRF2000) and ensured the required
accuracies.
The digital camera Sony Nex 5 acquired the large
amount of aerial photos, reduced to 104 through a
automated selection procedure; those photos with an
overlap between consecutive frames of more than
90% are very suitable for a SfM approache.
Photogrammetric orientation and ortophoto
generation results:
104 photograms
ground resolution: 0.03 m/pix,
Camera stations: 104,
Tie-points: 21122,
Medium error on GCP: 0.06 m,
Medium error on CP: 0.13 m
3.2 GPR Data Acquisition and Signal
Processing on Lot 2076
The survey was conducted along parallel lines,
keeping at least 1 m of distance from the trees. The
tree roots have a significant influence on signal
penetration, as they act as diffractors and tend to
scatter the signal in several directions. The site was
almost plain, with obstacles (trunks, branches, soil
accumulations) and some irregularities. A muddy
upper soil layer (5 cm) was present over all the area.
GPR data were acquired along 84 parallel profiles,
covering a total area of 2000 m
2
(Figure 4). 50
profiles, having 66.5 m length, were acquired along
NW-SE direction, while the remaining 34 profiles,
Gathering GPR Inspections and UAV Survey in Cultural Heritage Documentation Context
87
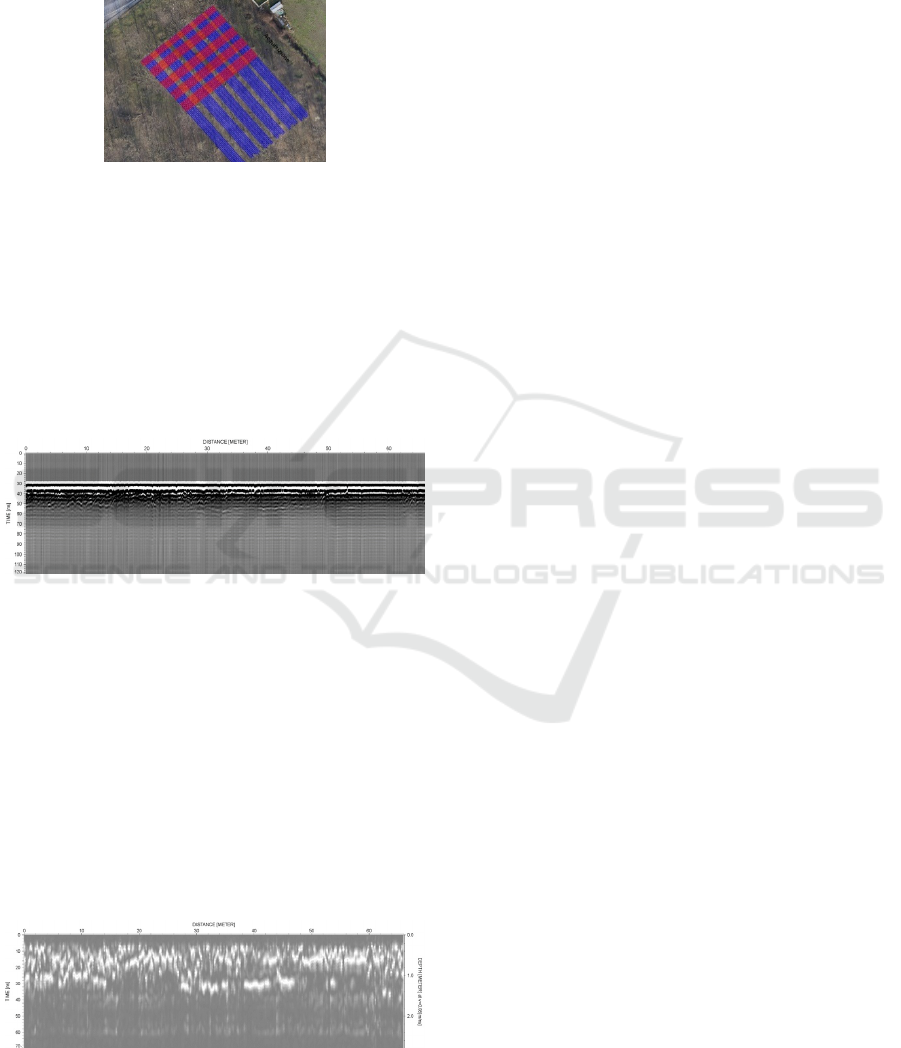
along SW-NE direction, were 40 m long.
The inter-profile distance was 0.6 m (except 3 m
gaps in correspondence of the tree rows), in order to
guarantee a spatial coverage, adequate to expected
size of the remains.
Figure 4: Acquisition profiles on orthophoto: blue and red
lines indicate, respectively, NW-SE and SW-NE profiles.
GPR survey was conducted by using IDS K2-
MCH radar system, with 70 MHz and 200 MHz
antennae, and an integrated survey wheel encoder.
Each trace was sampled in-time, over a sampling
window of 120 ns, with 1024 samples. A single radar
trace was acquired every 3.5 cm along the profiles.
An example rawdata profile (acquired along NW-
SE direction, y=0 m), is shown in Figure 5.
Figure 5: Example of raw GPR profile, (NW-SE direction,
y=0 m).
Following a preliminary rawdata analysis, we
decided to process only the data acquired with the 200
MHz, which were more focused on the target depths
(down to 1.4 m) and had the necessary resolution to
discriminate possible targets.
The example profile shows the main bang (main
reflection at ground-antenna interface), several
diffraction hyperbolae (10-20 ns), and some
continuous reflections (25.30 ns, at distance between
0-20 m and 30-50 m). At higher times, ringing signals
mask the presence of other possible reflectors.
Figure 6: Example of resulting GPR profile, (NW-SE
direction, y=0 m).
Each profile has been processed for reducing the
noise and extracting the significant signal features.
Low-frequency noise filter, move start-time, trace
migration and band-pass filter have been applied to
extract the resulting profiles. An example is shown in
Figure 6. White features correspond to the stronger
amplitudes of reflections, which can be associated to
the anomalies present at the site.
Time-to-depth conversion, for each profile, has
been done by imposing a wave velocity of 0.08 m/ns.
This value is a reasonable approximation of GPR
wave velocity in sedimentary soils, (fine sands with
high water content, silty sands, silts, etc.). The Italian
Geological Survey identifies the soil at Pollenzo site
as clayey-sandy alluvial sediments (Carta Geologica
d’Italia, Foglio n° 68, Carmagnola, 1:10000).
3.3 Results and Comparison
The processed profiles have been combined in 3D
volumes of amplitude of reflection of the GPR
signals, and several horizontal time-slices have been
extracted. From the analysis of data, the following
considerations can be made:
Incoherent reflections and diffractions are present
the depth range between 0 and 0.8 m, caused by
coarse gravel, blocks and the roots;
In the depth range between 0.9-1.3 m, a high-
amplitude area is present; marked with white
lines. It is referred to as “Anomaly 1”.
Two continuous reflections, located along WNW-
ESE direction (black line), and SW-NE direction
(red line) can be identified. These two anomalies
are referred to, respectively, as “Anomaly 2” and
“Anomaly 3”.
At higher depths, below 1.5 m from the surface,
no significant anomalies can be identified. This is
caused by the limited signal penetration in this
particular context.
The spatial reference of time-slice was related during
the analysis phase to a local coordinate system, with
the origin is located at the top left corner of the area.
Since the time-slice can be displayed ad a tiff image
format, the cartographic reference has been assigned
by a simple rototraslation function, easily manageable
and imposed in tfw file. (Figure 7).
GISTAM 2016 - 2nd International Conference on Geographical Information Systems Theory, Applications and Management
88
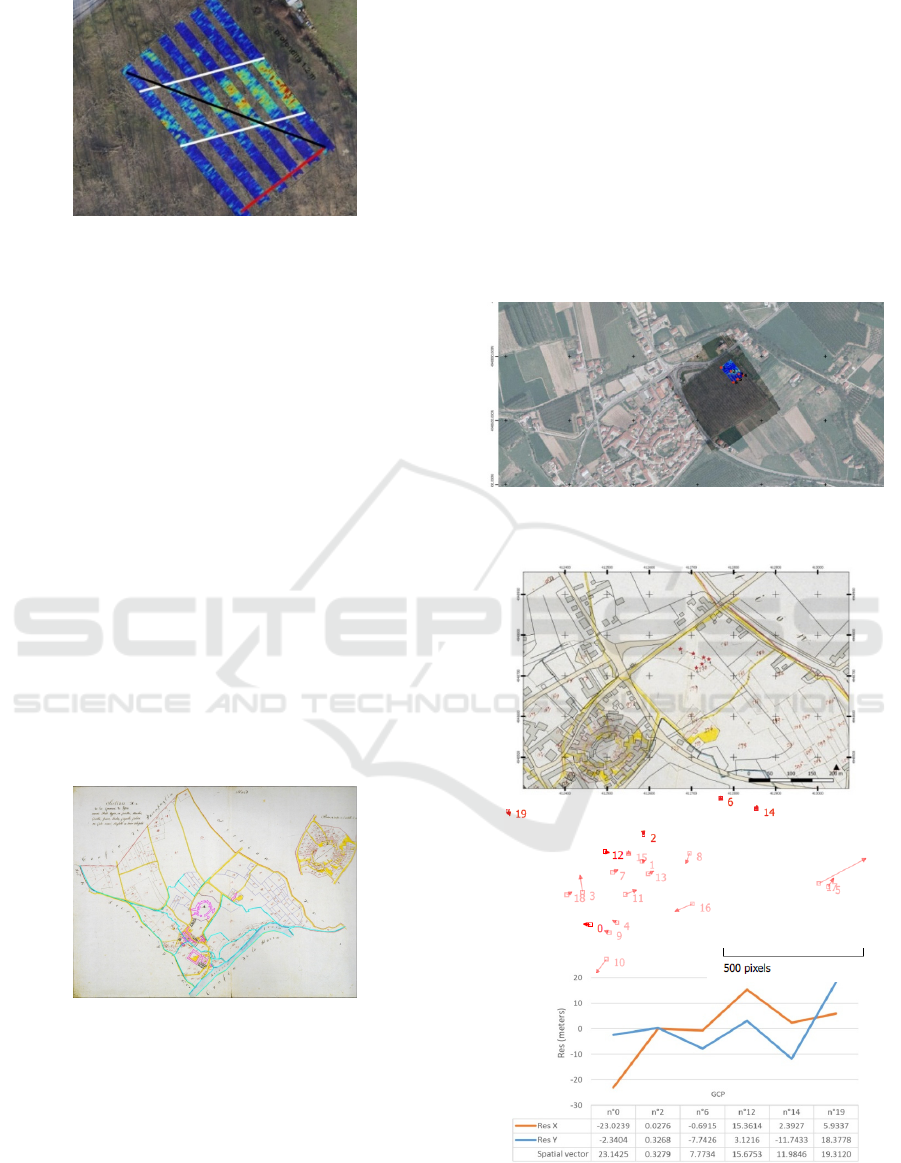
Figure 7: Superimposition of time-slice at 1.2 m of depth
on orthophoto, with main anomalies derived from
geophisical prospections highlighted.
3.3.1 Historical Cadastral Map
The more significant historical maps of new era for
Piedmont territory is the “Carta Generale de’ Stati di
S.A.R.” di G. T. Borgonio (1680). This map represent
the beginning of a systematic knowledge course of
estates by means of cartography. It correspond to a
renewed will of administrative and military control of
the land (Ricci, Carassi, 1986), but certainly the map
scale is not proper for parcels positioning. In the
political framework of strengthening of Savoy State,
starting from the beginning of the XVIIIth century,
the territorial fiscal control has been launched by the
cadastral registry and maps.
The “Catasto antico sabaudo” achieved during
the XVIIIth century underwent a precise
enhancement with the French real estate Registry of
1802-1814. This new map had to be harmonized to
the new French map of Cassini, having the same
scale.
Figure 8: French particles calastral map (1810), Section Xx
de la Comune de Brà, portion A.
It’s not possible to know many information on
map accuracy; we know that during the XVIIIth
century the Snellius triangulation has been largely
adopted and near the 60’s of the XVIIIth century the
studies aimed to the ellipsoid determination started
within the astronomical observatory of Turin in order
to calculate the degree (Gradus taurinensis Augustæ
Taurinorum, cited in (Frasca, 2004)). Moreover, as
fundamental basis of the whole Piedmont
topographical triangulation, the straight royal road
connecting Torino with Rivoli has been chosen.
The interesting aspect represented in the French
map is a different parcels partitioning as compared to
the current situation.
A seven parameters Helmert transformation (1)
has been used in order to provide a spatial reference
to the French map and compare the position of GPR
anomalies with the position of the no longer existed
parcels.
X
p
= T lR (a
1
, a
2
, a
3
) u
P
(1)
Figure 9: Time-slice and related anomalies referenced to
UAV ortophoto, superimposing regional orthomap.
Figure 10: (upward) Transformation of French map using
points selected from regional medium scale map. (center)
Directions of residual vectors, in red, and (bottom) least
square residuals on points.
Gathering GPR Inspections and UAV Survey in Cultural Heritage Documentation Context
89

The best dozen of points selected on historical
map and most probably still existing, have been used
to perform the transformation. The least square
residuals calculation provide an uncertainty of points
coordinates near to 20 meters, which is exactly the
distance between anomalies and historical parcels
division. (Figure 10 and graph)
4 CONCLUSIONS
Spatial location and GIS tools have accomplished the
complete comparison among geophysical and
historical data.
The geophysical survey permitted to locate some
GPR anomalies that could have possibly been attributed
to archaeological remains. The joint geomatic-
geophysical survey, with the help of historical maps
recognition and analysis, permitted to locate and geo-refer
the geophysical anomalies, and to describe their nature
more reliably. A successive excavation activity confirmed
that the different anomalies are attributable to geological
and sedimentological discontinuities. Anomalies at point
2 and 3 are then to be linked to a paleo-channel of Tanaro
River, which had a high flow velocity and could transport
gravel particles and blocks. Anomalies at point 1, 4, 5 and
6 are attributable to sand and fine gravel accumulations
due to natural flow patterns or to anthropic channeled
flows within small irrigation channels, which served at
that time to partialize the different soil plots. This last
seem to be perfectly confirmed by historical map.
Many times the use of GPS/GNNS survey and
polynomial transformations enable to reduce the
effects of deformation of sheet maps and those due to
the different systems of representation and
measurement (Baiocchi and Lelo, 2010). Furthermore,
on these basis many project of accessibility of
historical cartographic heritage through the web have
been fulfilled enabling the visualization from Web
services. (e.g. Brovelli et al., 2012).
The enhancement of points residuals after
historical maps transformation is surely achievable by
ground measures, but this is profitable if the historical
maps are recent and drawn by systems which are
comparable with modern methods.
Some considerations upon methods can be
underlined: now the image standard formats are highly
interoperable, since geophysical, historical maps, and
UAV products can be visualized in the same reference
system. UAVs related to SfM technique provide 3D
spatial data remarkably improved in the large scale
environment and their products fit a very large set of
needs.
ACKNOWLEDGEMENTS
Diego Franco from ENGEL-Environmental-
Engineering Geophysics Laboratory took part to the
field GPR survey. The UAV flights have been
performed by the DiRecT Team (Disaster Recovery
Team), involving Aicardi, I. Boccardo, P. Chiabrando,
F. Donadio, E. Lingua, A. Maschio, P. Noardo, G.
Sammartano, F. Spanò.
REFERENCES
Balletti, C., 2006. Georeference in the analysis of the
geometric content of early maps. e-Perimetron 1(1), pp.
32-42.
Baiocchi ,V., Lelo, K., Accuracy of 1908 high to medium
scale cartography of rome and its surroundings and
related georeferencing problems,Acta Geodaetica et
Geophysica Hungarica, 2010, 45,1, 97-104.
Brovelli, M. A. Minghini, M. Zamboni, G. 2012.
Valorisation of Como historical cadastral maps
through modern web geoservices. ISPRS Annals, I-4,
pp. 287-292
Frasca F., 2004, Le attività degli ingegneri geografi
francesi nei territori italiani in età napoleonica,
Informazioni della Difesa, I.
Haala, N., Cramer, M., Weimer, F., Trittler, M., 2011.
Performance test on UAV-based photogrammetric data
collection. ISPRS Archives, Vol. XXXVIII-1/C22.
Livieratos, E., 2006. On the study of the geometric
properties of historical cartographic representation.
Cartographica 41(2), pp. 165-175.
Lowe, D., 2004. Distinctive Image Features from Scale-
Invariant Keypoints, Int. Journal of Computer Vision, Vol.
60, pp. 91-110.
Cosenza, P., Camerlynck, P., Tabbagh, A., 2003.
Differential effective medium schemes for investigating
the relationship between HF relative dielectric
permittivity and water content of soils. Water
Resources Research 39, 1230.
Davis, J.L., Annan, A.P., 1989. Ground-penetrating radar
for high resolution mapping of soil and rock
stratigraphy. Geophysical Prospecting 37, 531–551.
Friedman, S.P., 1998. A saturation degree-dependent
composite spheres model for describing the effective
dielectric constant of unsaturated porous media. Water
Resources Research 34, 2949–2961.
Reynolds, J.M., 1997. An Introduction to Applied and
Environmental Geophysics. John Wiley & Sons, NY.
Ricci Massabò, I, Carassi M., 1986, Amministrazione dello
spazio statale e cartografia nello stato sabaudo, in
MIBAC, Uff. Beni Archivistici, (ed), Cartografie e
Istituzioni di età moderna, Genova.
F. Rinaudo, F. Chiabrando, A. Lingua, A.T. Spanò. 2012.
Archaeological site monitoring: UAV photogrammetry
can be an answer. In: ISPRS, vol. XXXIX n. B5, pp.
583-588.
GISTAM 2016 - 2nd International Conference on Geographical Information Systems Theory, Applications and Management
90

Sen, P.N., Scala, C., Cohen, M.H., 1981. Relation of certain
geometrical features to the dielectric anomaly of rocks.
Geophysics 46 (12), 1714–1720.
Spano' A.; Bonora V.; M.C. Preacco, 2007, Geomatic
contributions to archaeological investigations.The case
of Torrione of Pollenzo (Piedmont – Italy), ISPRS
Archives, Vol. XXXVI-5/C53.
Szeliski R., 2011. Computer Vision: Algorithms and
Applications, Springer, London. pp. 181-207, 303-332.
Gathering GPR Inspections and UAV Survey in Cultural Heritage Documentation Context
91
