
Integrated Energy Efficient Data Centre Management for Green
Cloud Computing
The FP7 GENiC Project Experience
J. Ignacio Torrens
1
, Deepak Mehta
2
, Vojtech Zavrel
1
, Diarmuid Grimes
2
, Thomas Scherer
3
,
Robert Birke
3
, Lydia Chen
3
, Susan Rea
4
, Lara Lopez
5
, Enric Pages
5
and Dirk Pesch
4
1
Building Physics and Services, TU Eindhoven, Eindhoven, The Netherlands
2
Insight Centre for Data Analytics, University College Cork, Cork, Ireland
3
IBM Research – Zurich, Rüschlikon, Switzerland
4
Nimbus Centre for Embedded Systems Research, Cork Institute of Technology, Cork, Ireland
5
ATOS Spain SA., Madrid, Spain
Keywords: Energy Efficient Data Centres, Workload Management, Thermal Management, Integrated Energy
Management Platform.
Abstract: Energy consumed by computation and cooling represents the greatest percentage of the average energy
consumed in a data centre. As these two aspects are not always coordinated, energy consumption is not
optimised. Data centres lack an integrated system that jointly optimises and controls all the operations in order
to reduce energy consumption and increase the usage of renewable sources. GENiC is addressing this through
a novel scalable, integrate energy management and control platform for data centre wide optimisation. We
have implemented a prototype of the platform together with workload and thermal management algorithms.
We evaluate the algorithms in a simulation based model of a real data centre. Results show significant energy
savings potential, in some cases up to 40%, by integrating workload and thermal management.
1 INTRODUCTION
Data centres have become a critical part of modern
life with the huge penetration of software as a service,
mobile cloud applications, digital media streaming,
and the expected growth in the Internet of Everything
all relying on data centres. However, data centres are
also a significant primary energy user and now
consume 1.3% of worldwide electricity. With the
increasing move towards cloud computing and
storage as well as everything as a service type
computing, energy consumption is expected to grow
to 8% by 2020 (Greenpeace, 2011; Gao, 2012). While
data centres of large cloud service providers have
been consuming many megawatts of power with
corresponding annual electricity bills in the order of
tens of millions of dollars, e.g. Google with over
260MW and $67M and Microsoft with over 150MW
and $36M in 2010 (Qurush, 2010), the large cloud
service providers are also investing heavily in energy
efficiency and green data centres, e.g. Google and
Microsoft have invested over $900M in energy
reduction measures since 2010. However, smaller
operators and independent data centres have not yet
been able to deploy many of the energy efficiency
technologies that are available. This is due to lack of
integrated technology solutions and uncertainty about
costs and the use of renewable energy solutions.
On average, computing consumes 60% of total
energy in data centres while cooling consumes 35%
(Uptime Institute, 2011). New technologies have the
potential to lead to a 40% reduction of energy
consumption, but computation and cooling typically
operate without joint coordination or optimisation.
While server energy management can reduce energy
use at CPU, rack, and overall data centre level,
dynamic computation scheduling is not integrated
with cooling. Data centre cooling typically operates
at constant cold air temperature to protect the hottest
server racks while local fans distribute the
temperature across racks. However, these local server
controls are typically not integrated with room
Torrens, J., Mehta, D., Zavrel, V., Grimes, D., Scherer, T., Birke, R., Chen, L., Rea, S., Lopez, L., Pages, E. and Pesch, D.
Integrated Energy Efficient Data Centre Management for Green Cloud Computing - The FP7 GENiC Project Experience.
In Proceedings of the 6th International Conference on Cloud Computing and Services Science (CLOSER 2016) - Volume 2, pages 375-386
ISBN: 978-989-758-182-3
Copyright
c
2016 by SCITEPRESS – Science and Technology Publications, Lda. All rights reserved
375

cooling systems, which means that it is not possible
to optimise chillers, air fans and server fans as a
whole system.
The integration of renewable energy sources
(RES) has received limited interest from the data
centre community due to lack of interoperability of
generation, storage and heat recovery and current
installation and maintenance costs versus payback
(Deng, 2014). By and large, data centre operators,
who want to be green and use renewable energy buy
electricity that has been given a green label by their
respective supplier without often being able to fully
verify this. The intermittency of renewable energy
generation is also a critical factor in an environment
with very strict service level agreements and
essentially 100% uptime requirements. The adoption
of new technologies related to computing, cooling,
generation, energy storage, and waste heat recovery
individually requires sophisticated controls, but no
single manufacturer provides a complete system so
integration between control systems does not exist.
Funded by the European Commission, the GENiC
project (http://www.projectgenic.eu) develops
integrated cooling and computing control strategies in
conjunction with innovative power management
concepts that incorporate renewable electrical power
supply and waste heat management. The GENiC
project’s aim is to address the issue mentioned above
by developing an integrated management and control
platform for data centre wide optimisation of energy
consumption, reduction of carbon emissions and
increased renewables usage through integrating
monitoring and control of computation, data storage,
cooling, local power generation, and waste heat
recovery. The proposed platform defines interfaces
and common data formats, includes control and
optimisation functions and decision support. We aim
to verify the energy savings potential through
simulation based assessment and demonstration of
reduction in energy consumption through deployment
of the platform in a demonstration data centre. A
further premise of GENiC is that the energy
consuming equipment in data centres must be
supplemented with renewable energy generation and,
where possible, energy storage equipment, and
operated as a complete system to achieve an optimal
energy and emissions outcome. This vision is centred
on the development of a hierarchical control system
to operate all of the primary data centre components
in an optimal and coordinated manner.
In this paper we present the overall GENiC
system architecture for an integrated approach to
data centre management, discuss the first prototype
implementation, and present use cases and a
simulation based assessment of some of the energy
management algorithms. The paper is structured as
follows, Section 2 presents some challenges for data
centre energy management, the GENiC architecture
is presented in Section 3 and the prototype
implementation in Section 4. Section 5 introduces the
simulation models that represent a real physical data
centre and their boundary conditions. Section 6
presents the simulation flow and boundary
conditions. Section 7 presents and discusses
simulation results and Section 8 concludes the paper.
2 CHALLENGES IN DATA
CENTRE ENERGY
MANAGEMENT
Data centres have evolved into critical information
technology (IT) infrastructure and much of today's IT
services, both for businesses and consumers, depend
on their operation. Data centres consume an
increasing amount of energy and contribute
significantly to CO
2
emissions. However,
opportunities exist to enhance the energy and power
management of data centres in conjunction with
renewable energy generation and integration with
their surrounding infrastructure. Work has been done
on powering of data centres by renewable energy
(Cioara, 2015), but this has not been fully integrated
into a complete energy management system
considering coordinated workload management,
cooling, powering, and heat recovery management.
While much work has focused on integrated energy
management for data centres (Das, 2011; Jiang, 2015)
there is still a lack of an overall consideration of
energy usage and powering with the recovery of
waste heat as part of an overall thermal management
approach. In order to bring the elements of workload
management, cooling, powering and heat recovery
together in such a way that it will be possible to
achieve a high level of renewable energy powering of
data centres, a comprehensive integrated energy
management system is needed. The challenges that
such a system needs to address are
• Comprehensive, scalable integration of workload
management with cooling approaches.
• Effective power management with a high level of
renewable energy supply integration while
meeting service level agreements. For example,
managing service level agreements while dealing
with energy price fluctuations and demand
response requirements.
TEEC 2016 - Special Session on Tools for an Energy Efficient Cloud
376
• Strategies for waste heat recovery in conjunction
with the heating needs of surrounding areas.
• Design and decision support tools assisting data
centre operators with data centre energy
management. Effective monitoring and fault
management.
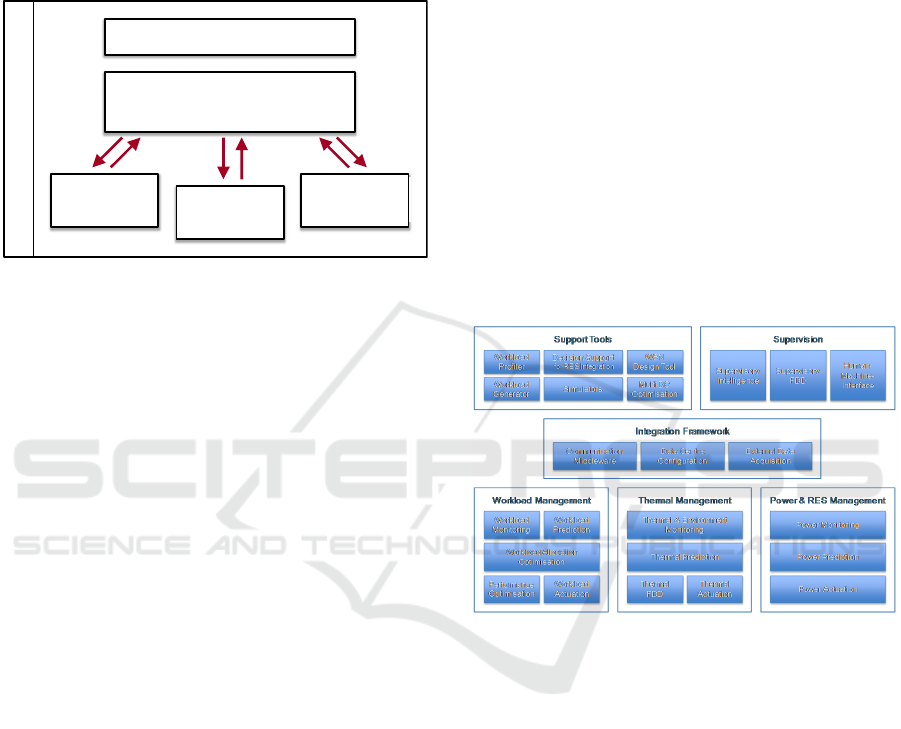
Figure 1: High level overview of the GENiC architecture
(from (GENIC, 2015)).
3 GENiC ARCHITECTURE
To address the challenges outlined above, the GENiC
project has developed a high level architecture for an
integrated design, management and control platform
(Pesch, 2015). This platform targets data centre wide
optimisation of energy consumption by encapsulating
monitoring and control of IT workload, data centre
cooling, local power generation and waste heat
recovery. In the following, a functional specification
of the GENiC architecture is presented and an
overview of the integration framework is provided.
More detailed information can be found in (GENIC,
2015).
The GENiC system integrates workload
management, thermal management and power
management by using a hierarchical control concept
to coordinate the management sub-systems in an
optimal manner with respect to the cost of energy
consumption and environmental impact, and cost
policies. Figure 1 provides a high level overview of
the proposed GENiC system architecture, which
consists of six functional groups known as GENiC
Component Groups (GCGs):
• The Workload Management GCG is
responsible for monitoring, analyzing, predicting,
allocating, and actuating IT workload within the
data centre.
• The Thermal Management GCG is responsible
for monitoring the thermal environment and
cooling systems in the data centre, predicting
temperature profiles and cooling demand, and
optimally coordinating and actuating the cooling
systems.
• The Power & RES Management GCG is
responsible for monitoring and predicting power
supply and demand, and for actuating the on-site
power supply of the data centre.
• The Supervision GCG includes the supervisory
intelligence which provides optimal IT power
demand, power supply, and thermal policies to the
individual sub-systems based on monitoring data,
predicted systems states, and actuation feedback.
• The Support Tools GCG includes a number of
tools that provide decision support for data centre
planners, system integrators, and data centre
operators.
• The Integration Framework GCG provides the
communication infrastructure and data formats
that are used for interactions between all
components of the GENiC system.
Figure 2: Components of the GENiC functional architecture
(from (GENIC, 2015)).
Each GCG is composed of a number of functional
components which we call GENiC Components
(GCs). The individual GCs are shown in Figure 2.
The core function of the GENiC system for
integrated, optimised data centre management can be
divided into four basic elements:
1. Monitoring components within the management
GCGs collect data about IT workload, thermal
environment, cooling systems, power demand and
on-site power supply.
2. Prediction components within the management
GCGs update their internal models and estimate
future system states based on the collected
monitoring data.
3. Optimisation components determine optimal
policies based on the collected monitoring data
Integration Framework
Workload
Management
Thermal
Management
Power & RES
Management
Supervision
Supervisory Intelligence
Support Tools
Integrated Energy Efficient Data Centre Management for Green Cloud Computing - The FP7 GENiC Project Experience
377
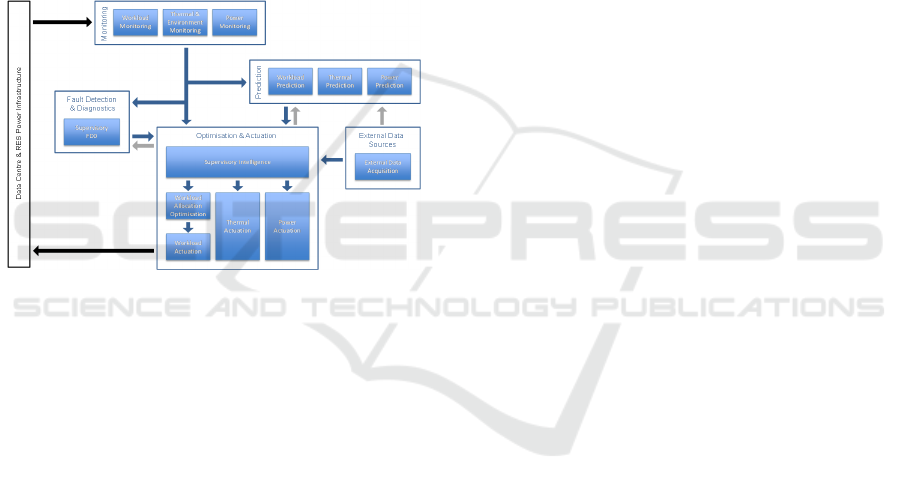
and calculated prediction data. These policies are
provided to the management GCGs
4. Actuation components within the individual
management GCGs implement the policies
provided by the optimisation components in the
data centre and at the renewable energy sources
facilities.
These elements are complemented by components
for external data acquisition and fault detection and
diagnostics. The basic information flow for
coordinating workload, thermal and power
management is illustrated in Figure 3. For the
simulation based assessment, the data centre and
power infrastructure in the loop are replaced with
their respective virtual models provided by the
Simulators GC.
Figure 3: Information flow (simplified) within the GENiC
platform for coordinating workload, thermal and power
management (GENIC, 2015).
In the following, we take a closer look at the
GCGs and their individual components:
Workload Management GCG: The primary
objective of this GCG is to allocate virtual machines
(VMs) to physical machines (PMs) such that service
level objectives (SLOs) are satisfied with low
operational cost. Monitoring data from the IT
resources deployed within the data centre is collected
by the Workload Monitoring GC. The Workload
Prediction GC uses this information to provide short-
and long-term predictions about the resource
utilization. The allocation and migration of VMs to
PMs is determined by the Workload Allocation
Optimisation GC, which solves a constrained
optimisation problem, taking the predicted workload
as well as constraints provided by the Supervisory
Intelligence GC, Thermal Prediction and
Performance Optimisation GC into consideration.
The Performance Optimisation GC defines
colocation and anti-colocation constraints for
individual VMs and modifies the individual VMs’
priorities to fulfil application specific SLOs. The VM
allocation plan is finally applied by the Workload
Actuation GC, which provides an interface to the data
centre specific virtualization platform.
Thermal Management GCG: The Thermal &
Environment Monitoring GC integrates monitoring
of cooling systems and wireless sensor network
infrastructure for collecting temperature and other
environmental data in the data centre room. The
collected data is used by the Thermal Prediction GC
to provide short-term and long-term predictions to
support supervisory control decisions, thermal
actuation and workload allocation. Long-term
predictions obtained with mathematical models are
used for making decisions at the supervisory level.
Short-term thermal predictions based on a discrete
time mathematical model are required by the Thermal
Actuation GC along with real-time sensor
measurements to determine optimal set points for the
cooling system in order to achieve the targets set by
the Supervisory Intelligence GC. These short-term
thermal predictions are also necessary input to the
Workload Allocation GC, as they include temperature
models for the thermal contribution of IT server
workload to the server inlets, and the Supervisory
Intelligence GC. Furthermore, short-term predictions,
combined with equipment fault information from the
Thermal Fault Detection & Diagnostics (FDD) GC,
are used for fault detection and diagnostics at the
supervisory level.
Power & RES Management GCG: The Power
Monitoring GC integrates monitoring of the RES
infrastructure for local energy generation and storage
and of the data centre power consumption. This data
is used by the Power Prediction GC to provide long-
term predictions to support supervisory control
decisions and power actuation. The Power Actuation
GC determines set points for the power systems based
on measured data, operational conditions, restrictions
and limitations and the power profiles provided by the
Supervisory Intelligence GC.
Supervision GCG: The Supervisory Intelligence
GC is responsible for the overall coordination of
workload, thermal, power management and heat
recovery. It considers power demand and supply, grid
energy price, energy storage model and determines
how much power should be supplied from the
electricity grid, RES and energy storage to minimize
energy cost/maximize RES/minimize carbon
emission accordingly over a given horizon. To this
end, it provides policies for the actuation components
in the Workload Management, Thermal
Management, and Power & RES Management GCGs
based on information from monitoring and prediction
TEEC 2016 - Special Session on Tools for an Energy Efficient Cloud
378
components. The Supervisory Intelligence GC
provides these high-level policies to the Management
GCGs for the purpose of guiding these component
groups towards the Supervisory Intelligence GC
strategy that has been chosen as a driver for current
data centre operations; the key strategies available for
selection are minimization of financial cost,
minimization of carbon emissions and maximization
of renewables. To detect and diagnose system
anomalies, the Supervisory FDD GC compares
predicted values with measurement data and collects
and evaluates fault information. In appropriate
situations, the Supervisory FDD GC informs the
Supervisory Intelligence GC when a deviation
becomes substantial enough to negatively impact
system operation so that mitigation action can be
taken by the platform until the fault has been
corrected. The Human-Machine-Interface GC
provides a framework for the user interfaces that
allow data centre operators to monitor and evaluate
aggregated data provided by the individual GCs.
Support Tools GCG: The GENiC platform
includes a number of tools to assist data centre
planners, system integrators and data centre
operators:
• The Workload Profiler GC consists of a set of
tools to capture application profiles that can be
used by data centre operators to improve
application performance.
• The Decision Support for RES Integration GC is
a tool for data centre planners to determine the
most cost-efficient renewable energy systems to
install at a data centre facility.
• The Wireless Sensor Network (WSN) Design
Tool GC is a tool to capture system and
application level requirements for data centre
wireless monitoring infrastructure deployments.
• The Workload Generator GC provides recorded
and synthetic VM resource utilization traces for
the simulation-based assessment of a GENiC
based system and its implemented algorithms and
policies.
• The Simulators GC supports the testing of
individual and groups of GCs as well as the
(virtual) commissioning of a GENiC platform
before its deployment in an actual data centre.
• The Multi Data Centre (DC) Optimisation GC is
tool that exploits the differences in time-zones,
energy tariff plans, outside temperatures,
performances of geographically distributed data
centres to allocate workload amongst them in
order to minimise global energy cost and related
metrics.
Integration Framework GCG: The
Communication Middleware GC provides the
communication infrastructure used within the GENiC
platform. The Data Centre Configuration GC uses a
centralized data repository to store all information
related to the data centre configuration, including
information on data centre layout, cooling equipment,
monitoring infrastructure, IT equipment, and virtual
machines running in the data centre. Finally, the
External Data Acquisition GC provides access to data
that is not collected by existing components,
including weather data, grid energy prices, and grid
energy CO
2
indicators.
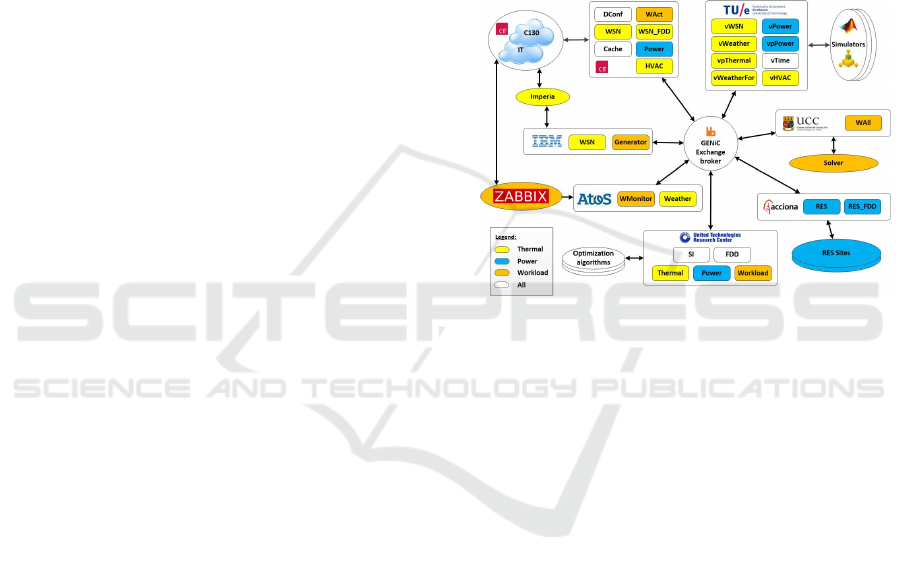
Figure 4: GENiC architecture implementation for
simulation based assessment.
4 GENiC PROTOTYPE
IMPLEMENTATION
Figure 4 illustrates a prototype implementation of the
GENiC architecture presented in Section 3. The
GENiC distributed architecture approach with clearly
defined interfaces simplifies integration of a diverse
set of software components from multiple
manufacturers and service providers. The architecture
is scalable, flexible and based on micro service
architecture principles.
A central element of the implementation of the
GENiC prototype is the use of the RabbitMQ
(RabbitMQ, 2015) messaging system for the GENiC
exchange broker. RabbitMQ provides a range of
client implementations in a wide range of
programming languages, which avoids
compromising the integrity of the overall platform.
The individual components are implemented as
individual services that communicate via the
RabbitMQ message broker. A generic client
architecture has been developed to allow each
component provider to expose their components in a
Integrated Energy Efficient Data Centre Management for Green Cloud Computing - The FP7 GENiC Project Experience
379
distributed manner in the GENiC platform. The
platform will be implemented in a real world demo
site, a data centre on the campus of Cork Institute of
Technology in Ireland (C130 DC), which has also
been modelled in the Simulators GC (see below). We
also use two renewable energy micro-grids that
provide data real-time data via the GENiC platform
on renewable energy generation capacity for the
simulation models.
In order to enable holistic optimisation of the data
centre energy consumption, the GENiC platform
implementation contains a monitoring systems to
guarantee that the information needed to optimise
workloads and thermal distribution is collected. The
monitoring components collect data with respect to IT
workload (generated by both physical and virtual
resources), thermal environment, cooling systems,
power demand and power supply (including
renewables). The correct monitoring of each
management group within the platform is essential to
properly operate the data centre.
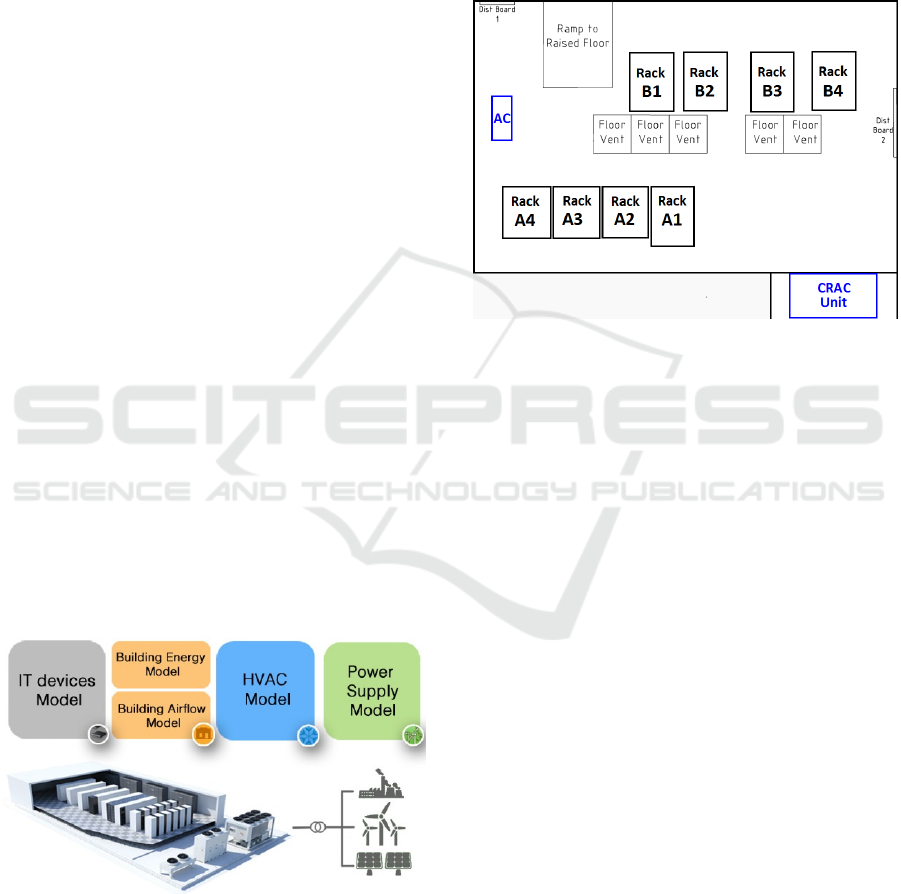
5 SIMULATION MODEL -
VIRTUAL C130 DATA CENTRE
GENiC has developed a Simulators GC, which is part
of the Support Tools GCG. The simulator component
includes energy models that emulate the performance
of a data centre and its systems, supporting the
development and testing of GENiC components (GC)
as well as the commissioning of the overall GENiC
platform, prior to its physical deployment in a real
data centre. The Simulators GC consists of the
following energy, space and system models as shown
in Figure 5:
Figure 5: Types of energy models in the Simulator GC.
Demand Side - Data centre space (Building
Energy Model + Building Airflow Model), IT devices
model, and Heating, ventilation and air conditioning
(HVAC) systems model
Supply Side - Power supply
The Simulator implements a virtual data centre
model used for this study that is based on the actual
GENiC demonstration site, the C130 data centre- at
CIT. The data centre room is cooled by one main
computer room air conditioning unit (CRAC) and one
backup air conditioning unit (AC) as illustrated in the
floor plan depicted in Figure 6.
Figure 6: Floor plan of the data centre room used for the
simulation based assessment.
5.1 IT Equipment and DC Whitespace
Characteristics
To emulate the server workload in the data centre, a
set of virtual machine (VM) configurations and the
VMs' resource utilization traces are required. The
traces used for this study have been collected from an
IBM data centre production environment and reflect
typical enterprise workload seen in a private cloud
environment. The traces comprise resource utilization
data for 2400 different VMs hosted on 132 servers.
The key parameters of these servers are summarized
in Table 1. The last column shows the number of
servers of each specific type. Each server's dynamic
power consumption is modelled as follows:
P
server
= (P
max
- P
idle
)·u + P
idle
,
where u is the CPU utilization, P
max
is the server's
power consumption at full load (i.e. u=1.0), and P
idle
is the server's power consumption at idle state (i.e.
u=0.0 The total power consumption of all 132 servers
is 24.5 kW if all of these servers operate at full load.
TEEC 2016 - Special Session on Tools for an Energy Efficient Cloud
380
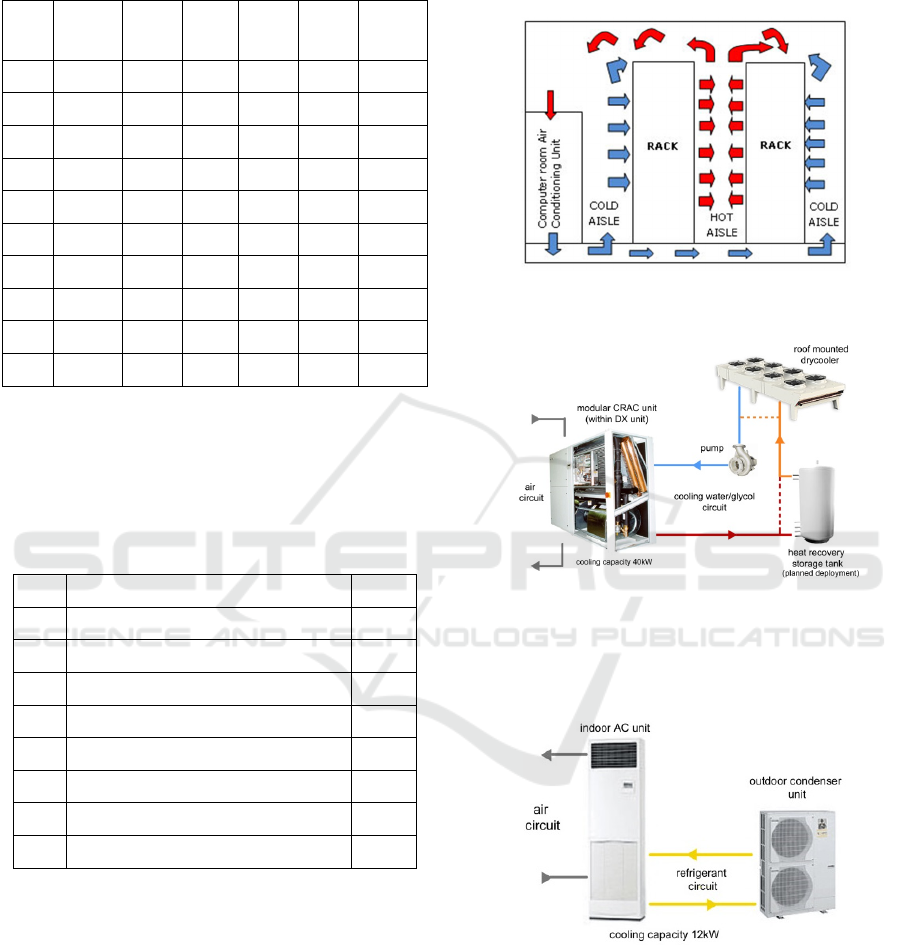
Table 1: Server parameters.
Type CPU
Size
CPU
Speed
Mem.
Max.
Power
Idle
Power
#
Servers
[vcores] [MHz] [GB] [W] [W]
S1 8 3'200 16 90 30 3
S2 8 3'200 32 95 35 8
S3 8 3'200 64 105 45 48
S4 12 2'000 64 130 70 2
S5 12 2'000 128 140 80 12
S6 12 2'000 256 160 100 23
S7 24 2'700 128 300 140 19
S8 32 2'000 128 400 270 14
S9 32 2'900 128 460 300 3
For the simulation based assessment, each server
has been mapped to specific rack slot in the virtual
data centre. Table 2 provides a summary of this
mapping.
Table 2: Mapping of servers to racks in the virtual data
centre.
Rack Servers (top to bottom) ∑P
max
A1 2
x
S5, 6
x
S3, 6
x
S6, 6
x
S8 4.3 kW
A2 no active equipment; patch panels only 0 kW
A3 10
x
S3, 6
x
S3, 3
x
S6, 4
x
S7, 2
x
S8 4.2 kW
A4 no active equipment; patch panels only 0 kW
B1 2
x
S4, 3
x
S1, 8
x
S3, 8
x
S7, 2
x
S5 4.1 kW
B2 4
x
S3, 2
x
S2, 4
x
S5, 5
x
S7, 2
x
S8, 3
x
S
3
3.8 kW
B3 4
x
S8, 4
x
S6, 7
x
S3, 4
x
S5, 4
x
S6 4.2 kW
B4 3
x
S9, 6
x
S6, 4
x
S3, 6
x
S2, 2
x
S7 3.9 kW
5.2 HVAC System Characteristics
The indoor environment of the DC is maintained at
18 - 27 ˚C with a relative humidity of 30-60% as
recommended by ASHRAE (ASHRAE, 2011). A
CRAC unit ensures the required indoor climate.
Supply air is distributed through a raised floor and
goes to front side of IT devices through floor-
performed tiles. Return air is drawn by the CRAC unit
below the ceiling (Figure 7).
The conditions of circulating air are controlled in
the CRAC unit by a direct expansion system. A
condenser coil of the direct expansion system is
cooled by glycol and heat is rejected to ambient in a
roof-mounted drycooler. The process and devices
involved are depicted in Figure 8.
Figure 7: Schematic of hot and cold aisle arrangements
without containments.
Figure 8: Main cooling system.
There is also an auxiliary floor standing air
conditioning (AC) unit placed in the room, as shown
in Figure 9.
Figure 9: Auxiliary air conditioning unit.
6 SIMULATION-BASED
ASSESSMENT OF ENERGY
MANAGEMENT
The simulation based assessment of the GENiC
energy management (EM) platform tests the
Integrated Energy Efficient Data Centre Management for Green Cloud Computing - The FP7 GENiC Project Experience
381
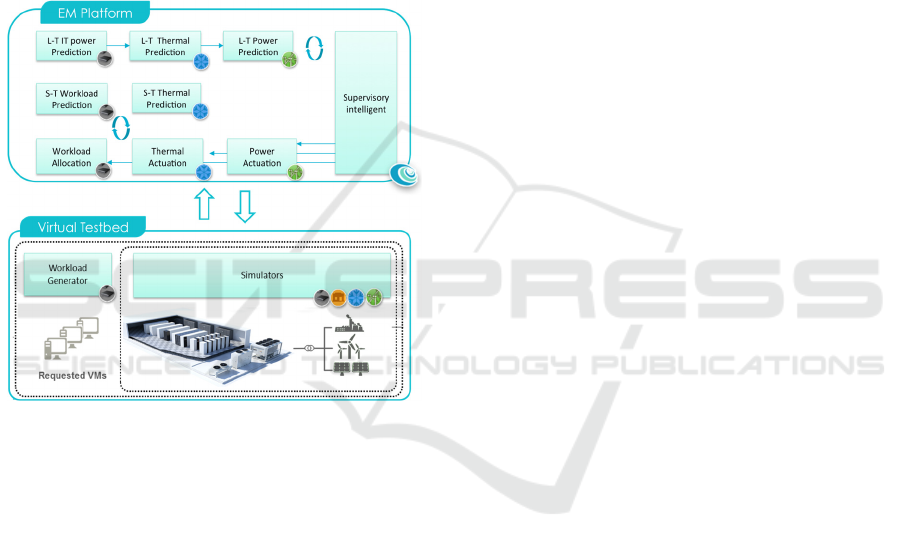
interaction of short-term (S-T) actuation and long-
term (L-T) decision making on a developed virtual
testbed that replicates the physical processes
occurring in the data centre facility. This interaction
and the components involved are shown in Figure 10.
A key component in all evaluations reported in
this paper (and shown in Figure 10 via the arrows
between components) is the Communication
Middleware GC, which provides the glue between all
the different GENiC components and enables
message exchange between components via the
RabbitMQ broker (see above). The details which
components are relevant to a particular evaluation are
discussed in the following.
Figure 10: Schematic of interaction between EM platform
GENiC components and Virtual Testbed.
6.1 Boundary Conditions for the
Simulation-based Assessment
All use cases are tested based on identical boundary
conditions so that the different operating strategies
can be compared to each other. The following
external factors are considered as boundary
conditions:
• Requested VMs are related with the type of
services and end-user behaviour.
• Electrical Grid Info is related with electricity
market and the ratio of RES (CO
2
emission factor)
in the grid.
• Weather conditions are specific to the DC
location.
• DC Operator Strategy represents the baseline
control strategy that establishes the reference
baseline to assess the energy management saving
potential.
6.2 Workload Management GCG
We test the Workload Allocation GC algorithm under
the following scenarios (experiments):
• Workload Allocation – VM migration limits
• Workload Allocation – Thermal preferences
The test with VM migration limits refers to the
testing of Workload Allocation GC with different
values for the maximum number of VM migrations
allowed per time period. The test with thermal
preferences refers to the testing of Workload
Allocation GC considering a static thermal server
preference. This experiment represents a thermal-
aware workload allocation strategy (Tang, 2007).
This experiment assesses the performance of the
Workload Allocation GC when it considers thermal
actuation preferences. For the simulation based
assessment, a static thermal preference matrix for
each of the servers is developed based on Supply Heat
Index (SHI) analysis (Sharma, 2002) of the C130 DC
white space from the baseline inputs.
These scenarios compare against each other and
against a baseline allocation strategy. This
comparison is assessed based on i) the thermal
behaviour in the white space (e.g. temperature
distribution, hot spots), and ii) energy consumption
6.2.1 GENiC Components Involved and
Testing Process
The GCs involved in this workload management
evaluation are a subset of those that form the
Workload Management GCG. The experiments for
this evaluation follow these steps:
1. The Simulators GCs publishes the virtual time
that will serve for the different GCs in the testing
loop to synchronise their actions.
2. The Workload Generator GC publishes the VMs
profile for the current time stamp
3. The Workload Allocation GC optimizes the
allocation strategy for the given arrangement in
the virtual C130 DC.
4. The Workload Allocation GC is able to consider
thermal priority for each box (where each box
represents one third of a rack). Static thermal
priority will be used to test a thermal awareness-
based workload allocation strategy.
5. The Sever Configuration component translates
VM allocation to power consumption per box
(1/3 of a rack).
TEEC 2016 - Special Session on Tools for an Energy Efficient Cloud
382

The Simulators GC captures all the data relevant
to this process for its analysis and post-processing.
The focus of this use-case it to analyse the influence
of workload allocation strategies in the temperature
distribution of the white space as well as in the total
DC energy consumption.
6.3 Thermal Management GCG
We tested the performance of the Thermal
Management GCG algorithms with optimal thermal
actuation. We will compare this scenario against a
baseline operation strategy. This comparison will be
assessed based on data centre energy consumption
and white space temperature.
6.3.1 GENiC Components Involved and
Testing Process
The GCs involved in this thermal management
evaluation are a subset of those that form the Thermal
Management GGCs. The experiments for the
Thermal Management evaluation follow these steps:
1. Virtual synchronization time and current white
space temperatures are published for the given
timestamp.
2. The S-T thermal prediction GC predicts the
thermal states of the white space for the next hour.
This prediction supports the decision making
process that takes place in the Thermal Actuation
GC
3. Optimal temperature set points for the CRAC and
AC units for the next timestamp are sent back to
the HVAC systems model part of the Simulators
GC
The Simulators GC captures all the data relevant
to this process for its analysis and post-processing.
The focus of this use-case it to analyse the influence
of S-T Prediction and Thermal Actuation strategies in
the temperature distribution of the white space as well
as in the total DC energy consumption.
6.4 Power Management GCG
The aim of this evaluation is to test the Power
Management GCG algorithms under the following
scenarios (experiments) – i) Power Actuation Logic,
and ii) Power Actuation Logic + SI static constraints
These scenarios will be compared against each other
and against the baseline operation. This comparison
will be assessed based on – i) energy demand vs
supply (Broken down per source)
6.4.1 Genic Components Involved and
Testing Process
The GCs involved in this use-case is a subset of those
that form the Power Management GGCs. The
experiments for the Power Management evaluation
follow these steps:
1. The Simulators GC generate the virtual time
stamp and the current status of power metering in
all equipment at the demand-side (DC) and at the
supply-side (on-site).
2. The Power Actuation GC generates optimal set
points for the electricity batteries and the ORC
plant for the next time step
3. The Power Actuation GC receives a power policy
(24h profile) from the Supervisory Intelligence
GC. A static SI constraint was used for the testing.
The Simulators GC captures all the data relevant
to this process for its analysis and post-processing.
The focus of this evaluation it to analyse the Power
Actuation operation strategies to satisfy the total DC
demand. The power actuation real time adjustments
are defined to assure the renewable energy supply
contribution, balancing the lack or excess of weather
dependent generation using the controllable unit
characterized with “unlimited” energy (kWh)
capacity which is the ORC that will never end the
energy capacity if the biomass storage is continuously
refilled. It has to be understood that electrical
batteries are characterised by limited energy capacity
(around 10 kWh) and limitations for the operation
according to the definition of FSoC (fractional state
of charge: between 0 and 1) upper and lower limits.
As stated before, according to the difference between
RES weather dependent units prediction and real
production, the ORC generation is adjusted taking
into account the upper and lower power available
referred to the maximum and minimum generation
capacity of the ORC (4kW minimum and 7 kW
maximum).
7 EVALUATION RESULTS
In the following we present in the first instance
evaluation results from the Workload Management
GCG. The simulation-based experimental setup
involved allocating workload over a 48 hour period in
a data centre using real VM resource utilization
traces. Each VM was initially assigned to the server
indicated in the real traces. Therefore the Workload
Allocator GC did not control the initial assignment
Integrated Energy Efficient Data Centre Management for Green Cloud Computing - The FP7 GENiC Project Experience
383
and could only influence power consumption through
VM migrations and server consolidation.
7.1 Workload Allocation – VM
Migration Limits
We first tested the impact of the migration limit on
the workload allocator (without thermal priorities for
servers). The baseline is a migration limit of 0, i.e.
each VM was run on the server it was initially
assigned to. We then tested various migration limits
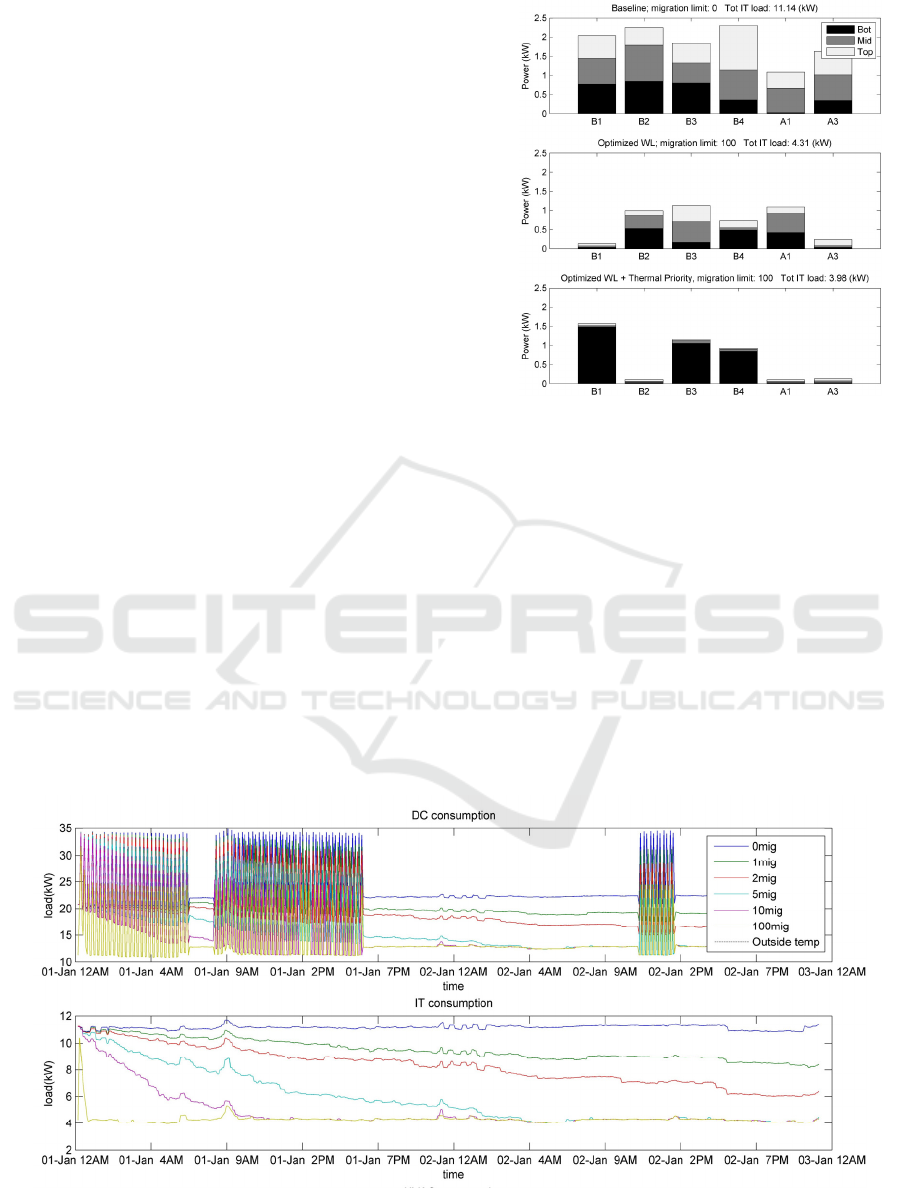
(from 1 to 100) as shown in Figure 11.
We observe that, as expected, increasing the
migration limit resulted in a reduction in power
consumption (see Figure 11). The largest migration
limit tested (100 migrations per 10 minute time
period) required just a few time periods to achieve a
reduction from approximately 11kW to just over
4kW. Indeed, the average hourly energy consumption
of the IT equipment was 6.71kWh less with a
migration limit of 100 than with the baseline.
The figure for IT power consumption (see Figure 11)
further illustrates that all positive migration limits
tended to this equilibrium state, with a migration limit
of 10 reaching the 4kW mark in less than 9 hours and
the limit of 5 requiring approximately 24 hours. Once
reached, the variations in power consumption
between the migration limits were minor. This means
that if the workload allocator had controlled the initial
assignment of VMs to servers, then a migration limit
of 10 or even 5 would have been sufficient to achieve
similar savings as with a limit of 100.
Figure 12: Workload distribution per third of rack.
7.2 Workload Allocation – Thermal
Preferences
The following experiments were performed under
identical settings to those previously discussed with
the exception that each server had an associated
thermal preference thereby allowing a proper ranking
of servers. The thermal preference was used to rank
the servers for consolidation.
In addition to the baseline described in the
previous section, we tested with and without thermal
preferences for migration limits of 10 and 100. The
experiments showed there to be little difference in the
total IT power consumption for the thermally ranked
Figure 11: Power consumption with different migration limits over 48 hour horizon.
TEEC 2016 - Special Session on Tools for an Energy Efficient Cloud
384
server consolidation, while HVAC energy
consumption was reduced by approximately 20kWh
over the 48-hour period relative to the baseline
approach, and by 6.5kWh compared to the scenario
with 100 migrations and no thermal preference.
The behaviour of the scenarios with thermal
preference can be better understood when analysed at
the third of rack level (top, middle and bottom boxes)
as shown in Figure 12. We observe that the only
servers used were the bottom level of three racks: B1,
B3, and B4. The loads from all the other servers were
migrated and the servers powered off, as can be seen
from the power value for the scenario with thermal
preference and limit of 100 migrations
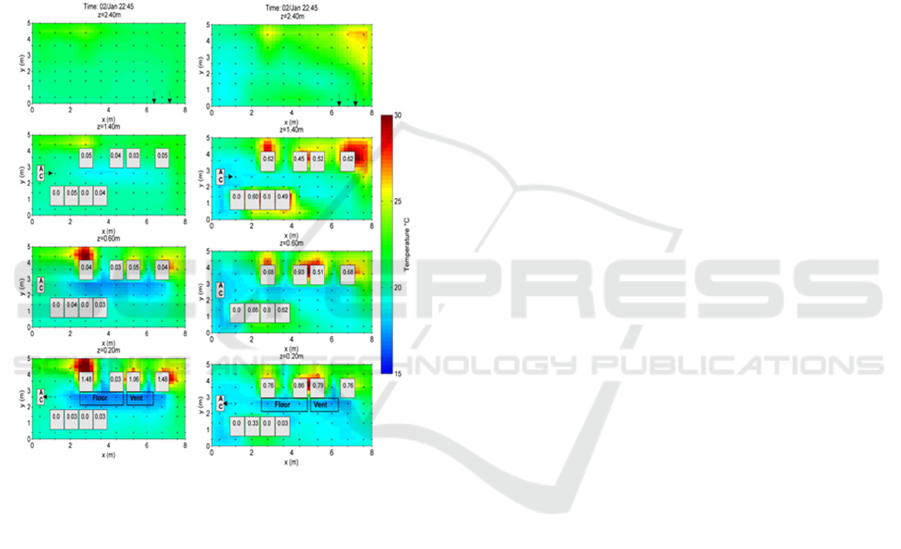
Figure 13: Temperature distribution for (a) thermal
preference and (b) baseline.
Finally, Fig. 13 presents the temperature
distribution of the DC for (a) the thermal preference
with 100 migrations and (b) the baseline. The baseline
study indicates risks of a hot spot at top layer of the
last rack in row B. The supply air temperature is
around 18°C, however the inlet temperature of the
particular box is approximately 23°C. The rise of
temperature is due to infiltration of hot air from the
hot aisle to the cold aisle space. The optimized
workload allocation with thermal preference scenario
ensures that the airflow will use the shortest path from
the cold air supply to the heat source. The cold air is
taken by preferable servers in the bottom boxes. The
typical cold aisle-hot aisle distribution can be
observed in this case. The inlet temperature of all
active servers is approximately 18°C.
8 CONCLUSIONS
In this paper we present and architecture for an
integrated energy management system for data
centres proposed by the FP7 GENiC project. The
proposed system combines optimisation of energy
consumption by encapsulating monitoring and
control of IT workload, data centre cooling, local
power generation and waste heat recovery. We also
present initial results from a simulation based
assessment of some of the energy management
algorithms. The initial simulation based assessment
was chosen by the project for a number of reasons.
Firstly, it allows to evaluate the performance of
management and control algorithms before
deployment in the real data centre space. Secondly,
the architecture of the platform is designed such that
the system interacts with the simulated data centre in
the same manner as it interacts with the components
in a real data centre, allowing also the testing and
commissioning of novel management and control
concepts before deployment in target space. The
specific algorithms developed in GENiC attempt to
optimise strategies focused on Workload, Thermal
and Power management in a data centre. The
optimisation occurs at different time horizons, short
term predictions are generated to support actuation
decisions that are made within each of the mentioned
Management groups, and long-term predictions
supporting decision making at the supervisory level
(coordinating Management groups). Here we have
focused on an initial analysis of workload and thermal
management techniques. The operation strategies
applied by the Workload Allocation GC prove
significant savings potential (of up to 40%) in terms
of total energy consumption. This reduction is
achieved through the optimization of the allocation
strategy of Virtual Machines (VMs) while switching
off unused servers. The performance of the Workload
Allocation GC shows a more effective utilization of
the DC with the same number of processed IT jobs.
In the final year of the GENiC project we will replace
the simulation environment by a real physical data
centre for the evaluation and demonstration of the
developed management algorithms and strategies in a
real world setting.
ACKNOWLEDGEMENTS
The authors acknowledge the contribution of the
whole GENiC consortium. We also acknowledge the
financial contribution of the EC under framework
programme contract no. 608826.
Integrated Energy Efficient Data Centre Management for Green Cloud Computing - The FP7 GENiC Project Experience
385

REFERENCES
Greenpeace. 2011. How Dirty is Your Data? A Look at the
Energy Choices that Power Cloud Computing.
Greenpeace Report. http://www.greenpeace.org/
international/en/publications/reports/How-dirty-is-
your-data/. May 2011.
Gao, P. X., Curtis, A. R., Wong, B., Keshav S. 2012. It's
Not Easy Being Green. Proc. ACM SIGCOMM,
Helsinki, Finland, pp. 211-222.
Qurush, A. 2010. Power-demand routing in massive geo-
distributed systems, Ph.D. thesis, MIT.
Uptime Institute, 2011. http://uptimeinstitute.com.
Deng, W., Liu, F., Jin, H., Li, B., Li, D. 2014. Harnessing
renewable energy in cloud datacenters: opportunities
and challenges. IEEE Network, vol. 28, no. 1, Jan-Feb
2014.
Cioara, T., Anghel, I., Antal, M., Crisan, S., Salomie, I.
2015. Data center optimization methodology to
maximize the usage of locally produced renewable
energy. Sustainable Internet and ICT for Sustainability
(SustainIT). Madrid, Spain, April 2015.
Das, R., Yarlanki, S., Hamann, H., Kephart, J. O., Lopez,
V. 2011. A unified approach to coordinated energy-
management in data centers. Proceedings of the 7th
International Conference on Network and Services
Management (CNSM '11), pp. 504-508.
Jiang, T., Yu, L., Cao, Y. 2015. Energy Management of
Internet Data Centers in Smart Grid. Springer Verlag.
Pesch. D., et al. 2015. The GENiC Architecture for
Integrated Data Centre Energy Management. in 1st Intl.
Workshop on Sustainable Data Centres and Cloud
Computing (in conjunction with IEEE UCC 2015).
Cyprus, December 2015.
GENIC. 2015. GENiC public deliverable D1.4 - Refined
GENiC Architecture. http://www.projectgenic.eu/
RabbitMQ. 2016. http://www.rabbitmq.com/
ASHRAE. 2011. TC 9.9 Thermal Guidelines for Data
Processing Environments – Expanded Data Center
Classes and Usage Guidance. Data Processing: 1–45.
Tang, Q., Gupta, S. K. S., Varsamopoulos, G. 2007.
Thermal-Aware Task Scheduling for Data Centers
through Minimizing Heat Recirculation. In Proc. IEEE
International Conference on Cluster Computing (ICCC
2007). Austin, TX, USA, Sept. 2007.
Sharma, R. K., Bash, C. E., Patel, C. 2002. Dimensionless
Parameters for Evaluation of Thermal Design and
Performance of Large-Scale Data Centers. In 8th
AIAA/ASME Joint Thermophysics and Heat Transfer
Conference. St. Louis, MO, USA, June 2002.
TEEC 2016 - Special Session on Tools for an Energy Efficient Cloud
386
