
Database Buffer Cache Simulator to Study and Predict Cache
Behavior for Query Execution
Chetan Phalak
1
, Rekha Singhal
1
and Tanmay Jhunjhunwala
2
1
Performance Engineering Research Center, Tata Consultancy Services, Andheri, Mumbai, India
2
Department of Mathematics and Computing, Delhi University, Delhi, India
Keywords: Database Buffer Cache, Data Blocks, Index Blocks, LRU, Simulator, Cache Hit, Cache Miss.
Abstract: Usage of an electronic media is increasing day by day and consequently the usage of applications. This fact
has resulted in rapid growth of an application's data which may lead to violation of service level agreement
(SLA) given to its users. To keep applications SLA compliance, it is necessary to predict the SQL query
response time before its deployment. The SQL query response time comprises of two elements, computation
time and IO access time. The latter includes time spent in getting data from disk subsystem and
database/operating system (OS) cache. Correct prediction of a SQL query performance needs to model
cache behavior for growing data size. The complex nature of data storage and data access pattern by queries
brings in difficulty to use only mathematical model for cache behavior prediction. In this paper, a Database
Buffer Cache Simulator has been proposed, which mimics the behavior of the database buffer cache. It can
be used to predict the cache misses for different types of data access by a SQL query. The simulator has
been validated using Oracle 11g and TPC-H benchmarks. The simulator is able to predict cache misses with
an average error of 2%.
1 INTRODUCTION
Cache plays a very crucial role in improving the
performance of any query/system. A good cache can
reduce I/O operations and lead to higher CPU
utilization. Accurately predicting the behavior of a
cache prior to the execution of a SQL query will
help us to predict the execution time and resources
that would be required. This paper is focused on
building database buffer cache simulator, which can
predict the behavior of the database buffer cache in
terms of cache misses on SQL query execution for
larger database size.
A cost based optimizer database provides an
execution plan of a query before its execution.
Execution plan shows different types of operations
occurred on tables participated in a query, for
example the Full Table Scan or Index Scan. Full
Table Scan accesses the data sequentially while the
Index Scan accesses data blocks using an index
created on one or more data field(s). Buffer cache
behavior for query execution strongly depends on
the type of data access and relative order of accessed
data. A query accessing data through index scan
require fetching of two types of blocks from storage
system. First data blocks that contains the address of
actual data and second, index blocks that contains
the address of associated data blocks.
Use of only mathematical model to simulate
working of the database buffer cache does not
capture the complexity in data access pattern. This
inability to create mathematical model forces the
adaption of programmatic approach. The proposed
simulator mimics the behavior of the database buffer
cache, which can be used to predict the cache misses
for different types of data access by a query. Both
data and index blocks are taken into account while
developing and validating the database buffer cache
simulator. Input to the simulator is various data
access patterns from the storage subsystem while
being transparent to the architecture of the storage
subsystem. The simulator provides database buffer
and OS cache hits, misses of blocks as output, which
is useful to judge the behavior of cache. Studying
the pattern of misses with respect to various data
patterns can lead to detection of miss reason and
optimization potentialities.
The simulator needs several inputs, which
include size of database buffer cache and OS cache,
numbers of rows reside in each data block, numbers
Phalak, C., Singhal, R. and Jhunjhunwala, T.
Database Buffer Cache Simulator to Study and Predict Cache Behavior for Query Execution.
DOI: 10.5220/0005936800710078
In Proceedings of the 5th International Conference on Data Management Technologies and Applications (DATA 2016), pages 71-78
ISBN: 978-989-758-193-9
Copyright
c
2016 by SCITEPRESS – Science and Technology Publications, Lda. All rights reserved
71

of indices reside in each index block, data storage
pattern on disk and data access pattern. The
simulator provides output in the form of buffer
cache misses and OS cache misses. The simulator
output is validated with actual cache misses
perceived by a query during its execution. The
validation is performed by comparing cache misses
collected from query execution plan with cache
misses obtained from the simulator. For validation
purpose, custom queries on TPC-H benchmark
schema are used. The simulator can predict cache
misses with an average 2% of prediction error.
This paper is organized as follows. Section 2
reviews the prior work on cache simulation. The
design of database buffer simulator is presented in
Section 3. It describes how database cache works,
how simulation works and types of data access
patterns which had been taken into account while
building the simulator. Section 4 follows with
elaboration of the validation process in simulation
along with its results. The conclusion is given in
Section 5. References are mentioned in last section.
2 RELATED WORK
Simulation is a well-established technique for
studying the computer hardware and predicting the
system performance. Over the years, many
simulation systems with the goal of providing a
general tool for such studies have been developed.
Several works have been carried out related with
operating system’s cache simulation (Tao and
Weidendorfer, 2004; Tao and Karl, 2006; Holliday,
1992; Sugumar and Abraham, June 1993). Jie Tao
and Wolfgang Karl have simulated cache in detail to
detect bottleneck, reasons of misses and
optimization potentialities (Jie and Wolfgang, 2006).
Rabin A. Sugumar and Santosh G. Abraham have
modified the OPT algorithm with variety and came
up with efficient algorithm using which miss
characterization can be performed via reasonable
simulation resources (Sugumar and Abraham, 1993).
Several methods for cache simulation have been
developed; for example, use of address reference
traces (Holliday, 1992), use of runtime
instrumentation of applications (Tao and
Weidendorfer, 2004).
Along with OS cache, lot of work in the past few
years has been carried out in web cache simulation
as well (Cárdenas et al., 2005; Cárdenas et al.,
2004). L.G. Cárdenas and team have developed new
techniques for proxy cache simulation (Cárdenas et
al., 2004). In addition, L.G. Cárdenas has also
proposed a proxy-cache platform to check the
performance of a web object based on the multi-key
management techniques and algorithms. The
proposed platform developed in a modular way,
which allows the implementation of new algorithms
or policy proposals in an easy and robust manner
(Cárdenas et al., 2005).
There has been work done in literature on
simulating functional behaviour of database buffer
cache however they do not simulate cache misses for
larger data sizes. Daniel Moniz and Paul Fortier
have done the simulation analysis of a real time
database buffer manager (Moniz and Fortier 1996).
The authors have analysed the buffer management
policies and presented two new algorithms for page
replacement. However, they have not focussed on
database cache hits and misses of data as well as
index blocks for larger data size. Rekha Singhal and
Manoj Nambiar has talked about estimation of IO
access time on larger data size for various disk
access patterns during SQL query execution, but
does not include the delay in IO access time due to
effect of cache behaviour on larger data size
(Singhal and Nambiar, 2013). The simulator
proposed in this paper is about deriving database
cache hits and misses depending on the data access
pattern, which is not been analysed earlier.
3 DATABASE CACHE
SIMULATION
When a query is executed on the database, to locate
and retrieve any row in any table, several access
paths can be used. For example, Full Table Scan,
Row-id Scans Operation, Index Scans. When
database server performs a full table scan, it reads
blocks sequentially, while for index scan it first
needs to get an address of data block from index
block, hence reads blocks randomly. Thus for each
row, two physical blocks are demanded. Both these
blocks are first looked in the database buffer cache
and otherwise demanded from the OS. The OS then
itself looks for the blocks in its own cache and if still
not found, fetches them from the disk or physical
storage by calling an I/O operation. An important
thing to note is that index blocks can store a much
larger number of indices than the number of rows
stored in a data block. This means that the
probability of repetitive access of an index block is
always significantly higher than the probability of
repetitive access of a data block.
The relative order of data access block and data
storage location impacts the cache behavior.
DATA 2016 - 5th International Conference on Data Management Technologies and Applications
72
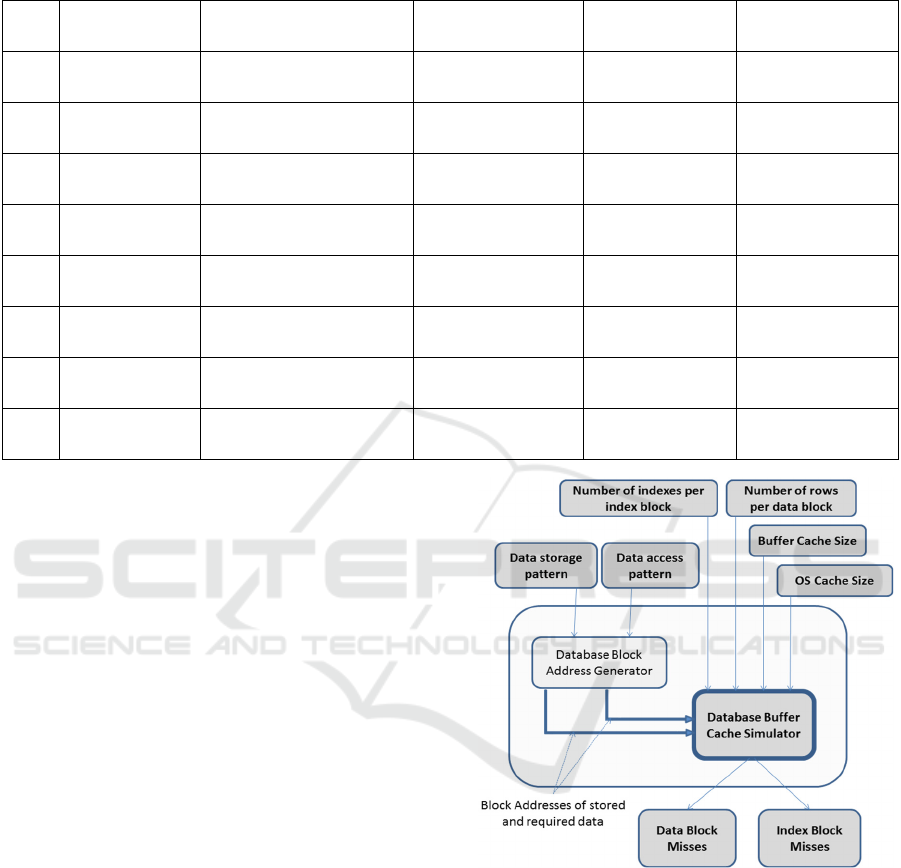
Table 1: Varieties of data access and storage patterns.
Sr. No. Data Access Pattern Data Storage Pattern Repetition in storage Sorting in storage Uniformity in storage
1 Ordered
Ordered
(1,2,3,4,5,6…)
NO YES YES
2 Ordered
Ordered
(1,1,1,2,2,2,3,3,3…)
YES YES YES
3 Ordered
Ordered
(1,1,2,2,2,2,3,3,4…)
YES YES NO
4 Ordered
Ordered
(1,2,3,4,1,2,3,4…)
YES (Range) YES YES
5 Ordered
Pseudo-random
(1,21,41,2,22,42,3…)
YES (Pattern) NO YES
6 Random
Random
(5,9,1,5,2,9,12,5…)
YES NO NO
7 Random
Ordered
(any order)
NO NO NO
8 Random
Random
(4,9,1,2,7,12,19,3…)
NO NO NO
Table 1 shows, few types of data access pattern,
data storage pattern along with their specifications.
Due to variation in data access patterns, sequence of
blocks demanded to cache is also variable; hence,
cache behaves differently for different data access
pattern. Though cache behavior is mainly depends
on data access patterns, there are few other
parameters which affect the cache behavior. The
parameter list includes size of database buffer cache
and OS cache. As cache is larger, it can
accommodate more blocks and this will reduce the
number of misses, hence number of misses is
inversely proportional to the cache size. Along with
these, number of rows reside in each data block and
number of indices reside in each index block is also
important. Though data block size is constant, due to
variable length of row in table, number of rows
reside in data block varies from table to table.
Similarly, number of indices reside in each index
block also depends on width and depth of the tree
structures used to store the particular index. As more
number of data rows corresponds to single block,
less number of misses will occur. Finally, data
storage pattern on disk and data access pattern also
affect the quantity of misses. Therefore, these six
parameters need to be provided as inputs to the
cache simulator. Moreover, we can judge the cache
behavior from buffer cache misses of data and index
blocks; hence, these will be outputs of the simulator
as shown in Figure 1.
Figure 1: Database Buffer Cache Simulator.
Initially, a mathematical approach had been tried
to develop a simulator. Inputs to a model, other than
data access pattern and storage pattern are single
number, which can easily be taken as input.
However, for patterns the mathematical function was
needed to be generated. Such functions were
generated for sorted and uniformly distributed data,
for e.g. pattern number 1, 2 and 4 in Table 1.
Nevertheless, incorporating all previously discussed
patterns resulted in complexity. Difficulties in
creating a mathematical model resulted in
elimination of this approach. Later, a programmatic
Database Buffer Cache Simulator to Study and Predict Cache Behavior for Query Execution
73

approach has been followed. Incorporating all
patterns mentioned in Table 1 can be fulfilled by
developing a code to build the simulator.
The aim of this simulation is to mimic the actual
working of a database cache. The first step is to
virtually realize a file system made up of blocks,
which will contain all the data. It has been achieved
by writing a function that will calculate block
number from the data value. As this functionality
was different for various data storage patterns,
unique functions were written for every data storage
pattern. The cache developed will fetch these blocks
when requested. Data stored in these blocks may
have some pattern or complete random fashion. The
next step is to build a cache on this file system that
follows the Least Recently Used (LRU) policy. This
requires a queue that maintains the blocks present in
the cache in the order by which they have been
accessed and moves them according the
specifications of LRU replacement policy. Linked
List was the best suitable option to implement cache
in this case. Various operative functions were
written to add, update and delete entry in Linked
List, means cache, to maintain LRU policy. The max
size of this queue is predefined; actually, this will be
buffer cache size. Along with it, we need to provide
simulator the number of data rows per data block
and number of keys per index block as input.
Number of data rows per data block was calculated
by dividing total number of rows of table by the
number of blocks used by same table while, number
of keys per index block was calculated by dividing
total number of rows in the index by the number of
leaf blocks in the same index. In Oracle, the values,
number of rows and blocks of table, were collected
from USER_TABLES view (USER_TABLES),
while number of rows and leaf blocks in the index
were collected from USER_INDEXES view
(USER_INDEXES). These views are generated and
maintained by Oracle itself. These values must be
read only after execution of gather statistics
command on the schema.
Once this cache is in place, it acts as a black-box
which takes all required inputs and gives output in
the form of block hits and misses. This black-box is
a very strong tool as any type of query, be it single
table, multiple table or even many simultaneous
queries running over many tables; any type of access
can be described as a block access order. Once this
order learnt accurately black-box is expected to map
this order to the exact number of hits and misses.
Thus, a major task is to build functions that convert
data access pattern in any query to a corresponding
block access pattern.
4 SIMULATION VALIDATION
This simulation validation was conducted on a Linux
machine, having 4GB RAM and 400GB SAN Hard
disk, using Oracle 11G and TPC-H benchmark. The
Simulator was developed in java using JDK 1.6
version on Windows 8 Platform.
The validation of simulation is carried out for
different custom queries as shown in Table 2. The
queries may require unique or repeated access,
ordered or random access, complete or partial
access. In addition, the storage order of the data
blocks may be variable. The data could be sorted or
random, it could be in single or multiple instances,
where these instances could be arranged in various
different fashions. Hence, for validation purpose
queries were selected, which consequently created
data access patterns described in Table 1. This list of
queries, mentioned in Table 2, generates first five
data access patterns described in Table 1.
In each case, it was made sure that the column
accessed has an index built on it. First, row-ids will
be fetched from this index block and then the exact
row will be returned. Furthermore, special focus was
on getting accurate results for the index hits and
misses. The task was to write the exact function that
will map the data elements to their corresponding
blocks. Then, the block access patterns returned to
the cache were fed to predict hits and misses. Along
with it, the exact query fired on an Oracle database
and the actual numbers of physical reads were noted
from the query plan. Comparisons of these numbers
Table 2: Varieties of data access and storage patterns.
Access Pattern Query
1 select /*+ index(orders pk_orders) */ o_custkey from orders where o_orderkey >0;
2 select /*+ index(ps pk_partsupp) */ * from partsupp ps where ps_partkey>=0;
3 select /*+ index(lineitem pk_lineitem) */ l_quantity from lineitem where l_orderkey>=0;
4 select /*+ index(s supp_nk) */ * from supplier s where s_nationkey>=0;
5 select /*+ index(ps partsupp_sk) */ ps_partkey from partsupp ps where ps_suppkey>=0;
(Note: First column of Table 2 corresponds to the serial number of first column of Table 1)
DATA 2016 - 5th International Conference on Data Management Technologies and Applications
74
can be used to calculate the error percentage. The
results, errors and possible reasons for the errors
have been discussed in the following sections.
4.1 Ordered Access and Data Storage
In this section, the first five access patterns
mentioned in Table 1 have been discussed. In these
cases, the location of each data element is precisely
known. It means that, all the blocks that need to be
fetched for every element are known. Hence, it was
easy to write the exact mathematical function to
mimic these access patterns.
For each of these patterns, the exact blocks
where each element is present are known. Thus, the
order in which blocks are going to be accessed is
known. This block access pattern can be fed to the
buffer cache simulator to predict the data and index
misses.
This validation was conducted on three data sizes
(see Table 3). Efficient synthetic data generator
(Phalak and Singhal, 2016) is been used to generate
data of various sizes. The simulator works almost
perfectly for all these patterns and negligible error
(approx 1%-2%) had been observed.
It can be seen from Table 3, a few errors are over
3%. However, these occur only when the data size is
very small and thus can be ignored. The other errors,
though very small, are arising because the number of
rows per block is taken as a constant number.
However, this number is actually the average
number of rows per block rounded off to the nearest
integer. For example, if this number comes out to be
43.458 for the customer table then, the simulator
will assume each block to contain 43 rows and will
predict the total number of blocks to be much greater
than the actual value. This is the reason behind the
1% to 2% error in the above validation.
4.2 Un-ordered Access and Unknown
Data Storage Order
The previous section shows that the cache simulator
can give excellent predictions, when it has
knowledge about the access pattern and data storage
pattern. In this section, the performance when data is
not accessed in any particular order or when it is not
stored on the disk in any particular order or both is
analyzed. In other words, it can be said that the
query will demand blocks in a pattern that is
completely random. At start, queries that randomly
access ordered data are considered.
For the first test case, a query that repeatedly and
randomly selects the entries in the custkey column of
customer table is designed. To achieve this, a nested
loop is forced on this column in the order of custkey
present in orders table. As orders table is 10 times
larger than the customer table each custkey will be
demanded 10 times. In addition, this table is sorted
by orderkey, thus, the custkey column is unsorted.
This is the case of a repeated random access on the
ordered data. It is simulated by generating random
numbers up to 10 times the range and then dividing
them by 10. Later, the calculated number fed to the
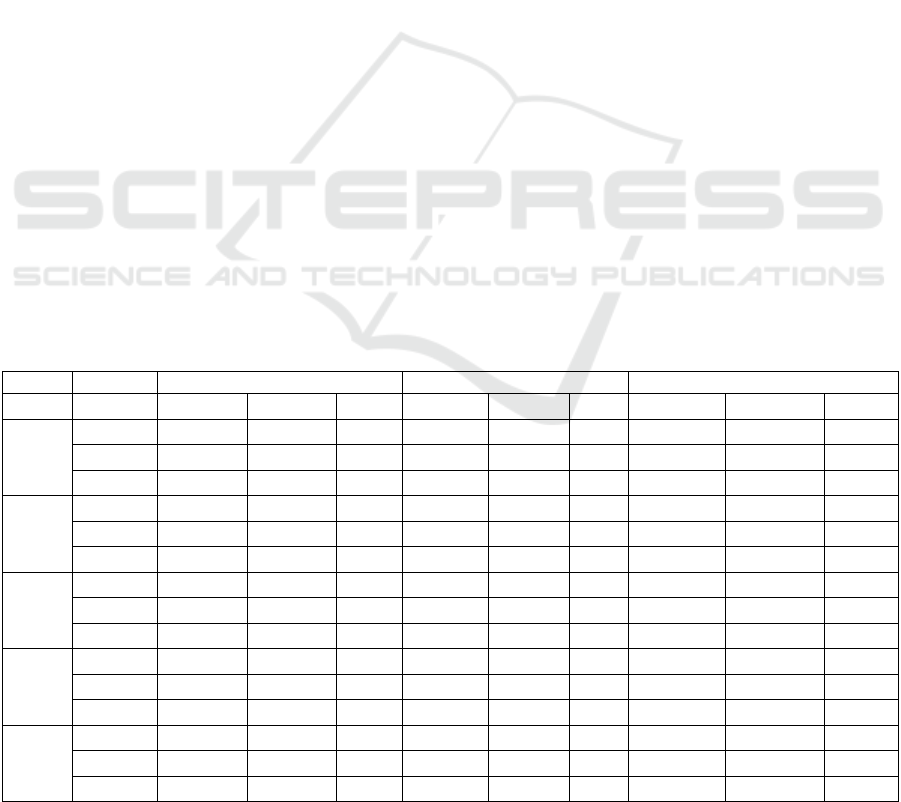
Table 3: Validation results for ordered access and known data patterns.
Pattern DB SIZE DB-MISS DB-index MISS OS-MISS
Predicted Actual Error Predicted Actual Error Predicted Actual Error
1
1GB 24194 24046 0.615 3304 3309 -0.15 439968 445280 -1.193
4GB 96775 95669 1.156 13334 13331 0.02 1761744 1771776 -0.5662
128GB 3147541 3132000 0.496 450705 451000 -0.07 57571936 57492768 0.1377
2
1GB 16667 16459 1.264 2111 2112 -0.05 300448 304968 -1.4821
4GB 66667 66135 0.804 8816 8811 0.06 1207728 1214248 -0.537
128GB 2133334 2137000 -0.172 302065 301000 0.35 38966384 39173264 -0.5281
3
1GB 109091 108245 0.782 15790 15755 0.22 1998096 2008648 -0.5253
4GB 436364 436585 -0.051 63493 63415 0.12 7997712 8041528 -0.5449
128GB 14222223 13875000 2.503 2127424 2125000 0.11 261594352 262564352 -0.3694
4
1GB 223 209 6.699 20 21 -4.76 3888 5744 -32.312
4GB 852 834 2.158 78 79 -1.27 14880 17340 -14.187
128GB 27235 26728 1.897 2496 2495 0.04 475696 476496 -0.1679
5
1GB 16667 16459 1.264 1674 1674 0 36682 37128 -1.2012
4GB 266748 263973 1.051 7033 7027 0.09 147400 164249 -10.258
128GB 8533416 8548000 -0.171 231152 231000 0.07 17529136 17588470 -0.3373
(Note: First column of Table 3 corresponds to the serial number of first column of Table 1)
Database Buffer Cache Simulator to Study and Predict Cache Behavior for Query Execution
75

cache after mapping to its corresponding block and
the results are shown in Table 4.
Table 4: Validation results of randomly accessed ordered
data.
DB SIZE TYPE Predicted Actual Error
128 GB
DB-MISS 160659873 170000000 -5.49
DB-index MISS 36878380 6616000 457.4
From Table 4, it can be seen that prediction of
index misses is erroneous with huge margin. What
could be the reason of such large error?
4.2.1 Skewness in Data
After the study of custkey column in orders table, it
can be seen that custkey columns entries are highly
skewed. They are not even close to being uniform as
in the assumption during the simulation. It was
assumed that each custkey must occur exactly ten
times at some random places in the orders table. The
truth however is that one-third of the total number of
custkeys is not even present in this column!
Furthermore, the custkeys which are present are not
uniformly repeated as well with their repetition
ranging from 1 to 25. It is a perfect example of a
highly skewed data, i.e. data where certain elements
in the range are more frequent than others.
It is a well-known fact that caches perform much
better, if there is even a slight amount of skew in the
data. This is because if there are some blocks that
are more frequently accessed than others, then there
is a higher chance of them being in the cache and
causing cache hits. Whereas if the data is completely
uniform, then all the blocks compete for a position
in the cache leading to much lower cache hits. This
effect on index blocks is much higher as each block
store large number of indices. Thus, the skewness in
data blocks gets magnified for index blocks.
Therefore, the reason of difference between
predicted results and that of the actual ones is that a
highly skewed data is assumed to be uniform. As
expected, the simulation returned much higher
number of misses than what actually were observed.
To confirm this, the next test case was taken, where
the data actually was accessed uniformly.
In this test case, the orderkey column in lineitem
is accessed in a random order. To achieve this, the
oracle (with help of hints) is forced to select
orderkey from orders table by taking a hash join of
custkey columns in customer and orders table. This
returns all the orderkeys exactly once but in a
random order. Then, the oracle is asked to select
orderkey from lineitem in this order. The exact
query:
select /*+USE_NL(l) ORDERED
USE_HASH(c o) */ c.c_custkey,
c.c_name,o.o_totalprice,l.l_return
flag, o.o_orderkey from customer
c, orders o, lineitem l where
o.o_orderkey=l.l_orderkey and
c.c_custkey = o.o_custkey;
In the code, it is simulated by using a random
number generator to return a random value of
orderkey. This value is converted into its
corresponding blocks and then given as an input to
the simulator. The results are shown in Table 5.
As expected, the predictions are much closer to
the actual values, especially in the case of index
misses. This was expected as index hit rates are the
ones that are highly affected by any kind of skew in
the data. However, the error is still very high and
there must be more factors to be understood.
4.3 Order in Randomness – Pseudo
Randomness
The next major source of error comes from the fact
that every random sequence is unique in itself and
cannot be equivalent to the other. This is because
after any random sequence is being generated it is
always possible that there are some hidden
undetectable patterns running through it. Thus, there
is no magnitude that can be associated with
randomness and all random patterns are actually
pseudo random.
Table 5: Validation results of randomly accessed ordered
data (Uniformly distributed data).
DB SIZE TYPE Predicted Actual Error
128 GB
DB-MISS 195799034 182000000 7.582
DB-index MISS 183175650 103000000 77.84
In the last test case, the random order in which
lineitem table is accessed can be derived from the
hash join between two other tables. The random
order, used for simulation is obtained from an
algorithm that makes use of the random number
generator, which is inbuilt in the java. Thus, these
two sequences, though both random, cannot be
assumed to be equivalent. The process of hash join
is giving rise to certain internal patterns, patterns
that can never arise from the entirely different
algorithm that the java inbuilt random number
generator uses. Thus, assuming these two to be
equivalent is also one of the sources of the error we
DATA 2016 - 5th International Conference on Data Management Technologies and Applications
76
observed. Again, the effect is more on index blocks
as any pattern in data access will give rise to a more
compact pattern in index access.
To verify the entire idea, the next test case is
considered where there is random access to
randomly arranged data. This is with the hope that
any patterns left after the hash join will be destroyed
now when they are mapped to their corresponding
block. For this, a hash join between partkey columns
in part and partsupp table is taken. This returns all
the partkeys in some random order. These partkeys
are mapped to the partkey column in lineitem table
in the same order with the help of a forced nested
loop. As lineitem is sorted by the orderkey column,
the partkey column is arranged completely
randomly. Thus, in this case there is random access
on randomly arranged data. For simulating this
query, first a random number generator is used to get
the order of access. Then another generator is used
to determine the location of the data requested in the
table. This location is divided by block size to get
the block in which it is present, which is given as
input to the cache. The results obtained are displayed
in Table 6.
Table 6: Validation results of randomly accessed random
distributed data.
DB SIZE TYPE Predicted Actual Error
4 GB
DB-MISS 18871831 19000000 - 0.675
DB-index MISS 710390 645000 10.1
As seen, the error has now gone down from
77.8% to 10.1% for index blocks and from 7.5% to
0.6% for data blocks. Thus, the thinking that there
must be some hidden patterns in the random
sequence returned by hash join was probably
correct. Mapping that sequence to another random
pattern may have lead to reduction in its impact on
cache hits. In all, it can be concluded that different
random sequences can lead to very different
response from the cache.
To see this practically, a little change is made in
the way the random block of any element was
calculated. A random number generator used to
determine the element location. However, to get the
corresponding block the modulus of this number is
calculated with the total number of blocks. The
sequence now generated is also a random sequence
and is fed into the cache. Table 7 describes the
results.
Table 7: Validation results of randomly accessed data with
known location.
DB SIZE TYPE Predicted Actual Error
4 GB
DB-MISS 17899324 19000000 -5.793
DB-index MISS 705675 645000 9.41
It can be seen; there is significant change both in
the data and index misses predicted. This shows that
the choice of an algorithm for generating the
required random sequence can have an impact on the
accuracy of the predicted result. It is required that a
random sequence must be chosen which would be
closest to the one actually generated. This task is
difficult and sometimes impossible, as many local or
global patterns may exist in the access patterns
which are unknown. This is the shortcoming of this
simulation that without proper information about
block access pattern, approximating it is difficult
and sometimes impossible.
However, expecting the simulator to work on
random queries is like expecting the correct answer
without giving out the proper problem statement! On
the better side, it can be concluded that once proper
information about the type of access is known, the
proposed cache simulator will give almost 100%
accurate results. To show this practically, one last
validation was carried out. Here, the exact order of
access is extracted from a query and then given to
the simulator. Now that the code knows the exact
random order in which the table was accessed
accurate predictions are expected about the hits and
misses for both data and index blocks. This same
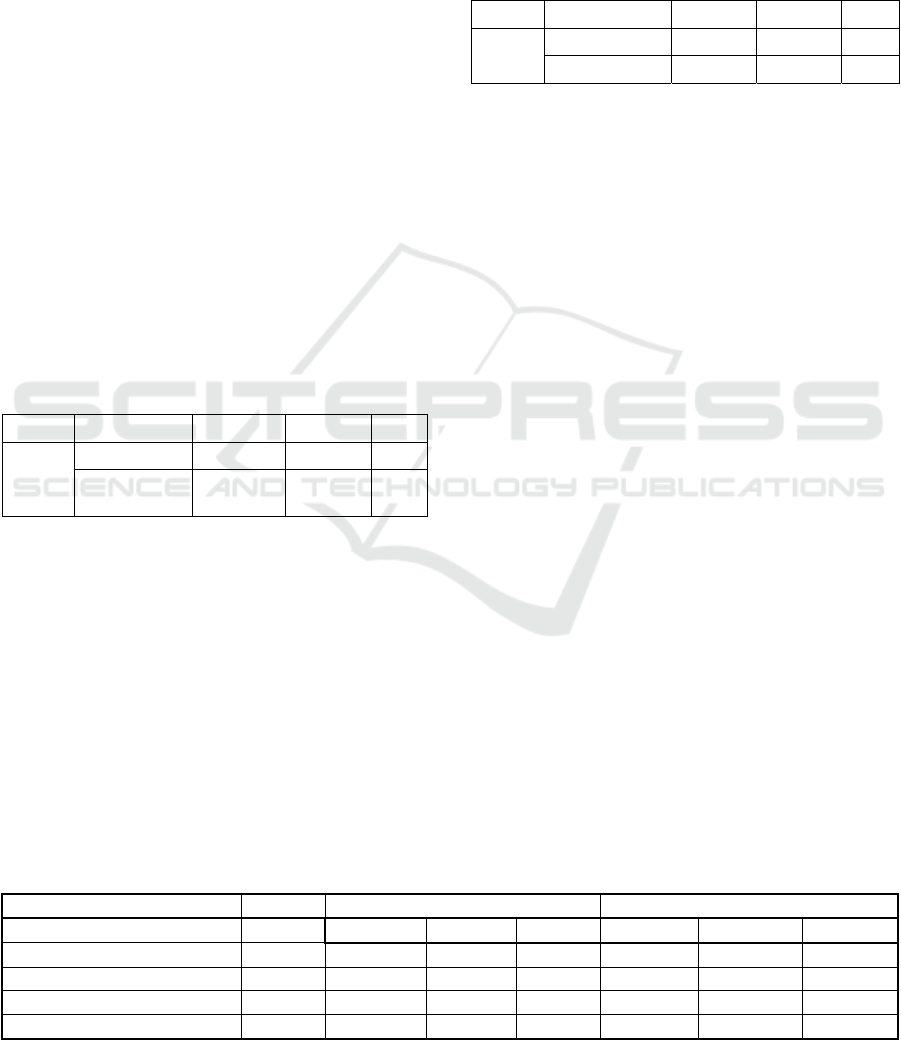
process was carried out on four different tables. The
results are shown in Table 8.
Thus, proposed cache simulator has handled the
case of random access accurately. This accuracy is
possible because the simulator has knowledge of the
exact order of access of the rows in table.
Table 8: Validation results of randomly accessed data with exact known location of blocks.
Query type DB SIZE DB-MISS DB-index MISS
Predicted Actual Error Predicted Actual Error
12345678… 1GB 24194 23963 0.964 3304 3313 -0.27
exactly 11112222…. 1GB 16667 16400 1.628 2111 2115 -0.19
almost 11112222… 1GB 550421 546000 0.81 16301 15880 2.65
appox. 1234512345… 1GB 3334 3413 -2.315 300 294 2.04
Database Buffer Cache Simulator to Study and Predict Cache Behavior for Query Execution
77

Hence it is safe to state that errors observed in
the other test cases, where randomness was
involved, arise only due to lack of information about
the ‘kind’ of random pattern being dealt with. Once
this gap is filled, the simulator definitely gives
accurate results for any type of query.
5 CONCLUSIONS
A simulator is discussed to mimic the behavior of
buffer cache during query execution. It is used to
predict cache misses perceived by the query
execution on a given data size. Various types of data
access and storage patterns are discussed which
plays a significant role in deciding the cache misses.
The cache simulator built, works with negligible
errors for the cases, where we have complete
information about the query access pattern and the
data distribution pattern. In these cases, approximate
2% error prediction was observed. Hence, the
simulator can handle any query as long as most of
the dynamics of the query are known. In case of
random queries, where we have no information
about data access and distribution pattern, the
simulator has difficulty in making predictions, thus,
simulator cannot be used for such queries. The error
that arises from this lack of information is higher in
magnitude for index blocks than for data blocks.
REFERENCES
Tao, Jie and Weidendorfer, Josef 2004. ‘Cache Simulation
Based on Runtime Instrumentation for OpenMP
Applications Reasoning about naming systems’,
Proceedings of the 37th annual symposium on
Simulation, pages 97-104.
Tao, Jie and Karl, Wolfgang 2006. ‘Detailed Cache
Simulation for Detecting Bottleneck, Miss Reason and
Optimization Potentialities’, Proceedings of the 1st
international conference on Performance evaluation
methodologies and tools, Article No. 62, ACM
1-59593-504-5/06/10.
Cárdenas, LG, Gil, JA, Domènech, J, Sahuquillo, J and
Pont, A 2005, ‘Performance Comparison of a Web
Cache Simulation Framework’, Proceedings of the
19
th
international conference on Advance Information
Networking and Applications, Pages 281-284, vol 2.
Cárdenas, LG, Sahuquillo, J, Pont, A and Gil, JA 2004,
‘The Multikey Web Cache Simulator: a Platform for
Designing Proxy Cache Management Techniques’,
Proceedings of the 12th Euromicro Conference on
Parallel, Distributed and Network-Based Processing,
Pages 390-397.
Holliday, Mark 1992, ‘Techniques for Cache and Memory
Simulation Using Address Reference Traces’,
International Journal of Computer Simulation.
Available from: https://www.researchgate.net/
publication/2811661_Techniques_for_Cache_and_Me
mory_Simulation_Using_Address_Reference_Traces.
Sugumar, Rabin and Abraham, Santosh June 1993,
‘Effective Simulation of Caches under Optimal
Replacement with Applications to Miss
Characterization’, Proceedings of the 1993 ACM
SIGMETRICS conference on Measurement and
modelling of computer systems, Pages 24-35.
Moniz, Daniel and Fortier, Paul 1996, ‘Simulation
analysis of a real-time database buffer manager’,
Proceedings of the 29th Annual Simulation
Symposium, Pages 252-259.
Phalak, Chetan and Singhal, Rekha November 2016,
‘Efficient Synthetic Data Generator for structured
Data’, Proceedings of CMG imPACT 2016.
Singhal, Rekha and Nambiar, Manoj November 2013,
‘Measurement Based Model to Study the Affect of
Increase in Data Size on Database Query Response
Time’, Proceedings of the Performance and Capacity
CMG 2013.
USER_TABLES. Available from: http://docs.oracle.com/
cd/B12037_01/server.101/b10755/statviews_2666.htm
USER_INDEXES. Available from: http://docs.oracle.com/
cd/B14117_01/server.101/b10755/statviews_2534.htm
DATA 2016 - 5th International Conference on Data Management Technologies and Applications
78
