
How Are We Connected?
Measuring Audience Galvanic Skin Response of Connected Performances
Chen Wang
1
, Xintong Zhu
1
, Erik Geelhoed
2
, Ian Biscoe
2
, Thomas Röggla
1
and Pablo Cesar
1,3
1
Centrum Wiskunde & Informatica, Science Park 123, Amsterdam, Netherlands
2
Falmouth University, Treliever Road, Penryn, U.K.
3
Delft University of Technology, Mekelweg 2, Delft, Netherlands
Keywords: Performing Arts, Audience Engagement, Galvanic Skin Response.
Abstract: Accurately measuring the audience response during a performance is a difficult task. This is particularly the
case for connected performances. In this paper, we staged a connected performance in which a remote
audience enjoyed the performance in real-time. Both objective (galvanic skin response and behaviours) and
subjective (interviews) responses from the live and remote audience members were recorded. To capture
galvanic skin response, a group of self-built sensors was used to record the electrical conductance of the skin.
The results of the measurements showed that both the live and the remote audience members had a similar
response to the connected performance even though more vivid artistic artefacts had a stronger effect on the
live audience. Some technical issues also influenced the experience of the remote audience. In conclusion we
found that the remoteness had little influence on the connected performance.
1 INTRODUCTION
One-Way delivery of live theatre performances to
cinemas or other theatres is a relatively recent
phenomenon, as well as still relatively small-scale.
However, it has already been a commercial success
for well-funded companies using expensive and not
readily available infrastructure (e.g. satellite
communication). For example, the National Theatre
in UK often applied NT Live technology to broadcast
live performances to digital cinemas (Bakhshi et al.,
2010). The long-term vision is that over the next few
years, smaller companies will follow suit to reach
wider audiences beyond their local community. In
addition, we foresee the development of the
technology to enable remote audiences to play a much
bigger role during live performances. Remote
audiences may interact with performers across space
and provide feedback, promoting a sense of audience
community on a larger scale.
A number of previous studies focused on how to
enable connected performances, and how to better
engage the audience (Sawchuk et al., 2003; Sheppard
et al., 2008; Yang et al., 2006). However, audience
response to connected performances has only been
investigated in a few papers. Our study was
conducted to better understand the effect of
remoteness on audience experience during a
connected theatre performance. This is a first step in
evaluating audience response to connected
performances. This paper aims to address the
following research question:
How does remote real-time watching compare to
being at a performance in person?
To answer this question, an experiment in highly
realistic conditions was conducted. Together with a
small theatre company, exploratory work was done
on synchronous watching (live streaming) of one
theatre play, which was called “Styx Boat on the
River”. It was staged at the University of Falmouth in
Falmouth, United Kingdom. The performance was
live streamed to another studio located at the same
building, which meant that the audiences at the two
locations watched the same performance at the same
time (Figure 1 and Figure 2). The experience of the
audience was captured by galvanic skin response
(GSR) sensors, video recordings, and interviews.
The remainder of this paper is structured as
follows: The next section is a review of recent
relevant research work, highlighting the novelty of
our contribution. Then, the methodology employed
during the experiments is described and the results are
analysed. A discussion concludes the paper.
Wang, C., Zhu, X., Geelhoed, E., Biscoe, I., RoÌ
´
Lggla, T. and Cesar, P.
How Are We Connected? - Measuring Audience Galvanic Skin Response of Connected Performances.
DOI: 10.5220/0005939100330042
In Proceedings of the 3rd International Conference on Physiological Computing Systems (PhyCS 2016), pages 33-42
ISBN: 978-989-758-197-7
Copyright
c
2016 by SCITEPRESS – Science and Technology Publications, Lda. All rights reserved
33
2 RELATED WORK
Having an exhaustive overview of the previous
studies regarding audience experience of theatre
performances is beyond the scope of this paper; the
interested reader can consult the following surveys
(Bennett, 2013; Reason, 2010). A review of the most
relevant works is conducted in the following areas:
audience response in performing arts and
measurement of audience response.
2.1 Audience Response in Performing
Arts
In the broadest sense, audience response can be
considered as feedback to a stimulus coming from
several users, participants, or players (Mandryk, 2004;
Chanel et al., 2008; Lunn and Harper, 2010).
Different applications define audience response
depending on the requirements of the application.
Using an online environment as an example, O’Brian
and MacLean (2009) regarded audience response as
the perceived usability, aesthetics, focused attention
and involvement felt.
In other specific application areas like video
watching or theatre performances, audience affective
states or emotions were also used to define audience
response (Ruan et al., 2009; Sauro and Lewis, 2012).
According to most psychological models, affective
state or emotion includes two dimensions: valence
and arousal (Russell, 1980; Bradley et al., 1992;
Posner et al., 2005). Arousal has been commonly
used to represent audience experience during theatre
performance (Dmochowski et al., 2014; Latulipe et
al., 2011; Wang et al., 2014). For example, Latulipe
and her colleagues (2011) measured both the self-
reported arousal and the physiological arousal of an
audience member during a recorded performance.
They found that the audience self-reports were
positively correlated with the audience physiological
arousal.
However, previous studies about audience
response in the domain of performing arts have been
conducted at only one location. For example,
Radbourne et al., (2009) conducted a study to
investigate the differences in audience response
between a live music event and a theatre performance.
This study did not find any significant difference.
For connected performances, as mentioned above,
researchers focused on technical issues, like how to
support a connected performance (Yang et al., 2006;
Sheppard et al., 2008)) and performance issues, like
how to design a high quality connected performance
(Gonzalez et al., 2012). For example, Sheppard et al.,
(2008) and Yang et al., (2006) explored connected
dance using a 3D virtual room, where dancers could
interact with each other. Furthermore, in these
studies, even though audience response during the
performance was recorded, it was only a tool for
evaluating the quality of their technologies. So they
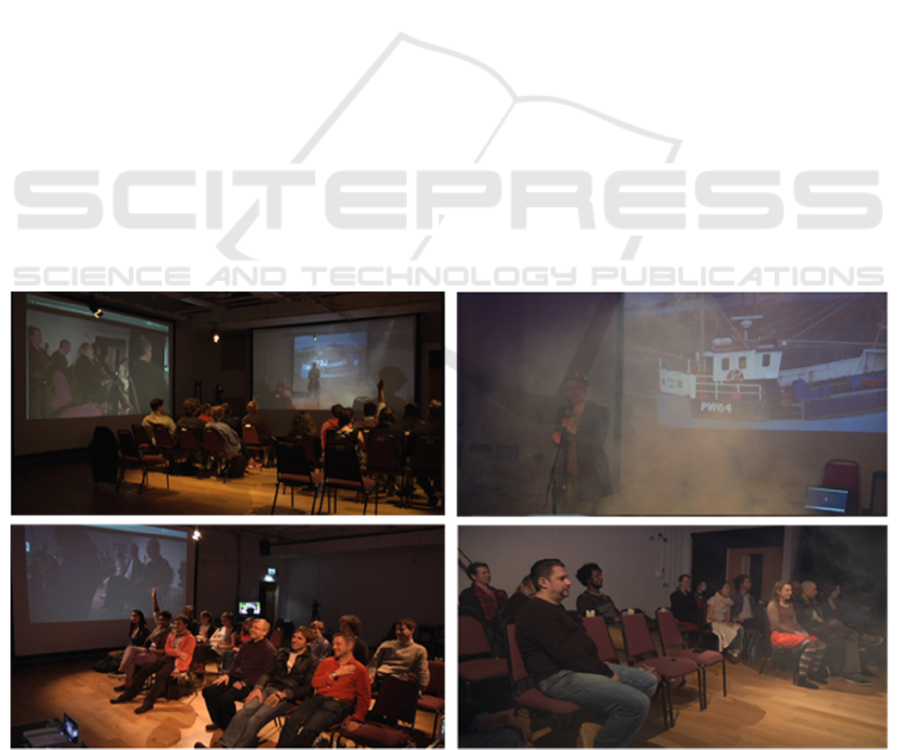
Figure 1: The performance: the two photos on the left show the remote location (the performance and the live audience were
both displayed on the big screens (top) and the remote audience actively interacted with the actor (bottom)); two photos on
the right were taken at the live location (the artist with special effect smoke (top) and the audience watching the play (bottom)).
PhyCS 2016 - 3rd International Conference on Physiological Computing Systems
34
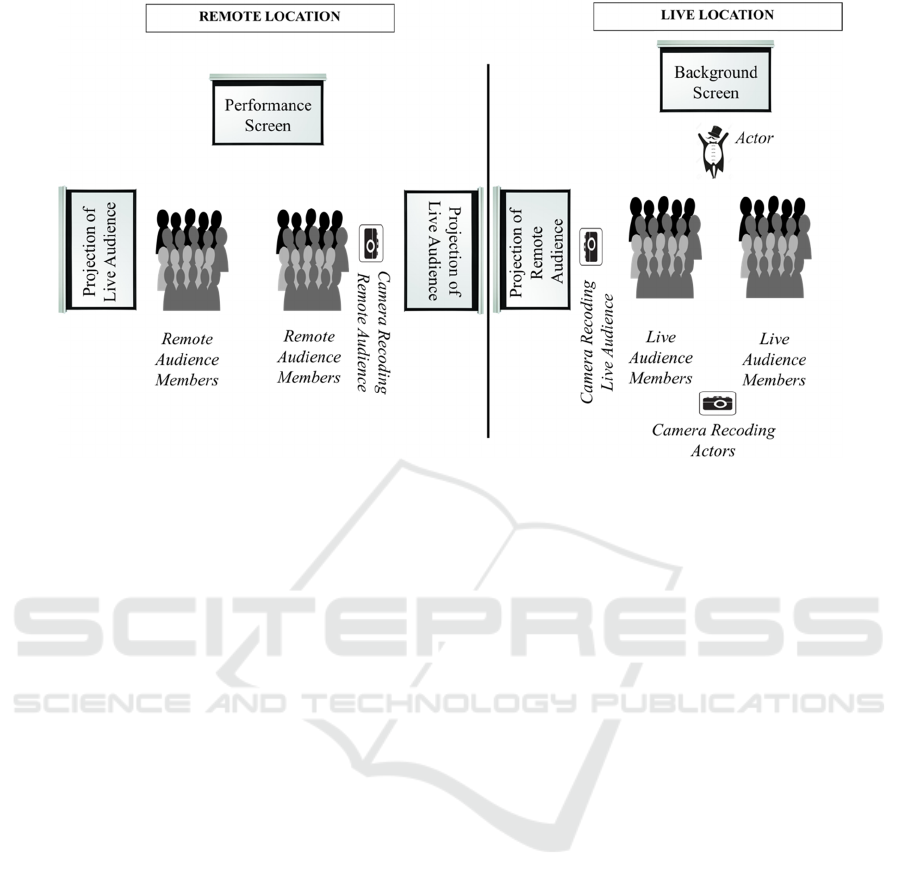
Figure 2: Conceptual sketch of the experimental facilities at each location. Left: at the remote location, there was one screen
showing the performance from the live location in front of the audience members. Another two screens, which showed the
live audience members, were both on their left and right. One camera at the right of the audience was used to record them.
Right: at the live location, the actor was performing in front of the live audience. There was a camera in the back, which
recorded the performance. The projection of the remote audience was placed in a screen on the left of the live audience. The
camera recording the live audience was on the left side. This set up allowed that audience at both locations felt as if they were
in the same space.
focused on supporting the performers but not on
better understanding the audience response. The
current study instead intends to quantify the audience
response during the connected performance.
2.2 Measurement of Audience
Response
In the past, different mechanisms for quantifying
audience response have been employed (e.g., surveys,
real-time scaling system, and physiological
measurement).
Surveys are the most common method. For
example, Gonzalez et al., (2012) used surveys to
evaluate how audience responded to different
technology-oriented performances. However, this
method has some limitations. For instance, surveys
are subjective and the result of them can be easily
influenced by many other factors, like social pressure
and the bandwagon effect.
Besides surveys, Stevens et al., (2009) used a real-
time scaling system called “the portable Audience
Response Facility” (pARF) to measure audience
experience during a performance. There are three
drawbacks to this method: First, as with surveys, it is
a self-report, which is subjective. Furthermore, before
the real experiment starts, the participants have to be
trained to use the system to ensure that they can
respond using the least cognitive effort. The training
procedure is time consuming and inconvenient for
both participants and experimenters. Lastly, even
though the audience members are trained to use the
system, the real-time scaling system still interrupts
the audience during the performance.
In addition to these subjective tools, objective
methods, normally in the form of physiological
sensors, have also been used to measure the audience
response during a performance. For example, GSR
sensors, which measure the users’ electrical
conductance of the skin, have been proven to be a
valid approach for measuring audience engagement
(Picard, 1995). In 2014, Wang and her colleagues
conducted experiments in a real theatre studio using
GSR sensors. Clustering analysis showed that the
audience could be grouped into different engagement
levels. They validated that GSR is a valid proxy for
quantifying user experience.
Considering the advantages of GSR sensors, such
as being an objective and nonintrusive mechanism, in
the current study, GSR sensors were used to measure
the audience response. Additionally, interviews and
behavioural observations were also used for
analysing the data.
How Are We Connected? - Measuring Audience Galvanic Skin Response of Connected Performances
35
3 METHODOLOGY
3.1 Participants
All the participants were recruited at the university,
and they all were university staff without any visual
or acoustic problems. There were 12 audience
members in each location (24 participants in total).
3.2 Stimuli and Apparatus
3.2.1 Distributed Performance
The performance for this experiment was carried out
by a single actor. The play, called “Styx Boat on the
River”, was interactive including a number of pieces
like singing, effects using theatrical smoke and a
vacuum cleaner sound effect. The whole performance
lasted 25 minutes.
3.2.2 GSR Sensors
There are several commercial GSR sensors, e.g.,
BioNomadix Wireless Wearable Physiology from
BioPac Systems Inc., GSR 2™ from Thought
Technology Ltd., and Q sensors from Affectiva Inc.
However, these sensors use Bluetooth as
communication protocol, which makes them not
suitable for group experiments, where simultaneous
readings are needed. We thus decided to build our own
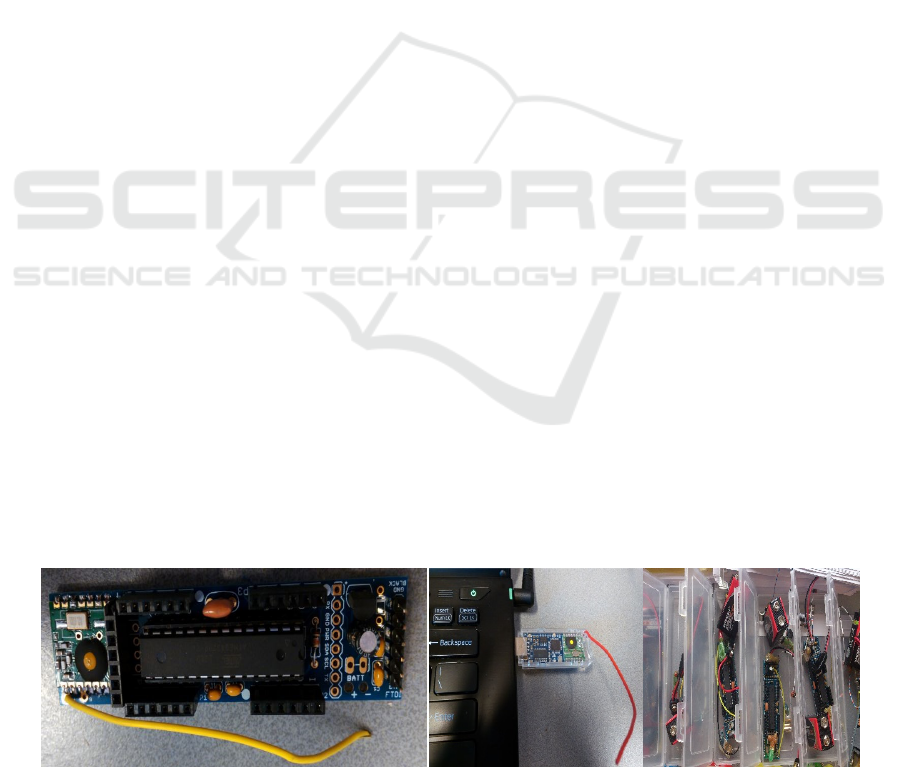
GSR sensor using a Jeenode board with a RF12
wireless module, a low pass filter, and several
accessories (Figure 3), such as a band to be worn on the
user’s palm, holding the electrodes. The wireless
function of the RF12 module makes it possible to run
user studies with a group of users at the same time,
which can be carried out during theatre performances.
The sensors have been validated through a number of
experiments (Wang et al., 2016). All the sensor slaves
simultaneously send packets back to the master sink
node, which is connected to a laptop. The master node
communicates with all the slave nodes by using a
polling mechanism. In a lab testing environment, each
slave sensor node generated 7 or 8 samples per second
(7 Hz or 8 Hz), but in reality the sample rate was
reduced to 4 Hz due to in-air collisions. Before we
used the sensors in the experiment, the effects of
noise in all the sensors were tested, and were
validated in different scenarios (i.e., video watching
or video game playing). In our case, our sensors are
resilient against noise because of the filter. In addition
to that, the sensor data distribution was also proved to
be in accordance with the typical characteristics of
GSR sensor data.
3.2.3 Interviews
Both, actors and audience members were interviewed
after the performance. The interview of audience
members mainly focused on three parts: the overall
evaluation of the performance and the reasons behind
their opinions, the closeness they felt to the actors,
and the closeness they felt to the audience at the other
location. The interview with the actors discussed the
overall evaluation of the performance and the reasons
behind their opinions, and how they felt with respect
to the audience.
3.2.4 Other Apparatus and Software
The performance was live streamed to another
performance studio located in the same building, which
meant that the audiences at the two locations watched
the same performance at the same time. The technical
research team developed the live streaming system.
There were three cameras deployed in total, so that the
remote audience could see the actor and the live
audience through three projector screens. At the live
venue, there were only two projector screens installed,
so that the actors could see the reaction of the remote
audience during the performance (Figure 2).
During the rehearsal, the latency of the live streaming
system was measured, to be around 150 milliseconds,
so that the audiences at the two locations could hardly
feel the influence of delay.
Figure 3: The GSR measuring system: (left) the front side of the sensor board; (middle) the sink node connected with a laptop;
(right) the complete sensor sets.
PhyCS 2016 - 3rd International Conference on Physiological Computing Systems
36
The software for controlling the cameras,
recording the data and networking was written in C
and Python. All the data analysis was done using
SPSS and Python.
3.3 Experimental Procedures
Before the experiment started, the participants filled
an informed consent form. Then oral instructions
were provided. After that, the audience members
from both locations attached the sensors to their non-
dominant palm. At the end of the play, there was a
small group interview at each location. Both the
audience behavioural response during the whole
performance and the performance were video
recorded in order to better recall the experiments
when analysing the sensor readings.
3.4 Data Analysis
To understand the audience members’ GSR response,
both the event-related skin conductance (SCR) and
the skin conductance level (SCL) were analysed.
Before that, the raw GSR data was processed by
averaging the results every second.
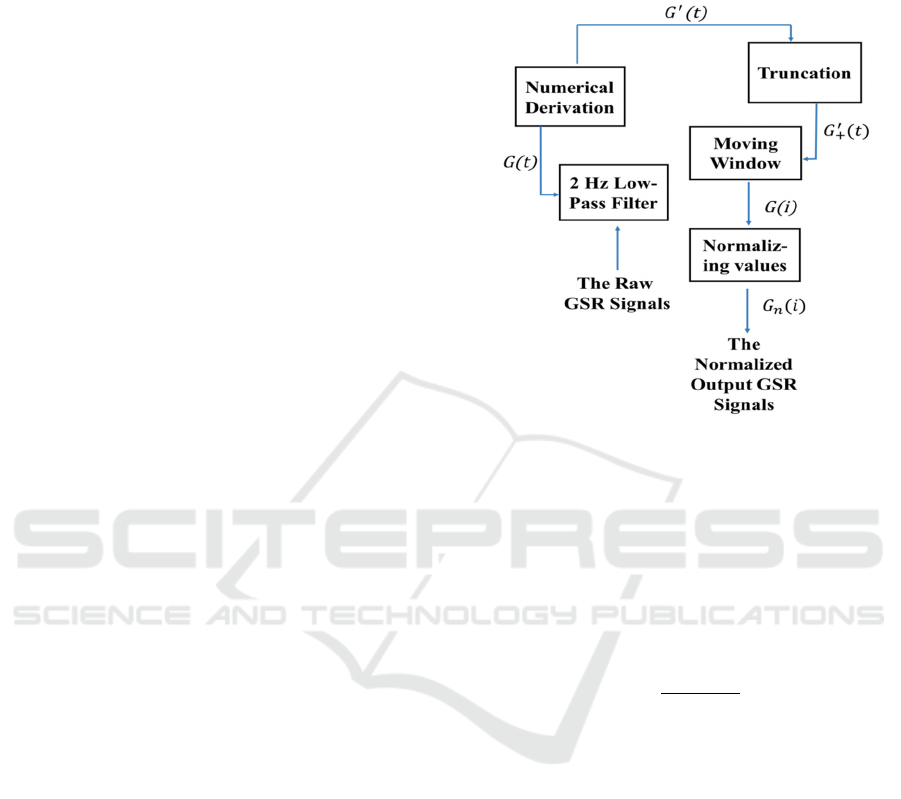
3.4.1 Data Analysis of Event-related SCR
There are several steps to analyse event-related SCR
data (Figure 4) based on Fleureau and his colleagues'
(2013) work.
Normally, when humans receive an engaging
stimulus, their GSR value will increase fast with a
latency of 1-3 seconds, and after reaching a maximum
value, it will recover to a value around the baseline.
In the algorithm we used, first, a 2Hz (
G
(t)) low-pass
filter was applied to remove noise, such as other
physiological signals and electrical noise. Then a
derivation (from
G
(t) to
(t)) was applied to
calculate the rate of change of the GSR data. This way
we know if the GSR value is ascending (positive
values) or descending (negative values). After that,
only the positive values were kept, while the negative
ones were ignored (from
(t) to
(t)), which means
that we only focused on the increasing phases of the
GSR signal, because the negative phases only reflect
the recovery of the signal to the baseline. The steps
above helped us to extract the SCR data.
To temporally analyse emotional flow, we applied
an overlapping time moving window with a window
size of 30 samples (30 seconds), and an overlap of 15
samples (15 seconds). This step helped us to smooth
the data and remove the users’ GSR latency. So the
mean values of
(t) were converted into
Gi
(1 ≤ i
≤ k, k is the number of the moving windows).
Gi
is
the mean derivative value of one subsample in one
specific moving window.
Figure 4: The description of the different steps of the
algorithm on the processing the raw GSR signals.
Since each individual may have a different
amplitude for the derivative GSR signal when
exposed to the same stimulus,
Gi
was divided by the
sum of the subsampled skin response values (Formula
(1)), and the output was
(1 ≤ n ≤ N, N is the
number of the sample; 1 ≤ i ≤ k, k is the number of the
moving windows).
∑
(1)
is the individual value in a moving window,
which cannot represent the whole group’s response,
because there is some individual, different from
person to person, noise (e.g. body movements). To
define whether the group had a significant arousal or
not, a statistical test called the bilateral Mann-
Whitney-Wilcoxon (MWW) test was used. This test
detects whether there is a significant difference
between the audience arousal response (
) and
the background noise. We took the lowest 10% of the
values in
as background noise (Fleureau et al.,
2013).
of a single time sample was compared to
the background noise of each time sample, which
means that we used MWW test to compare k times
and obtain k p-values for each time sample. The final
p-value of each time sample is the averaged value of
those k p-values. For final
p
-values lower than 5%,
we considered the response during that time sample
How Are We Connected? - Measuring Audience Galvanic Skin Response of Connected Performances
37
to be significantly different from the background
noise.
3.4.2 Data Analysis of SCL
The first sensor readings of each participant were
used as the baseline, which was then subtracted from
the raw data, to remove individual differences. Then,
the Pearson product-moment correlation coefficient
was used to check whether there was a significant
correlation between the responses from the audiences
at different locations.
In addition, a t-test was used to compare the SCL
data of live audience members and remote audience
members.
3.4.3 Data Analysis of Video Recordings
Several parameters (e.g., eye contact between the
actor and the audience, interactions between the
actors and the audience, laughter, smile, and applause)
from the video recordings were calculated by
inspecting the recordings (Roto et al., 2009).
4 RESULTS
4.1 Event-related SCR
The event-related SCR results, extracted from the 24
participants (two groups: 12 live audience members
and 12 remote audience members) during the whole
performance, are shown in Figur and Figure 6. In the
top graph of each figure, the blue columns represent
the average value of
at time (
). The red
bar means that the p value in this moment is less than
0.05, i.e. significantly different from background
noise. The concept is mirrored in the bottom graph
where the p-value (blue line) goes below the critical
value (red line).
The algorithm detected a number of moments
where the event-related SCR signals were
significantly different from the background noise,
which means that the audience members were more
engaged. For example, the significantly different
audience SCR response can be seen during the
theatrical smoke effect in the graph of the live
audience. During the smoke effect, also the remote
audience was significantly engaged. The remote
audience members were more absorbed when the
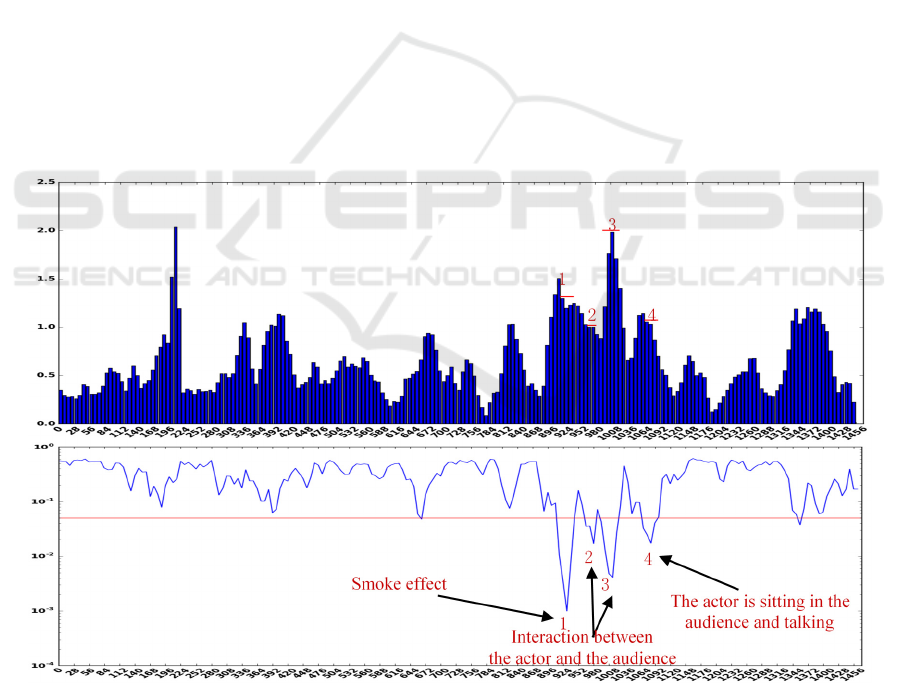
Figure 5: The extracted SCR signals of the live audience members during the performance, where points 1, 2, 3, and 4 are the
significantly different SCR responses identified by the algorithm. In the top graph, the y-axis is the mean derivative value. In
the bottom graph, the y-axis is the mean p value of the bilateral MWW test. The x-axis of both two graphs is the time in
seconds. 1, 2, 3, and 4 are events performed were the live audience SCR response is significantly different from the
background noise. 1: the smoke event; 2 and 3: the interaction between the actor and the audience; 4: the actor is sitting in
the audience and talking.
PhyCS 2016 - 3rd International Conference on Physiological Computing Systems
38
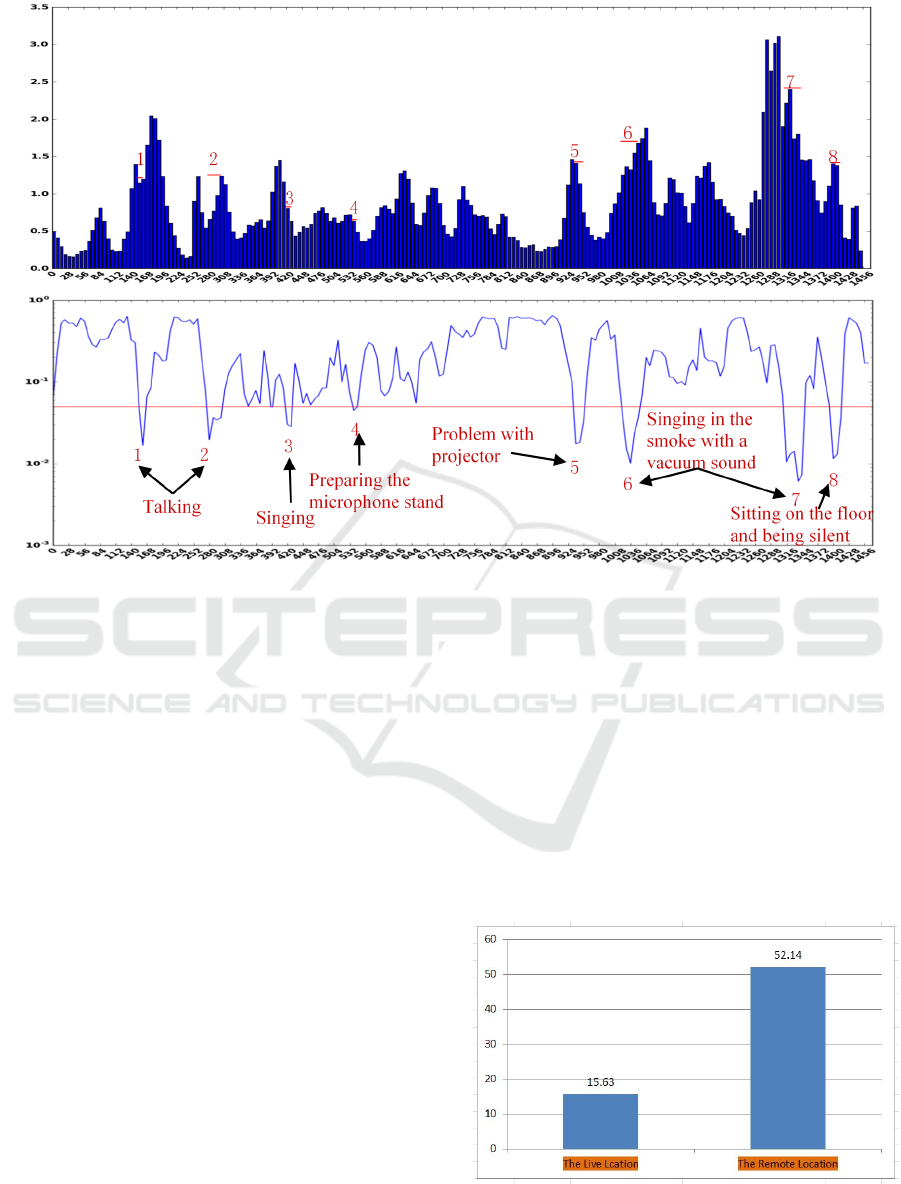
Figure 6: The extracted SCR signals of the remote audience members during the performance, where 1, 2, 3, 4, 5, 6, 7, and 8
are the significantly different SCR response defined by the algorithm. The meaning of x-axis and y-axis is same as Figure 4.
1, 2, 3, 4, 5, 6, 7, and 8 are the events performed while the remote audience SCR response is significantly different from the
background noise. 1: the actor is talking with his arms hurling; 2: the actor is talking to the remote audience; 3: the actor is
singing; 4: the actor is preparing the microphone holder for singing; 5: there is some problems of the projector and the audience
members raised their hand; 6 and 7: the actor was singing in the smog effect with a vacuum sound; 8: the actor was sitting on
the floor and being silent.
actor was singing, while the live audience members
were more engaged during the interaction event. In
addition to that, it is interesting to see that the number
of engaging moments of the remote audience
members is higher than for the live audience members.
4.2 SCL
First, we compare the SCL data of the audience at
different locations during the whole performance.
There is a strong positive correlation between the data
from the live audience and the remote audience (r =
0.535, n = 12, p < 0.01), which indicates that the skin
conductance response pattern at both locations was
synchronised. Additionally, the result of the t-test
showed that there was no significant difference
between the response from the live audience and the
remote audience (t = 1.18, p > .05).
Although the SCL data at the two locations was
similar, we found that the two audiences responded
significantly different to different events. These
findings may help performers to better understand
what kind of effects could arouse a remote audience.
When the actor was singing, we found that the remote
audience was more absorbed (t = -4.04, p < 0.01)
(Figure 7). Additionally, both the theatrical smoke
and the interaction were more engaging for the live
audience (smoke effect: t = 3.35, p < 0.01; interaction:
t = 4.37, p < 0.01) (Figure 8 and Figure 9).
Figure 7: The SCL difference during the singing event.
How Are We Connected? - Measuring Audience Galvanic Skin Response of Connected Performances
39
Figure 8: The SCL difference during the theatrical smoke.
Figure 9: The SCL difference during the interaction.
4.3 Interview and Video Recordings
The data from interviews and video recordings is
summarised and presented in Table 1. In the video
recording, we found that eye contact between the
actor and the audience at both locations was constant
during the performance. Besides, most of the time, the
audience at both locations were smiling. According to
the results of the interview, all of the audience
members felt connected to both the actor and the
audience at the other location. Thus we can conclude
that both the live and the remote audiences were
similarly immersed during the performance.
5 DISCUSSION
In this paper, we reported about a study aimed at
investigating the effect that connected theatre plays
have on the experience of the audience. Both
objective (GSR sensor and video recording) and
subjective (interview) measurements were used in
this study. We found that compared to the live
audience, the remote audience reported a very similar
response to the whole performance, and had a similar
reaction to the event.
Generally, both the live and remote audience
members were engaged, and they had similar
response during the whole performance. This
suggests that connecting two spaces during a live
performance is feasible, and can enable a good
experience.
To be more specific, according to the SCL results,
the live audience was more engaged during the
interaction part and the part with theatrical smoke,
while the remote audience members were more
absorbed during the singing part, which is consistent
with the SCR results. This indicates that remoteness
Table 1: Summaries of interview and video recordings.
THE LIVE AUDIENCE THE REMOTE AUDIENCE
VIDEO
RECORDINGS
Eyes Contact
Constant eye contact Constant eye contact
Interactions
6 times 6 times
Laughter
2 times 3 times
Smile
Most of the time Most of the time
Applause
They applaud at the end of the play They applaud at the end of the play
INTERVIEWS
Closeness to
the actor
Being connected Being connected
Closeness to
another
location
audience
Being connected Being connected
Summarized
opinions
The play was interesting and entertaining, and we felt involved as part of the
play. We liked the play, because we could interact with the actor during his
performance, and it was also funny to see him singing a song with a vacuum
cleaner sound as background.
PhyCS 2016 - 3rd International Conference on Physiological Computing Systems
40

still has some effects on audience experience during
connected performances. The reason why the
theatrical smoke and interaction were more engaging
for the live audience members may be the physical
contact. Those two parts were more vivid, which
caused higher arousal of live audience members.
These results may also help producers to think about
how to design a connected performance, which better
takes into account both the live audience and the
remote audience.
Additionally, it is interesting to see that the remote
audience was engaged more often than the live
audience, based on the results of SCR data. To
explain this, technical issues should be considered.
According to the SCR results of the remote audience,
they were for example engaged when the projector
had problems. This means that when technical
problems occur, the remote audience members will
pay more attention and the GSR signals will increase.
It suggests as well that good control of the technical
aspects is crucial for connected performances.
There is a consistency of the GSR data (the SCR
and SCL results) and the other results. This
demonstrates that GSR is a reliable and valid
indicator of audience response.
6 CONCLUSIONS
This paper explores the effects of remoteness on
audiences attending theatre plays. Based on the
results of all measurements, we found that the remote
audience has a similar experience to the live audience,
which means that remoteness has little influence on a
connected performance. In addition, we can conclude
that audience experience of connected performances
is also influenced by the physical contact to the
audience.
During the experiment, the remote audience
experience was heavily influenced by technical
problems. So we conclude that adequate technical
support plays an important role in a successful
connected performance.
REFERENCES
Bakhshi, H., Mateos-Garcia, J. and Throsby, D. 2010.
Beyond Live: digital innvoation in the performing arts.
[Accessed 10 February 2016]. Available from:
http://eprints.brighton.ac.uk/7234/.
Bennett, S. 2013. Theatre Audiences. Routledge.
Bradley, M. M., Greenwald, M. K., Petry, M. C. and Lang,
P.J. 1992. Remembering pictures: pleasure and arousal
in memory. Journal of experimental psychology.
Learning, memory, and cognition. 18(2), pp.379–390.
Chanel, G., Rebetez, C., Bétrancourt, M. and Pun, T. 2008.
Boredom, engagement and anxiety as indicators for
adaptation to difficulty in games. Proceedings of the
12th international conference on Entertainment and
media in the ubiquitous era - MindTrek ’08., p.13.
Dance, T. 2010. Exploring the Design Space in. Evolution.,
pp.2995–3000.
Dmochowski, J. P., Bezdek, M. A., Abelson, B. P.,
Johnson, J. S., Schumacher, E.H. and Parra, L.C. 2014.
Audience preferences are predicted by temporal
reliability of neural processing. Nature
Communications. 5, pp.1–9.
Fleureau, J., Guillotel, P. and Orlac, I. 2013. Affective
benchmarking of movies based on the physiological
responses of a real audience. Proceedings - 2013
Humaine Association Conference on Affective
Computing and Intelligent Interaction, ACII 2013.,
pp.73–77.
Gonzalez, B., Carroll, E. and Latulipe, C. 2012. Dance-
inspired technology, technology-inspired dance.
Proceedings of the 7th Nordic Conference on Human-
Computer Interaction Making Sense Through Design -
NordiCHI ’12., p.398.
Latulipe, C., Charlotte, C., Carroll, E. a and Lottridge, D.
2011. Love , Hate , Arousal and Engagement :
Exploring Audience Responses to Performing Arts.
Performing arts., pp.1845–1854.
Lunn, D. and Harper, S. 2010. Using galvanic skin response
measures to identify areas of frustration for older web
2.0 users. W4A 10 Proceedings of the 2010
International Cross Disciplinary Conference on Web
Accessibility W4A. (January), pp.1–10.
Mandryk, R. L. 2004. Objectively evaluating entertainment
technology. Extended abstracts of the 2004 conference
on Human factors and computing systems., p.1057..
O’Brian, H. and MacLean, K. E. 2009. Measuring the User
Engagement Process. Advances., pp.1–6.
Picard, R. W. 1995. Affective Computing.
Posner, J., Russell, J. A. and Peterson, B.S. 2005. The
circumplex model of affect: An integrative approach to
affective neuroscience, cognitive development, and
psychopathology. Development and Psychopathology.
17, pp.715–734.
Radbourne, J., Johanson, K., Glow, H. and White, T. 2009.
The Audience Experience: Measuring Quality in the
Performing Arts. International Journal of Arts
Management., 11(3), pp.16–29.
Reason, M. 2010. The Young Audience: Exploring and
Enhancing Children’s Experiences of Theatre.
Trentham Books Ltd
.
Roto, V., Obrist, M. and Väänänen-Vainio-Mattila, K.
2009. User experience evaluation methods in academic
and industrial contexts. In: Interact 2009 conference,
User Experience Evaluation Methods in Product
Development (UXEM'09).
Ruan, S., Chen, L., Sun, J. and Chen, G. 2009. Study on the
Change of Physiological Signals During Playing Body-
controlled Games In: Proceedings of the International
How Are We Connected? - Measuring Audience Galvanic Skin Response of Connected Performances
41

Conference on Advances in Computer Enterntainment
Technology., pp. 349–352.
Russell, J. A. 1980. A circumplex model of affect. Journal
of Personality and Social Psychology. 39(6), pp.1161–
1178.
Sauro, J. and Lewis, J. R. 2012. Chapter 2 - Quantifying
User Research In: Quantifying the User Experience.,
pp. 9–18.
Sawchuk, A. A., Chew, E., Zimmermann, R.,
Papadopoulos, C. and Kyriakakis, C. 2003. From
remote media immersion to distributed immersive
performance In: 2003 ACM SIGMM Workshop on
Experiential Telepresence, ETP ’03., pp. 110–120.
Sheppard, R. M., Kamali, M., Rivas, R., Tamai, M., Yang,
Z., Wu, W. and Nahrstedt, K. 2008. Advancing
interactive collaborative mediums through tele-
immersive dance (TED): a symbiotic creativity and
design environment for art and computer science.
Digital Media., pp.579–588.
Stevens, C. J., Schubert, E., Morris, R. H., Frear, M., Chen,
J., Healey, S., Schoknecht, C. and Hansen, S. 2009.
Cognition and the temporal arts: Investigating audience
response to dance using PDAs that record continuous
data during live performance. International Journal of
Human-Computer Studies. 67(9), pp.800–813.
Wang, C., Geelhoed, E. N., Stenton, P. P. and Cesar, P.
2014. Sensing a live audience In: CHI ’14., pp. 1909–
1912.
Wang, C., Wong, J., Zhu, X., Roggla, T., Jansen, J. and
Cesar, P. 2016. Quantifying Audience Experience in
the Wild: Heuristics for Developing and Deploying a
Biosensor Infrastructure in Theaters. In: Proceedings of
the International Workshop on Quality of Multimedia
Experience (QoMEX2016).
Yang, Z., Yu, B., Wu, W., Nahrstedt, K., Diankov, R. and
Bajscy, R. 2006. A Study of Collaborative Dancing in
Tele-immersive Environments In: Eighth IEEE
International Symposium on Multimedia, 2006.
(ISM’06)., pp. 177–184.
PhyCS 2016 - 3rd International Conference on Physiological Computing Systems
42
