
Adaptive Forward-Reverse Filter using Interpolation Methods
for Artifact Suppression in Retinal Prostheses
Myounghwan Choi
1
, Jeong-Yeol Ahn
2
, Dae-Jin Park
2
, Yujin Jeong
1
, Sangyeol Lee
1
, Sanghyub Lee
1
,
Dong-il Cho
3
, Yong-Sook Goo
2
and Kyo-in Koo
1
1
Department of Biomedical Engineering, University of Ulsan, Ulsan, Republic of Korea
2
Department of Physiology, School of Medicine, Chungbuk National University, Cheongju, Republic of Korea
3
School of Electrical Engineering and Computer Science, Seoul National University, Seoul, Republic of Korea
Keywords: Retinal Ganglion Cell (RGC), Adaptive Forward-Reverse Filter, Interpolation Method, Artifact Suppression,
and Receiver Operating Characteristics (ROC).
Abstract: Electrical stimulation on retinal ganglion cells (RGCs) induce the short-latency (directly-evoked) and long-
latency (indirectly-evoked) responses of RGCs. The artifact suppression and isolation of direct RGC spike is
required for proper analysis of visual information. Adaptive forward-reverse filter (FR filter) using
interpolation method is proposed and evaluated. On selected over 1.6 ms waves, which is suspected as artifact,
2 new data points are linearly interpolated between the recorded data points. After that, the interpolated data
are filtered by frequency-based FR filter (500 Hz). The proposed algorithm shows the best true positive rate
(0.7629) comparing with the SALPA and the simple FR filter without the interpolation method. In point of
view of the false positive rate, the proposed algorithm demonstrates the second-best performance (0.0047),
not better than the SALPA (0.0006).
1 INTRODUCTION
The outer retinal diseases such as the retinitis
pigmentosa (RP) and the age-related macular
degeneration (ARMD) are the main causes of most
blinding retinal diseases. The retinal prostheses have
been regarded as a promising method for restoring
vision for the blind with these outer retinal
degenerative diseases. Each electrode of retinal
prostheses would stimulate remained living-cells in
the diseased retina. These stimuli transmit visual
information to the visual cortex of the patient brain
(Humayun et al., 2003; Jensen and Rizzo, 2008; Ryu
et al., 2009b). Retinal prosthesis is classified into two
types: epi-retinal prosthesis and sub-retinal prosthesis.
Epi-retinal approach for retinal prosthesis stimulates
the retinal ganglion cells (RGCs) using the
microelectrode array implanted on the retinal surface
(Rao et al., 2008). The epi-retinal stimulation can
evoke short-latency response and long-latency
response. The short-latency response is originated
from the direct stimulation of RGCs, and the long-
latency response is originated from network mediated
stimulation of RGCs (Boinagrov et al., 2014;
Sekirnjak et al., 2006). The long-latency responses
can be clearly identified without hindrance of the
stimulation artifact, however, the short-latency
responses are significantly hindered by the
stimulation artifact (Jensen and Rizzo III, 2007).
RGCs can accurately follow electrical stimulation
with rates up to 250 Hz, which is equivalent to the
maximum spike frequencies in the natural light
response of the normal eye (Fried et al., 2005).
Therefore, direct RGC stimulation may allow precise
mimicking of RGC bursts characteristic to normal
vision (Sekirnjak et al., 2006). In order to encode
visual information properly in the retinal prosthesis,
the RGCs responses should be properly isolated (Ryu
et al., 2009a; Wagenaar and Potter, 2002).
In the previous researches, several methods have
been used to detect the short-latency spike. The
typical method is tetrodotoxin (TTX) injection
method. The TTX blocks sodium channel so that its
injection enables to get spikeless signal, that is, the
pure stimulus artifact. The pure stimulus artifact is
subtracted from the raw signal containing obscured
spikes for the short-latency response detection (Fried
et al., 2005; Ryu et al., 2009a; Sekirnjak et al., 2006).
Besides the TTX injection method, the patch clamp
Choi, M., Ahn, J-Y., Park, D-J., Jeong, Y., Lee, S., Lee, S., Cho, D-i., Goo, Y-S. and Koo, K-i.
Adaptive Forward-Reverse Filter using Interpolation Methods for Artifact Suppression in Retinal Prostheses.
DOI: 10.5220/0005944001050109
In Proceedings of the 6th International Joint Conference on Pervasive and Embedded Computing and Communication Systems (PECCS 2016), pages 105-109
ISBN: 978-989-758-195-3
Copyright
c
2016 by SCITEPRESS – Science and Technology Publications, Lda. All rights reserved
105

methods and the threshold stimulation method have
been researched for the short-latency spike detection
(Lee et al., 2007; Li et al., 2005). The above-
mentioned methods require additional experimental
manipulations to detect the short-latency spikes, such
as chemical injection and stimulation strength
varying. Furthermore, these methods are almost
impossible to apply to the retinal prosthesis system.
In our previous study, we compared results of three
different algorithms; suppression of artifacts by local
polynomial approximation (SALPA), moving average
filter (MAF), and forward-reverse filter (FR filter).
These three filter algorithms demonstrated short-
latency spike detection feasibility (Choi et al., 2015).
In this paper, we propose the adaptive FR filter
using interpolation method for artifact suppression.
The FR filter algorithm performs a zero-phase
filtering by forward and reverse processing with
identical filter (Gustafsson, 1994). In the artifact
region, the recorded voltage values are fluctuated
dramatically. We interpolate new values linearly
among these signal-coarse region. This interpolation
method effects increase of the cut-off frequency in the
artifact region.
2 METHODS
2.1 Data Acquisition
Retinal signal is acquired from rd1 mice after
potential 10 week. The method used in Steet et al.
(2000) is modified for retinal preparation. The eyeball
is enucleated and the retina is isolated. From the
isolated mouse retina, ganglion cell side of a retinal
segment (approximately 5 × 5 mm
2
) is attached on
the surface of the 8 × 8 multi-electrode arrays (Multi
Channel Systems GmbH, Germany). The RGC
responses are extracellularly recorded with 8 × 8
multi-electrode array in which one electrode is used
as stimulating electrode and all other electrodes as
recording electrode (Stett et al., 2000). We apply
electrical stimulation that is cathodic phase-first
biphasic current pulses (square pulse) in every 1 sec
50 times. Its pulse duration is 500 μs and pulse
amplitude is varying from 5 μA to 60 μA. The RGC
activities are recorded by MC Rack (Multi Channel
Systems GmbH, Germany).
2.2 Data Analysis
Concisely, we subtract the recorded raw signal by the
filtered signal using adaptive FR filter. The subtracted
signal is thresholded and clustered. Filtering,
subtracting, and clustering are programmed by
MATLAB (Mathworks, U.S.A.).
In detail, our first process is depegging. The
recorded RGC signal includes minimum or maximum
values by stimulation. This saturation has no RGC
response information. Therefore, we convert
saturation values into zero. This technique is called
depegging following the previous report (Wagenaar
and Potter, 2002). The maximum value is evoked
after the minimum value because we use cathodic
phase-first biphasic current pulse (square pulse) as
stimulus pulse. Therefore, the depegging interval is
decided from stimulus time to ninety percent of
anodic saturation value. After the original data are
depegging, the adaptive FR filter algorithm is applied.
2.2.1 FR Filter Algorithm
The FR filter stands for ‘forward-reverse filter’. The
FR filter algorithm performs zero-phase filtering by
filtering the raw signal in both the forward and the
reverse directions with the identical time invariant
filter. The main effect of the FR filter is elimination
of phase distortion (Gustafsson, 1994).
Figure 1: The flow chart of the basic FR filter algorithm.
We apply 3
rd
order Butterworth high-pass filter
with 100 Hz cut-off frequencies for base-line
smoothing before the FR filtering. The FR filter
algorithm is operated with 3
rd
order Butterworth low-
pass filter. We apply 500 Hz cut-off frequencies
because the peak frequency of most spikes is
somewhere around 625 Hz (Jin et al., 2005). After
that, we subtract the results of the FR filter algorithm
from the results of the 100 Hz high-pass filter.
However, the FR signal does not effectively remove
residual artifact because along the time axis the
recorded voltage is varied dramatically. Therefore,
we select over 1.6 ms waves, which start from 0
voltages and end in 0 voltages, as the residual artifact,
because most spikes have showed 1.6 ms duration
(Jin et al., 2005). The selected residual artifact is
processed by our proposed interpolation method.
2.2.2 Interpolation Method
We linearly interpolate two points between the
recorded signals at the selected residual artifact. This
means that the number of signal increases 3 times by
the interpolation. The interpolated signal is operated
by low pass FR filter algorithm with 500 Hz of the
cut-off frequencies. After filtering, values at the
SPCS 2016 - International Conference on Signal Processing and Communication Systems
106
interpolated times are removed. This removal
accomplishes that the interval between values are
restored to the status before the interpolation. This
restored signal is attached at the original time. This
interpolation method effects to increase the cut-off
frequency of the FR filter algorithm at the selected
residual artifact.
2.3 Performance Evaluation
of the Adaptive FR Filter
2.3.1 Comparison Data
We compare the adaptive FR filter with and without
the proposed interpolation method. As a reference,
they were compared with other researchers’ work, the
Subtraction of Artifacts by Local Polynomial
Approximation (SALPA) (Choi et al., 2015;
Wagenaar and Potter, 2002).
The SALPA algorithm is a stimulus artifact
removal filter using locally fitted cubic polynomials,
designed by Daniel Wagenaar and Steve Potter. A
model of the artifact based on locally fitted cubic
polynomials is subtracted from the recorded original
signal. The algorithm yields a flat baseline amenable
to spike detection by threshold voltage (Wagenaar
and Potter, 2002).
2.3.2 Receiver Operating Characteristics
Analysis
In order to evaluate the proposed adaptive FR filter,
we use receiver operating characteristics (ROC)
analysis. The ROC analysis is useful for organizing
classifiers and visualizing their performance. The
ROC classified into four groups; the true positive, the
true negative, the false positive, the false negative
(Fawcett, 2006). Table 1 shows a confusion matrix.
Table 1: The two-by-two confusion matrix.
Actual Class
Yes No
Predicted
Class
Yes
True
Positive
False
Positive
No
False
Negative
True
Negative
We evaluate and compare filters in point of the
first spike detection performance after the stimulus.
In our experimental experience, most spikes have
been detected after 4 ms from the stimulus time.
Based on our experimental experience, spike
detection before 4 ms means the false positive. No
spike detection before 4 ms is the true negative. In
order to categorize the true positive and the false
negative, we compared the first spike time of the
adaptive FR filter, the simple FR filter, and the
SALPA. If one filter detected first spike after 4 ms
earliest, that filter is regarded as the true positive
performance. If other filter algorithm detected its own
first spike within 2 ms follow the first filter algorithm,
that algorithm is considered as the true positive also.
The 2 ms tolerance is allowed because most spike
showed approximately 2 ms duration time. If other
filter algorithm detected its own first spike in 2 ms
later than the first spike, that algorithm is regarded as
the false negative. We plotted the ROC graph which
locates the true positive rate (TP rate) on the Y axis
and the false positive rate (FP rate) on the X axis.
The true positive rate is estimated as
TP rate ≈
true positive
true positive + falsene
g
ative
(1)
The false positive rate is estimated as
FP rate ≈
false positive
true ne
g
ative + falsepositive
(2)
This ROC graph enables to compare 3 filters’
performance and threshold value. Therefore, we
varied the threshold time for the first spike criteria
from 1 ms to 7 ms in order to evaluate our
experimental experience, 4 ms.
3 RESULTS
3.1 Short-latency Spike Detection
The adaptive FR filter using the interpolation method
detects the short-latency spike that has been obscured
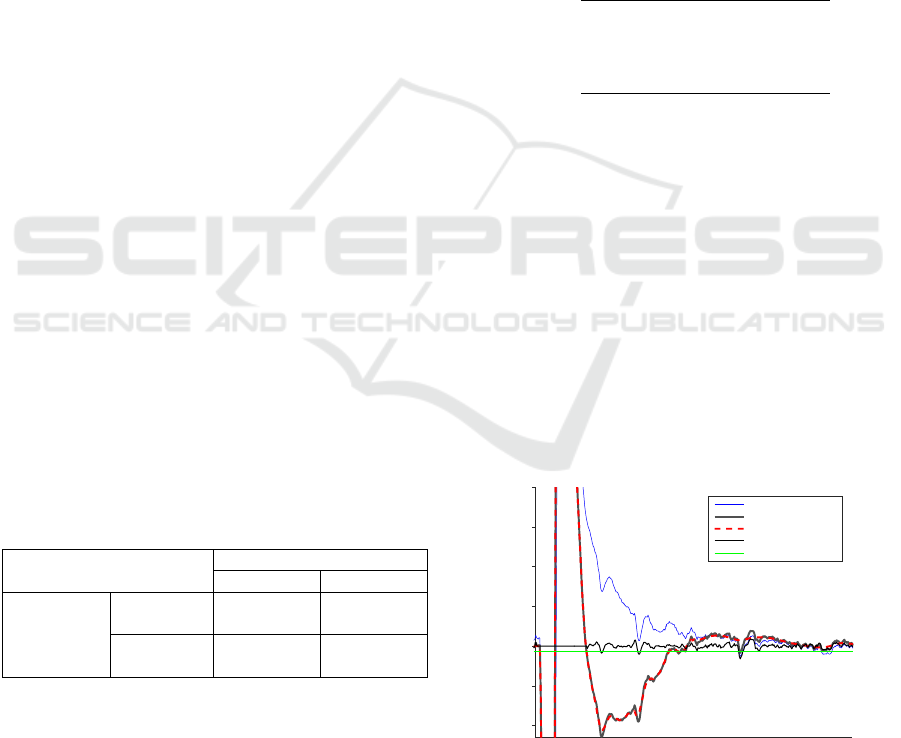
by the artifact slope (Figure 2 and 3).
Figure 2: The raw signal (the blue solid line) is filtered by 100
Hz high pass filter for the base line smoothing (the grey line).
The high pass filtered signal is processed by the adaptive FR
filter (the red dotted line). The final result (the black line)
which subtracts the red dotted line from the grey line is
discriminated from noise by threshold (the green line).
-400
-200
0
200
400
600
800
Amplitude(μV)
Adaptive FR filter
Raw signal
100 Hz High-Pass Filter
Filter
Result
Threshold
Adaptive Forward-Reverse Filter using Interpolation Methods for Artifact Suppression in Retinal Prostheses
107
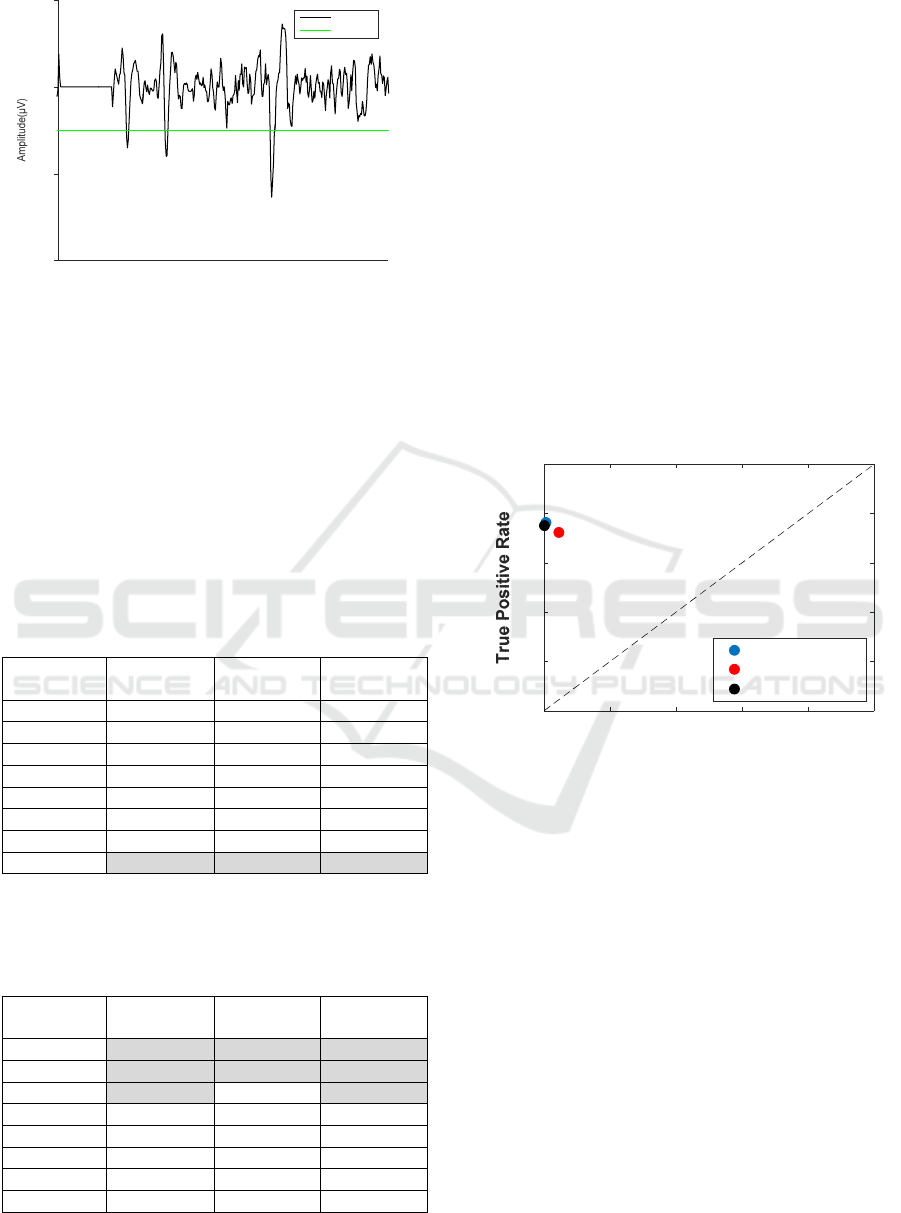
Figure 3: The subtracted signals (the black line) is
distinguished by the threshold (the green line). Three short-
latency spikes are detected.
3.2 Receiver Operating Characteristics
Analysis
3.2.1 True Positive Rate
Comparing to the three algorithms with respect to the
true positive rate, the SALPA shows the best
performance as 0.8136, and the simple FR filter show
the worst performance as 0.7546.
Table 2: Comparison the true positive rate of three
algorithms.
Adaptive
FR filter
Simple
FR filter
SALPA
0 ms 0.7319 0.6733 0.7508
1 ms 0.7319 0.6733 0.7508
2 ms 0.7319 0.6731 0.7510
3 ms 0.7325 0.6750 0.7527
4 ms 0.7629 0.6881 0.7541
5 ms 0.7632 0.7236 0.7800
6 ms 0.7485 0.7525 0.8107
7 ms 0.7770 0.7546 0.8136
3.2.2 False Positive Rate
Table 3: Comparison the false positive rate of three
algorithms.
Adaptive
FR filter
simple
FR filter
SALPA
0 ms 0 0 0
1 ms 0 0 0
2 ms 0 0.0002 0
3 ms 0.0028 0.0014 0.0006
4 ms 0.0047 0.0184 0.0329
5 ms 0.0625 0.0447 0.0707
6 ms 0.1570 0.0950 0.1272
7 ms 0.1944 0.1535 0.1899
Comparing to the three algorithms with respect to the
false positive rate, the SALPA shows the best
performance at 0 ~ 3 ms threshold. After 3 ms,
however, the false positive rate of the SALPA
increases rapidly.
3.2.3 Roc Graph
Considering all the results, the threshold of the
adaptive FR filter, the simple FR filter, and the
SALPA for the best performance are 4 ms, 5 ms, and
3 ms, respectively. The proposed algorithm shows the
best true positive rate as 0.7629 comparing with the
SALPA (0.7527) and the simple FR filter (0.7236)
without the interpolation method. In point of view of
the false positive rate, the proposed algorithm
demonstrates the second-best performance as 0.0047.
The best false positive rate is the SALPA (0.0006).
Figure 4 shows the ROC graph of three algorithms at
best performance threshold time.
Figure 4: Comparison of the three algorithms using ROC
graph.
As seen in Figure 4, the adaptive FR filter and the
SALPA had similar performance. On the other hand,
the simple FR filter is poor performance comparing
with other algorithms.
4 CONCLUSIONS
The adaptive FR filter effectively removes the artifact
and successfully isolates the short-latency spike from
the artifact slopes. In the ROC graph, the adaptive FR
filter shows good performance with the SALPA. It is
much better performance than that of the simple FR
filter. We have plan to apply the neural network
algorithm in order to enhance the performance of the
adaptive FR filter.
-100
-50
0
50
Adaptive FR filter
Result
Threshold
0 0.2 0.4 0.6 0.8 1
False Positive Rate
0
0.2
0.4
0.6
0.8
1
Adaptive FR filter
Simple FR filter
SALPA
SPCS 2016 - International Conference on Signal Processing and Communication Systems
108

ACKNOWLEDGEMENTS
This work (Grants No. C0257942) was supported by
Business for Academic-industrial Cooperative
establishments funded Korea Small and Medium
Business Administration in 2015. This work was also
supported by Basic Science Research Program
through the National Research Foundation of Korea
(NRF) funded by the Ministry of Science, ICT &
Future Planning (NRF-2014R1A1A10353 35).
REFERENCES
Boinagrov, David, Susanne Pangratz-Fuehrer, Georges
Goetz and Daniel Palanker. 2014. Selectivity of Direct
and Network-Mediated Stimulation of the Retinal
Ganglion Cells with Epi-, Sub-and Intraretinal
Electrodes. Journal of Neural Engineering 11:026008.
Choi, MH, Ahn, JY, Oh, SJ, et al. 2015. Comparison of the
Three Filter Algorithms for Detection of Electrically-
Evoked Short-Latency Responses in Retinal Ganglion
Cells. Paper presented at World Congress on Medical
Physics and Biomedical Engineering, June 7-12, 2015,
Toronto, Canada. .
Fawcett, Tom. 2006. An Introduction to ROC Analysis.
Pattern Recognition Letters 27:861-74.
Fried, SI, Hain-Ann Hsueh and FS Werblin. 2005. A
Method for Generating Precise Temporal Patterns of
Retinal Spiking using Prosthetic Devices. Journal of
Vision 5:4-.
Gustafsson, Fredrik. 1994. Determining the Initial States in
Forward-Backward Filtering. .
Humayun, Mark S., James D. Weiland, Gildo Y. Fujii, et al.
2003. Visual Perception in a Blind Subject with a
Chronic Microelectronic Retinal Prosthesis. Vision
Research 43:2573-81.
Jensen, Ralph J. and Joseph F. Rizzo III. 2007. Responses
of Ganglion Cells to Repetitive Electrical Stimulation
of the Retina. Journal of Neural Engineering 4:S1.
Jensen, Ralph J. and Joseph F. Rizzo. 2008. Activation of
Retinal Ganglion Cells in Wild-Type and Rd1 Mice
through Electrical Stimulation of the Retinal Neural
Network. Vision Research 48:1562-8.
Jin, Gye H., Tae S. Lee and Yong S. Goo. 2005. Waveform
Sorting of Rabbit Retinal Ganglion Cell Activity
Recorded with Multielectrode Array. Korean Journal
of Medical Physics 16:148-54.
Lee, H., J. Lee, W. Jung and Gun-Ki Lee. 2007. The
Periodic Moving Average Filter for Removing Motion
Artifacts from PPG Signals. International Journal of
Control Automation and Systems 5:701.
Li, Liming, Yuki Hayashida and Tetsuya Yagi. 2005.
Temporal Properties of Retinal Ganglion Cell
Responses to Local Transretinal Current Stimuli in the
Frog Retina. Vision Research 45:263-73.
Rao, Cheng, Xiang-Hui Yuan, Si-Jie Zhang, Qiu-Lin Wang
and You-Shu Huang. 2008. Epiretinal Prosthesis
Forouter Retinal Degenerative Diseases. International
Journal of Ophthalmology 1:273-6.
Ryu, Sang B., Jang H. Ye, Jong S. Lee, Yong S. Goo, Chi
H. Kim and Kyung H. Kim. 2009a. Electrically-Evoked
Neural Activities of Rd1 Mice Retinal Ganglion Cells
by Repetitive Pulse Stimulation. The Korean Journal of
Physiology & Pharmacology 13:443-8.
Ryu, Sang B., Jang H. Ye, Jong S. Lee, Yong S. Goo and
Kyung H. Kim. 2009b. Characterization of Retinal
Ganglion Cell Activities Evoked by Temporally
Patterned Electrical Stimulation for the Development of
Stimulus Encoding Strategies for Retinal Implants.
Brain research 1275:33-42.
Sekirnjak, C., P. Hottowy, A. Sher, W. Dabrowski, A. M.
Litke and E. J. Chichilnisky. 2006. Electrical
Stimulation of Mammalian Retinal Ganglion Cells with
Multielectrode Arrays.
Journal of neurophysiology
95:3311-27.
Stett, Alfred, Wolfgang Barth, Stefan Weiss, Hugo
Haemmerle and Eberhart Zrenner. 2000. Electrical
Multisite Stimulation of the Isolated Chicken Retina.
Vision Research 40:1785-95.
Wagenaar, Daniel A. and Steve M. Potter. 2002. Real-Time
Multi-Channel Stimulus Artifact Suppression by Local
Curve Fitting. Journal of Neuroscience Methods
120:113-20.
Adaptive Forward-Reverse Filter using Interpolation Methods for Artifact Suppression in Retinal Prostheses
109
