
An Environment for Automated Measuring of Energy Consumed by
Android Mobile Devices
Armen Dzhagaryan
1
, Aleksandar Milenković
1
, Mladen Milosevic
2
and Emil Jovanov
1
1
Electrical and Computer Engineering Department, The University of Alabama in Huntsville,
301 Sparkman Drive, Huntsville, AL, U.S.A.
2
Philips Research North America, Cambridge, MA, U.S.A
Ke
ywords: Mobile Computing, Computerized Instrumentation, Current Measurement, Energy Measurement,
Performance Evaluation, Debugging.
Abstract: Mobile devices such as smartphones, tablets, and e-readers have become the dominant type of computing
platforms. Energy-efficiency has become a key design and operating requirement for applications running
on mobile devices. It is further underscored by a growing reliance of consumers on services delivered
through mobile devices and their growing complexity and sophistication. A detailed measurement-based
characterization of energy needs of mobile applications is important for both device manufacturers and
application developers, as it may identify energy-demanding activities and guide optimizations. In this
paper, we describe an environment for automated energy measurements of applications running on Android
mobile devices. We discuss hardware and software aspects of the environment and several approaches to
runtime capturing and timestamping of activities of interest. Finally, we demonstrate the use of the
environment in several case studies conducted on Google’s Nexus 4 smartphone.
1 INTRODUCTION
Mobile computing devices such as smartphones,
tablets, and e-readers have become the dominant
computing platforms. According to estimates for
2015 (Gartner, Inc., 2016; IDC, 2016) vendors
shipped 1.43 billion smartphones, up 19.2% from
the prior year, and 241 million ultramobiles (basic
and premium tablets). The total number of mobile
devices shipped reached 1.91 billion in 2015, with
~74.8% being smartphones, and the same correlation
is predicted to grow to 82% in 2016. At the same
time, the number of personal computers shipped in
2015 was 290 million (Gartner, Inc., 2016). Modern
smartphones and tablets have evolved into powerful
computing platforms with significant processing
power, storage capacity, myriad of communication
interfaces, and numerous sensors. New applications
have emerged in areas of communication,
navigation, social networking, mobile health, and
entertainment.
Growing dependency of users on services
delivered through their battery-powered mobile
devices makes their energy-efficient operation a top
priority. Energy efficiency is a prime design
requirement for mobile device manufacturers and
application developers alike. It is driven by several
key factors, including (i) limited energy capacity of
batteries, (ii) cost considerations favoring less
expensive packaging, and (iii) user convenience
favoring lightweight designs with small form factors
that operate for long periods without battery
recharges.
A number of recent research studies have
focused on power profiling and power estimation of
mobile computing platforms. Carroll and Heiser
quantified energy consumption of each component
in a mobile device by performing rigorous tests and
then simulating a number of usage scenarios on
mobile devices (Carroll and Heiser, 2010). Rice and
Hay profiled the energy consumption of connecting
and transmitting data over a wireless network (Rice
and Hay, 2010a; 2010b). Bircher and John used
processor performance counters and system-specific
models to estimate consumption of CPU, memory,
disk and I/O (Bircher and John, 2012). Pathak et al.
(Pathak et al., 2012; 2011) and Li and John (Li and
John, 2003) used system call tracing and known
observations of the system to generate models that
can perform run-time power estimation with fine-
28
Dzhagaryan, A., Milenkovi
´
c, A., Milosevic, M. and Jovanov, E.
An Environment for Automated Measuring of Energy Consumed by Android Mobile Devices.
DOI: 10.5220/0005950800280039
In Proceedings of the 6th International Joint Conference on Pervasive and Embedded Computing and Communication Systems (PECCS 2016), pages 28-39
ISBN: 978-989-758-195-3
Copyright
c
2016 by SCITEPRESS – Science and Technology Publications, Lda. All rights reserved

grained measurements.
Runtime power measurements on real mobile
devices running common software platforms such as
Android, iOS, Tizen, or Windows Phone are
important for both researchers and mobile
application developers. Measurement frameworks
can capture complex interactions between hardware
and software stacks that become more and more
sophisticated with introduction of multicore
processors and a number of hardware accelerators.
Measurements on real devices can help research
studies that target power optimizations or those that
target developing analytical models for energy
estimation based on parameters derived from real
platforms. For developers, adding a power
perspective to application debugging and testing
may guide optimizations that will result in more
energy-efficient applications.
Whereas several prior studies focused on
capturing power traces on smartphones (Carroll and
Heiser, 2010; Rice and Hay, 2010a, 2010b) and
wireless sensor network platforms (Milenkovic et
al., 2005), they relied on manual control and post-
processing for synchronization of power traces with
events in profiled programs or focused on early
smartphones and software platforms. In addition,
they relied on hardware setups that required
inserting a shunt resistor on the power supply line,
thus introducing a slight deviation in the power
supply of the device under test.
In this paper, we introduce an environment for
automated power and energy measurements of
modern mobile computing devices. Our hardware
setup includes a mobile device under test, a National
Instruments’ battery simulator, and a workstation.
Our custom program running on the workstation
interfaces both the mobile device and the NI battery
simulator and offers a number of services for
automated energy profiling. Specifically, the custom
program (a) offers a number of configuration options
to customize the energy profiling, (b) remotely
controls applications and activities executed on the
mobile device, (c) synchronizes running applications
with collecting current samples from the battery
simulator, and (d) provides scripts for calculating the
energy consumed. We describe several approaches
to capturing timestamps that delimit the profiled
activities. The first approach relies on the native
Android logging system and does not require any
changes in applications that are being profiled. The
second approach also relies on the native Android
logging system and custom messages inserted in the
source code by developers. The third approach relies
on CyanogenMod Android and common Linux-like
utilities to support launching and timestamping of
mobile applications.
Some of the key advantages of the proposed
measuring setup are as follows:
No hardware modifications. The setup requires
no hardware modifications or instrumentation of
the mobile device; the device’s battery is simply
replaced with probes coming from the battery
simulator;
Automated test execution. The measurements are
fully automated and controlled by scripts
prepared in advance and thus do not require
interactive user participation. The scripts can
control energy profiling of a number of
applications profiled in a single test run;
Automated synchronization. The workstation and
the mobile device under test are time-
synchronized using standard network
synchronization protocols, thus allowing for
precise timestamping of activities of interest;
High resolution and accuracy. The setup allows
collection of up to 200,000 samples per second
of power supply current with an accuracy of 1
µA, thus providing a deep insight into inner
operations of internal components.
The rest of this paper is organized as follows.
Section 2 describes the hardware and software
aspects of the setup for energy measurement.
Section 3 describes approaches to profiling Android
applications, including different methods for
collecting timestamps that delimit in time the
activities of interest. Section 4 demonstrates the use
of the setup in estimating energy-efficiency of
several important activities. Section 5 surveys
related work, and Section 6 concludes the paper.
2 MEASURING SETUP
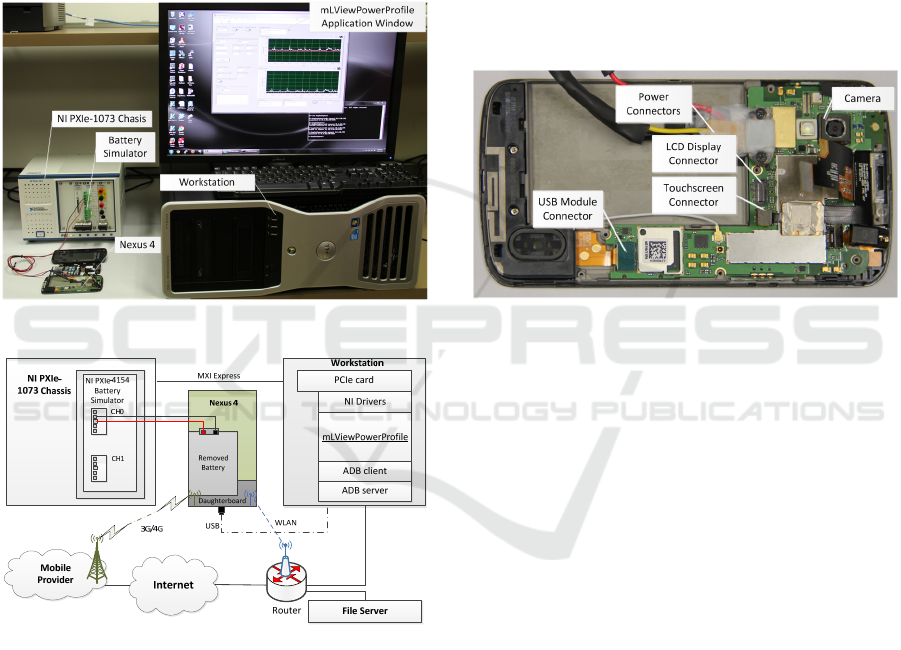
Our setup for energy profiling of mobile computing
platforms, shown in Figure 1, consists of a mobile
platform, an NI PXIe-4154 battery simulator (NI,
2014a), and a workstation. Figure 2 shows a block
diagram of the setup, including main components
and communication channels between them. As an
example mobile platform, we use a Google’s Nexus
4 smartphone (Google, 2014a) running Android
4.3.2 operating system (Google, 2014b). Whereas
this paper focuses on energy profiling of Android
platforms, our hardware setup can be used to profile
applications running on other software platforms
such as iOS, Tizen, or Windows Phone. The battery
simulator, a specialized programmable power
An Environment for Automated Measuring of Energy Consumed by Android Mobile Devices
29
supply, is connected to an MXI-Express Interface
card inside the workstation. The battery simulator is
used to (a) power the smartphone through probes,
thus bypassing the actual smartphone battery, and
(b) measure the current drawn by the smartphone
while running applications. The workstation runs our
custom program called mLViewPowerProfile that
interfaces (a) the smartphone to manage activities
and applications that are being profiled, and (b) the
battery simulator to capture and record the current
sample measurements. The following subsections
shed more light on each component in our setup.
Figure 1: Hardware setup for energy profiling.
Figure 2: Block diagram of the hardware setup for energy
profiling.
2.1 Smart Phone
Google’s Nexus 4 smartphone (Google, 2014a) is
powered by a Qualcomm’s Snapdragon S4 Pro
(APQ8064) system-on-a-chip (Qualcomm, 2014)
that includes a quad-core ARM processor running at
up to 1.512 GHz clock and an Adreno 320 graphics
processor. Nexus 4 has 2 GBytes of RAM memory
and 16 GBytes of built-in internal storage. It uses a
4.7 inch display, and includes a 1.3 megapixel front-
facing camera and an 8 megapixel rear-facing
camera. It supports a range of connectivity options
including WLAN 802.11n, Bluetooth 4.0, USB,
HDMI, and several cellular network protocols such
as GSM/EDGE/GPRS, 3G UMTS/HSPA+/DC-
HSP+, and HSDPA+.
To prepare the smartphone for energy profiling,
its underlying plastic shield is removed to reveal
connections on its motherboard and daughterboard
as shown in Figure 3. The smartphone’s battery is
removed, and power connectors to the battery
simulator are added. During power profiling,
connectors to smartphone components such as LCD
display, touchscreen, USB, and others can be easily
unplugged, thus enabling selective profiling that
excludes energy consumed by these components.
Figure 3: Nexus 4 prepared for energy measurements.
Nexus 4 runs Android version 4.3.2 (Jelly Bean).
In some cases, an upgrade to Android may be
beneficial to (a) support applications and setups not
readily available on native Android, and (b) to
further automate performance and energy
measurements. Our alternative smartphone setup
requires flashing the smartphone with
CyanogenMod version 10.2 (CyanogenMod, 2014),
an open-source operating system for smartphones
and tablet computers based on official releases of
Android that includes third-party software. It
includes cpufrequtils package that enables inspection
and control of clock frequency ranges and power
schemes for each processor core.
2.2 Battery Simulator
The battery simulator resides inside an NI PXIe-
1073 chassis (NI, 2014b), which is connected to an
MXI-Express Interface card inside the workstation
(Figure 2). The battery simulator is a specialized
programmable power supply optimized for powering
devices under test, including cellular handsets,
smartphones, tablets, and other mobile devices. Its
+6 V, ±3 A Channel 0 is designed to simulate a
lithium-ion battery cell’s transient speed, output
PEC 2016 - International Conference on Pervasive and Embedded Computing
30
resistance, and 2-quadrant operation (source/sink)
(NI, 2014a). The simulator’s ultrafast transient
response time, <20 µs, allows it to respond rapidly
to changes in load current with a minimal voltage
dip. It can sample the voltage and current drawn on
its channels with a configurable sampling frequency
of up to 200,000 samples/s and a sensitivity of the
current measurements of 1 µA.
To power the Nexus 4 smartphone, we configure
the battery simulator’s channel 0 to provide 4.1 V
which corresponds to the voltage of the Nexus 4
battery when fully charged.
2.3 Workstation
The workstation is a Dell T7500 Precision with an
Intel Xeon processor, 12 GB of system memory,
running the Windows 7 Pro operating system. The
workstation connects to the battery simulator
through an MXI-Express card plugged into its PCI
Express. The workstation connects to the
smartphone through either a wireless LAN interface
or through a wired USB interface. When interfacing
smartphone over a USB port, we need to take into
account the energy delivered to the smartphone
through the USB port. This can be done by powering
the USB from the second channel of the battery
simulator. By sampling the current drawn by the
smartphone on this channel, we can account for the
energy received through the USB. This energy is
then combined with the energy measurements on
channel 0 to determine the total energy. To simplify
the profiling, in the rest of the paper, we rely on the
link through the WLAN interface. An alternative is
to disconnect the USB once running scripts are
launched.
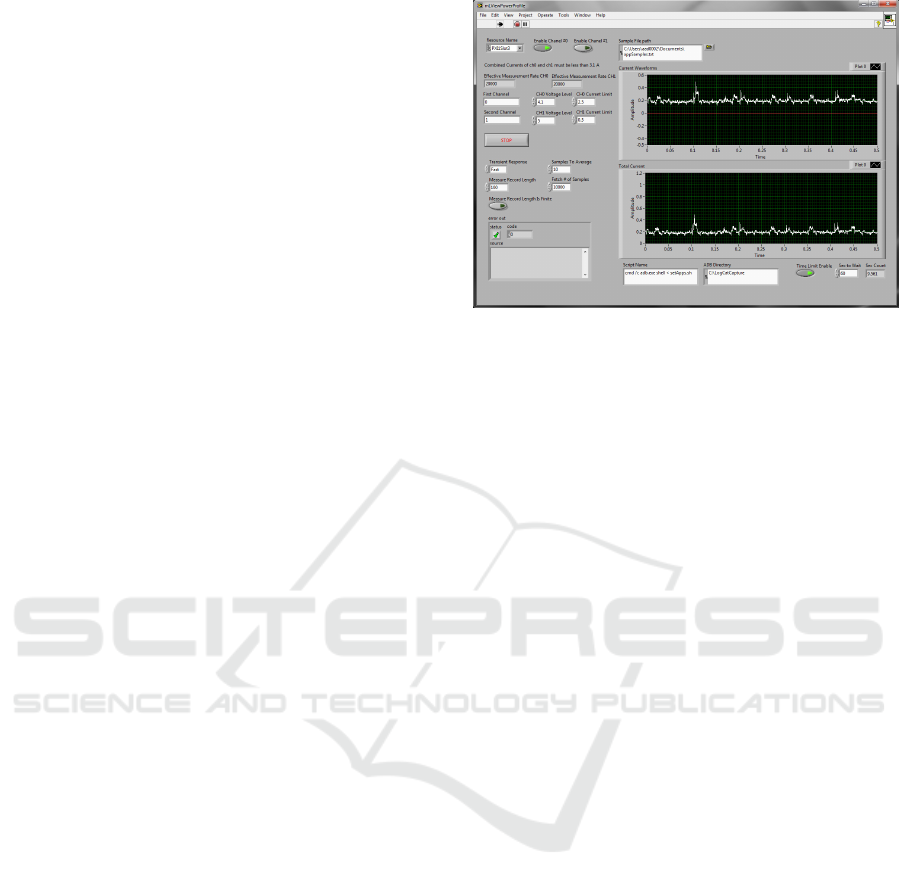
mLViewPowerProfile is our custom software tool
for automated capturing of power traces and
evaluating energy efficiency of applications running
on mobile computing platforms. It runs on the
workstation and controls concurrently both the
battery simulator and the smartphone. Figure shows
the mLViewPowerProfile’s graphical user interface.
A user configures the channels of the battery
simulator. This involves setting the voltage and the
current limits, the sampling frequency, the transient
time, as well as software driver parameters that
control fetching the current samples from the battery
simulator. We sample the current at the maximum
sampling rate of 200,000 samples/s, but we choose
to average 10 samples, thus recording 20,000
samples per second in a user-specified file
(appsSamples.txt).
Figure 4: mLViewPowerProfile user interface.
The communication with the smartphone is
carried out over the Android Debug Bridge (adb)
(Google, 2015). adb is a client-server program that
includes the following components: a client, which
runs on the workstation; a server, which runs as a
background process on the workstation; and a
demon, which runs on the smartphone. The user
establishes an adb connection and runs a script
command file that invokes smartphone applications
or activities that need to be profiled. The following
section demonstrates profiling of Android
applications.
3 POWER PROFILING OF
ANDROID APPLICATIONS
This section describes typical activities in profiling
uninstrumented Android applications. To detect
points of interest for energy profiling, the Android
logging system is used. As an example, we will
consider playing a video located in the smartphone’s
file system.
The first step is to launch a script file to be
executed on the smartphone. mLViewPowerProfile
starts a Windows command shell (cmd) that invokes
the adb shell (adb) and the script file (setupApps.sh)
as shown in Figure (see Script Name command box).
Figure shows the content of the setApps.sh script
file. The first command sets the smartphone’s
working directory where the video file is located
(/sdcard/test). The second command invokes a
command file for playing video, runPlayVideo.sh.
This script file is prepared in advance and placed in
the working directory on the smartphone. The run
video script is executed with the nohup command,
thus ensuring that its execution continues even when
we exit the adb shell. The last two commands are
An Environment for Automated Measuring of Energy Consumed by Android Mobile Devices
31
used to exit the adb shell and the Windows
command shell.
The script file for playing a video file is shown in
Figure 6. The first line sets a 5 seconds delay during
which the smartphone is in the idle state, and the
current drawn by the smartphone corresponds to the
idle current (I
IDLE
). The command in line 2 uses the
Android’s activity manager, am, to start an activity
that plays a video file called FlyingBirds.mkv. The
video is played for approximately 24 seconds,
followed by another delay that puts the smartphone
in the idle state for 5 seconds after the activity is
completed.
1. cd /sdcard/test/
2. nohup ./runPlayVideo.sh &
3. exit
4. exit
Figure 5: ADB Shell script (setApps.sh).
1. sleep 5
2. am start -n com.android.gallery3d/
.app.MovieActivity -d
'file:///sdcard/FlyingBirds.mkv'
3. sleep 24
4. sleep 5
Figure 6: Run-script for playing a video FlyingBirds.mk.
mLViewPowerProfile captures a global
timestamp that corresponds to the first sample and
logs the current samples in a sample file on the
workstation during the execution of the entire script
(~35 seconds). To determine the current samples that
correspond to the beginning and the end of the
activity profiled, the smartphone and the workstation
are synchronized using the network synchronization
protocol and the Android logging system is used to
record global timestamps of events of interest for the
profiled application.
The Android logging system provides a
mechanism for collecting and viewing system debug
output (Google, 2014c). Logs from various
applications and portions of the system are collected
in a series of circular buffers, which then can be
viewed and processed by the logcat command in the
adb shell. Typically, the circular buffers are cleared
before the profiling is conducted using logcat -c
command. After the test is completed, we use logcat
to extract the log messages including timestamps
using the following command:
logcat –d –v time > logcat_output.txt.
Figure 7 shows an excerpt from the logcat output
with messages that are relevant to the profiling task.
The timestamp of the beginning of the script
execution is 18:55:49.633, the activity manager is
started approximately 5 seconds later at
18:55:54.873, the video starts playing at
18:55.55.624 and ends at 18:56:19.457. Thus, the
video playing activity takes 23.8 seconds.
1. --beginning of /dev/log/main
2. 06-11 18:55:49.633 D/AndroidRuntime(
8597): >>>>>> AndroidRuntime START
com.android.internal.os.RuntimeInit
<<<<<<
3. ......
4. --beginning of /dev/log/system
5. 06-11 18:55:54.873
I/ActivityManager( 644): START u0
{dat=file:///sdcard/
FlyingBirds.mkv flg=0x10000000
cmp=com.android.gallery3d/
.app.MovieActivity} from pid 8631
6. ......
7. 06-11 18:55:55.624
E/OMX-VDEC-1080P( 194):
In OMX vdec Constructor
8. ......
9. 06-11 18:56:19.457
E/OMX-VDEC-1080P( 194):
Exit OMXvdec Destructor
Figure 7: Log messages captured on the smartphone
during power profiling of video playing activity.
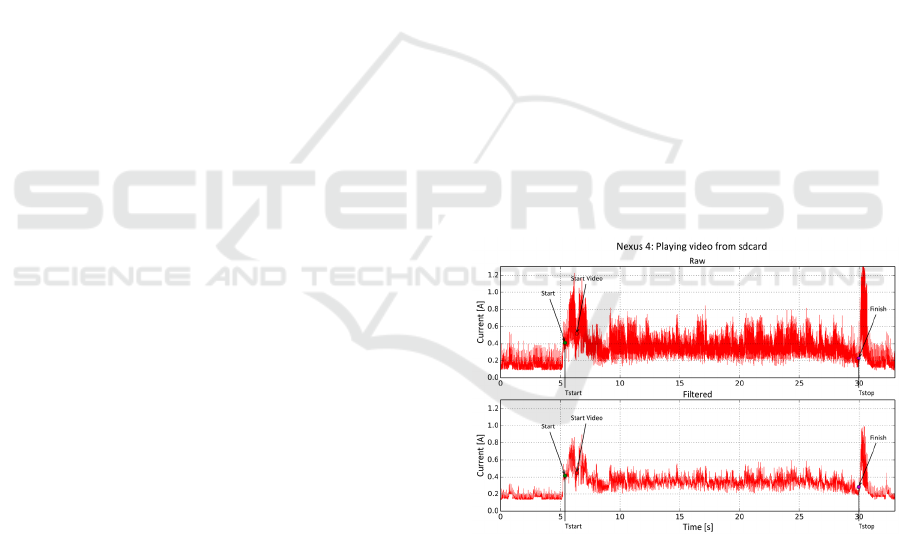
Figure 8: Current drawn by Nexus 4 while playing video.
Figure 8, top, shows the measured current drawn
by the smartphone during the execution of the
runPlayVideo.sh script file. The Start am, Start
Video, and Finish Video marks illustrate the
timestamps that correspond to the moments when
the am command is issued, the video starts playing,
and when the video finishes playing, respectively.
The graph on the bottom shows the filtered
waveform, provided here only to enable easier visual
inspection by a human of the changes in the current
PEC 2016 - International Conference on Pervasive and Embedded Computing
32

drawn. The unfiltered samples, shown in Figure 8,
top, are used to calculate the total energy and the
energy overhead.
To find the total energy, we first determine
offsets of the recorded timestamps relative to the
timestamp that is captured by mLViewPowerProfile
at the beginning of the measurement (T
INIT
= 0 s).
Next, we determine indices of the current samples
that correspond to the beginning (N.SS) and the end
(N.ES) of the execution, calculated from the starting
and ending timestamps and the sampling frequency,
F
S
, as shown in (1) and (2). The total energy, ET, is
then calculated as shown in (3).
In addition to the total energy, we can calculate
the energy overhead, EO, caused by the executing
program alone, which excludes the energy spent
when the smartphone is in the idle state. The energy
overhead is calculated as shown in (4).
.
∙
(1)
.
∙
(2)
.
.
∙
∙∆,∆1/
(3)
∙
∙
(4)
A PERL script takes the processed timestamps and
the file with the current samples as inputs and
calculates the energies. The total energy for playing
video (from Start to Finish Video) is 36.01 J, and the
energy overhead is 16.72 J. If we measure the
energy from the moment the video starts playing, the
energies are 34.91 J and 15.38 J. The measurement
is conducted on Nexus 4 with active LCD display
and WLAN interface.
To determine the impact of powering the LCD
display alone, the experiment is repeated with LCD
display disconnected. The total energy for playing
the video (from Start to Finish Video) is 26.49 J and
the overhead is 15.17 J. These results show that the
display alone takes a significant amount of the total
energy when active. However, a small difference in
the energy overheads (16.72 vs. 15.17 J) indicates
that playing the video does not increase significantly
the energy consumed by the display relative to its
usual consumption when active.
3.1 Profiling Instrumented Android
Applications
In this section, we look at power profiling using our
environment from a developer’s perspective. Here
we assume that a developer wants to determine
energy-efficiency of a certain activity or its segment.
Instead of relying on Android system log messages,
the developer instruments the source code so that
timestamps are generated and logged at points of
interest in the application lifetime.
To help guide energy profiling of particular
segments of applications, software developers can
instrument their Android applications by inserting
custom log messages. Android log messages are
divided into several categories. For example, Log.e()
is used for logging serious errors, Log.w() for
reporting system warnings, Log.i() for information
logging (e.g., successful connection), Log.d() for
debugging messages, and Log.v() for all other
verbose messages (e.g., entering a function). Each
message can be marked by a custom tag.
A typical Android application consists of
different activities that load GUI elements, start
various functions, services, threads, asynchronous
tasks, and intents and provide user interaction via
buttons and other GUI elements that lead to a
transition from one activity to the next. Using
custom log messages a developer can instrument any
part of the application. Particularly, developers may
utilize the Android lifetime cycle’s state methods
such as onCreate(), onStart(), onResume(), onStop(),
onDestroy(), and onRestart(). For example,
onCreate() is called at the initial start of the activity,
while onDestroy() is called at the end of the activity.
To illustrate this approach, we develop a test
Android application, called testZip. testZip
compresses an input file using Android’s
ZipOutputStream class.
1. //onCreate of Compression activity
2. private static final String TAG =
"CompressActivity";
3. @Override
4. public void onCreate(Bundle
savedInstanceState) {
5.super.onCreate(savedInstanceState);
6. setContentView(R.layout.compress);
7. // LogCat message
8. Log.v(TAG, "Starting Compression");
9. // zip function call
10. String inputFile =
"/sdcard/pg32.txt";// input file
path
11. zip(inputFile,"/sdcard/pg32.zip");
12. Log.v(TAG, "Finishing
Compression");
13. }
Figure 9: Instrumenting onCreate() method with verbose
log messages.
An Environment for Automated Measuring of Energy Consumed by Android Mobile Devices
33
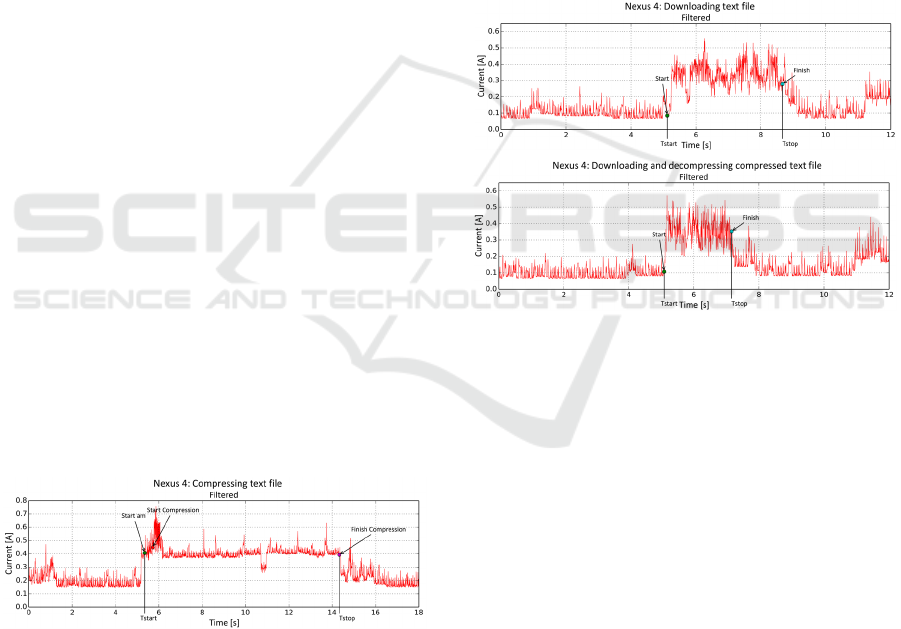
Figure 9 shows its onCreate() method which
calls the zip method right after opening and loading
application layout on the screen. The zip function
compresses an input file and writes the compressed
file in the internal file system. To capture execution
time of this function, the Log.v() messages are
inserted before the compression (line 8) and after the
compression (line 12). Figure 10 shows an excerpt
from the LogCat output with custom messages from
which the starting and ending timestamps can be
extracted and used in energy calculations.
1. 07-30 17:32:04.928
V/CompressActivity(17991): Starting
Compression
2. ...
3. 07-30 17:32:13:696
V/CompressActivity(17991):
Finishing Compression
Figure 10: Log messages with a custom CompressActivity
tag.
Figure 11 shows the filtered measured current
drawn by the smartphone during the execution of a
compression test script. The compression is
preceded and followed by 5 second delays. The Start
Compression and Finish Compression marks
illustrate the timestamps recorded inside the
application before the very start of the compression
activity and after the compression activity is
completed. The activity manager starts the test
application and its interface on the screen at
T
START_AM
= 5.45 s, and the compression activity
itself starts at T
START_COMP
= 5.82 s and finishes at
T
FINISH_COMP
= 14.59 s. The total energy for
compressing the input file is 15.28 J (14.62 J for
compression itself), whereas the overhead energy is
8.17 J (7.80 J).
Figure 11: Current drawn by Nexus 4 while compressing
an input file.
3.2 CyanogenMod Android Setup
In this subsection, we look at power profiling of
Android applications from CyanogenMod Android.
The main difference is that instead of using the
Android logging system for extracting timestamps of
relevant events, we use $EPOCHTIME bash variable
to capture timestamps and write them into a file.
1. cat $EPOCHTIME >>
/data/test/timestamps.txt;
2. sleep 5
3. cat $EPOCHTIME >>
/data/test/timestamps.txt;
4. wget –qP /sdcard/
http://lacasa.uah.edu/portal/tmp/
pg32.txt
5. cat $EPOCHTIME >>
/data/test/timestamps.txt;
6. sleep 5
7. cat $EPOCHTIME >>
/data/test/timestamps.txt;
Figure 12: Run-script for downloading text over WLAN.
Figure 13: Current drawn by Nexus 4 while downloading
a raw text file (top) and a compressed file with
decompression (using gzip utility).
Figure 12 shows a run script,
runDownloadFile.sh, which downloads a text file
from a server using the wget utility. The text file of
15,711,660 bytes (pg32.txt) contains the Project
Gutenberg Works of Mark Twain. The file download
is preceded and trailed with 5 second delays (lines 2
and 6 in the script file) that put the smartphone in the
idle state. Lines 1, 3, 5, and 7 invoke $EPOCHTIME
bash variable to generate timestamps with
nanoseconds resolution that mark the entering of the
script, the moment just before the file download is
started, the moment when the file has finished
downloading, and the moment when the script is
finished. The timestamps are logged in a text file
(timestamps.txt) and used in energy calculations as
described above.
Figure 13, top, shows the filtered measured
current during the execution of the
runDownloadFile.sh script file. The smartphone
PEC 2016 - International Conference on Pervasive and Embedded Computing
34

connects to the local router (Linksys E900 Wireless
N-300) over the WLAN interface. The Start and
Finish marks illustrate the timestamps recorded in
the experiment just before the start of the file
download (line 3 in the script file) and right after the
file downloading has finished (line 5 in the script
file). The current drawn when the smartphone is idle
with the LCD display off is I
IDLE
= 0.10 A. The total
energy consumed by the smartphone to download
the file is 4.85 J and the energy overhead is 3.36 J.
From this measurement, we can use the total energy
to calculate energy efficiency defined as the number
of Megabytes transferred per Joule of energy
consumed, EE(raw download) = 3.09 MB/J
(Milenkovic et al., 2013).
4 CASE STUDIES
This section demonstrates how the measuring setup
can be used to quantify energy needs and improve
energy-efficiency of Android applications.
4.1 To Compress or Not to Compress
Global mobile data traffic continues to grow
exponentially in the last several years. A report from
Cisco states that the global mobile data traffic grew
74% in 2015 relative to 2014, reaching 3.7 exabytes
per month, which is over 44 times greater than the
total Internet traffic in 2000 (Cisco, 2016). Data
compression is crucial in mobile data
communication. It can help improve operating time,
lower communication latencies, and make more
effective use of available bandwidth and storage.
Whereas media data such as video or audio can
tolerate lossy compression that typically achieves
high compression ratios, other types of data typically
consumed on mobile devices such as binaries,
medical data, emails, e-books rely on lossless
compression that achieves modest compression
ratios.
Whether data compression reduces latency and
energy consumption or not on a particular mobile
device depends on many factors. Those factors
include a type of communication interface (e.g.,
Bluetooth, WLAN, cellular), communication
bandwidth, energy costs of communication, the level
of redundancy in the data, and computational
complexity and energy costs of a given compression
or decompression utility.
In this case study we shed more light on this
problem by comparing the energy and performance
costs associated with downloading an e-book from
the Internet. We have already determined the energy
costs of downloading the uncompressed file with the
Project Gutenberg Works of Mark Twain. Using our
environment we measure the time and energy
consumed when the compressed file is downloaded
using wget and piped into the gzip decompressor that
writes the uncompressed file to the file system.
Figure 14 shows a run script that downloads a
compressed text file from a server using the wget
utility and pipes it to the gzip utility for
decompression (line 4).
1. cat $EPOCHTIME >>
/data/test/timestamps.txt;
2. sleep 5
3. cat $EPOCHTIME >>
/data/test/timestamps.txt;
4. wget -qO -
http://lacasa.uah.edu/portal/tmp/
pg32.txt.gz | gunzip -c >
/sdcard/pgwmt.txt
5. cat $EPOCHTIME >>
/data/test/timestamps.txt;
6. sleep 5
7. cat $EPOCHTIME >>
/data/test/timestamps.txt;
Figure 14: Run-script for downloading and decompressing
text over WLAN.
Figure 13, bottom shows the current drawn by
Nexus 4 during the download and decompress
activity. The total energy consumed by the
smartphone is 3.08 J and the energy overhead is 2.21
J. The energy efficiency of this transfer is 4.86
MB/J, which is over 57% improvement relative to
the uncompressed data download.
4.2 To Scale or Not to Scale
Modern SoCs that power mobile devices support
dynamic voltage and frequency scaling where the
clock frequency is adjusted in real-time to either
preserve energy consumed or reduce heat generated
by the chip. The cpufrequtils can be used to inspect
and set clock frequencies for each processor core or
change the CPU governor which determines
frequency scaling policy. Nexus 4 supports a range
of different clock frequencies from 384 MHz to
1512 MHz.
In this case study, we want to repeat the tests
from 4.1, but this time instead of using the on-
demand governor that scales the frequency based on
the current load, we want to set the processor clock
frequency at fixed 810 MHz. Figure shows the
current drawn by Nexus 4 when running at 810
An Environment for Automated Measuring of Energy Consumed by Android Mobile Devices
35
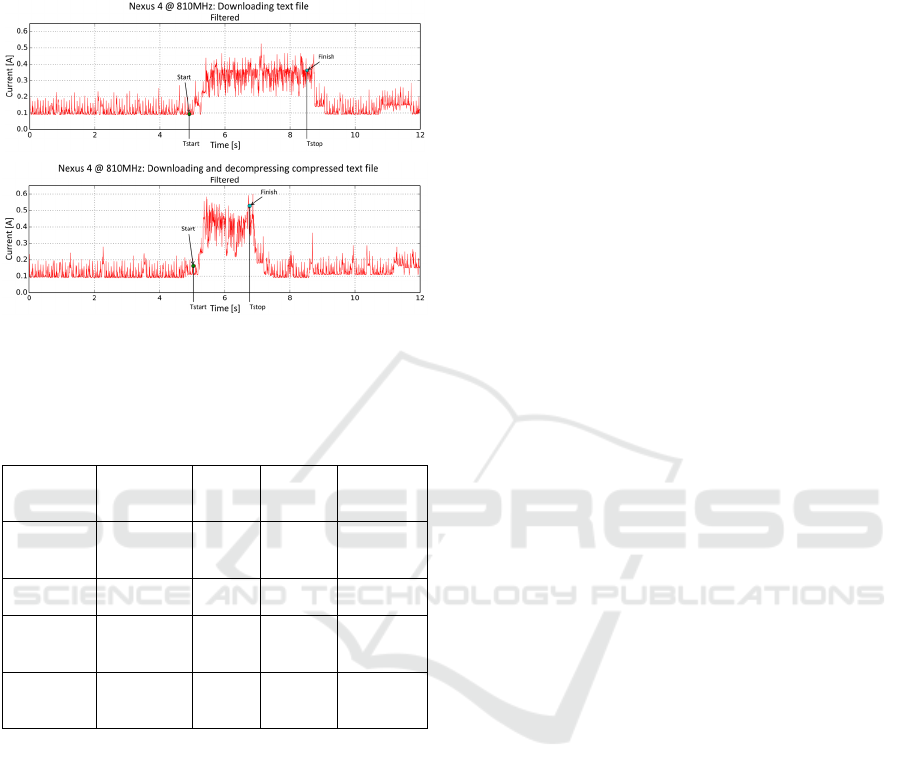
MHz. The top graph shows the current drawn when
downloading the uncompressed text file, and the
bottom graph shows the current drawn for
compressed download with decompression.
Figure 15: Current drawn by Nexus 4 while downloading
a raw text file and a compressed file with decompression
(gzip utility). The frequency is set to fixed 810 MHz.
Table 1: Time and energy for making a phone call:
comparative study.
Activity Frequency
Time
(T) [s]
Total
Energy
(ET) [J]
Energy
Overhead
(OE) [J]
Raw
download
Ondemand
@ 384-
1512 MHz
3.55 4.85 3.36
Raw
download
Fixed @
810 MHz
3.55 4.78 3.09
Zip
download
& unzip
Ondemand
@ 384-
1512 MHz
2.13 3.08 2.21
Zip
download
& unzip
Fixed @
810 MHz
1.72 2.59 1.79
Table 1 summarizes the time and energies for
both experiments. Whereas the uncompressed
download requires the same amount of time (3.55 s),
the total energy consumed and the energy overhead
are slightly lower when running at fixed 810 MHz.
However, the compressed download with
decompression at 810 MHz achieves savings of 19%
in the total energy and 23% in the energy overhead.
Thus, running at lower fixed frequency of 810 MHz
has proved both faster and more energy efficient
than running with on-demand frequency governor.
4.3 To Skype or Not to Skype
Our environment for energy profiling can be used to
provide insights that can help inform regular
smartphone users about energy efficiency of certain
services. To illustrate this we consider making a
phone call to a telephone number. We can do so
using (a) Android phone application over the cellular
interface, (b) Skype utilizing the cellular interface,
or (c) Skype using the WLAN interface. How do
these options compare to each other regarding the
total energy use?
To find an answer to this question, we conduct
several tests as follows. First, the Android phone
application is selected as the default one for making
phone calls. The caller initiates the call in a script
file using the activity manager (am start -a
android.intent.action.CALL tel:256xxxxxxx). The
callee waits for approximately 7 seconds from the
first ring to answer the call and then converses for
approximately 12 seconds. To ensure fairness, the
second test with Skype is carried out in the same
way. The Skype is made the default application to
making calls, and the Skype service is activated to
avoid delays due to starting the application up. The
callee follows the same protocol. During these two
tests, the WLAN interface is turned off. In the third
test, the WLAN is turned on, and the cellular
interface is turned off. The LCD display is on in all
three tests.
Figure 16 shows the current profiles during the
tests. The top graph shows the filtered current traces
when making the phone call using the Android
phone application. We can see that the delay from
the start of the activity manager and until the
establishment of the conversation (including 7
seconds wait time while the callee phone is ringing)
is ~15.4 seconds, and the conversation is ~12
seconds. The total energy for completing the call is
33.06 J, and the energy overhead is 11.66 J. The
middle graph shows the filtered current traces when
making the Skype call that uses the cellular
interface. We can observe a significant delay from
the moment the call is launched until the moment the
callee phone start ringing of almost 35 seconds. The
total energy for the entire activity is 88.80 J, and the
overhead is 51.60 J. Finally, the bottom graph shows
the current traces when making the Skype call that
uses the WLAN interface. In this case, the energies
are slightly higher than in the case of the Android
phone application.
Table 2 summarizes times to establish the
connection and energies for all three tests. The
results indicate that the Android phone application is
the most energy efficient way followed by Skype
over WLAN. Using Skype over the cellular interface
dramatically increases the energy costs of phone
calls.
PEC 2016 - International Conference on Pervasive and Embedded Computing
36
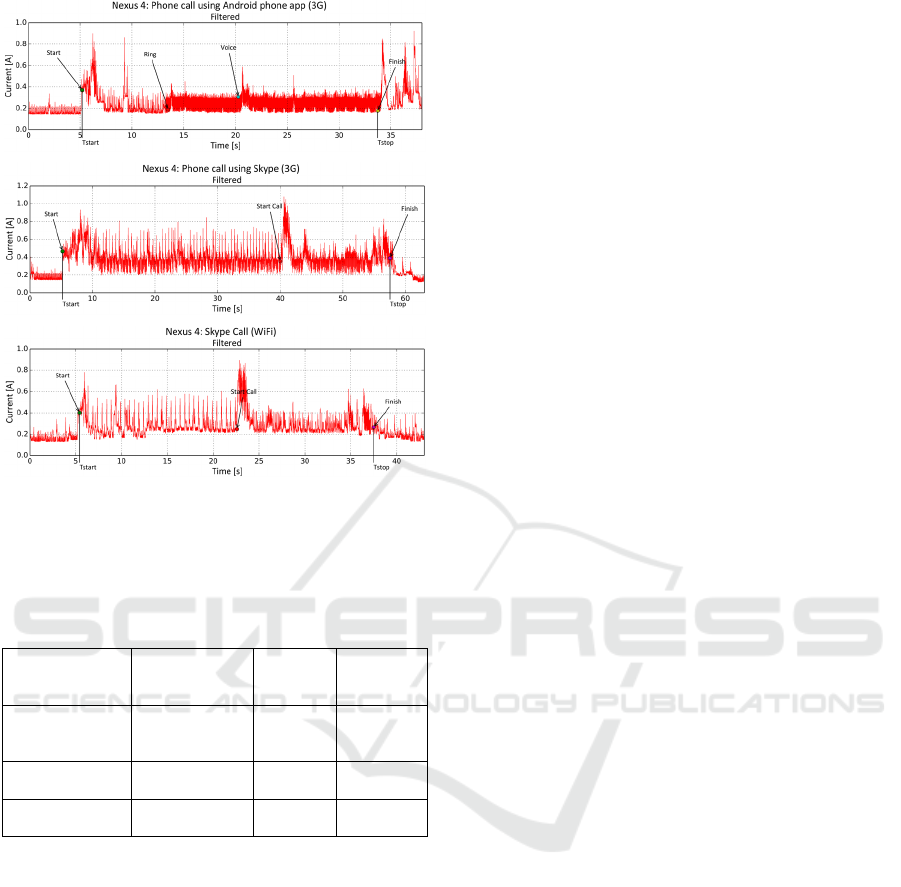
Figure 16: Current drawn by Nexus 4 while making a
phone call using Android phone application (top), Skype
with cellular interface (middle), and Skype with WLAN
interface (bottom).
Table 2: Time and energy for making a phone call:
comparative study.
Activity
Time to
establish
connection [s]
Total
Energy
(ET) [J]
Energy
Overhead
(OE) [J]
Android Phone
over cellular
interface
8.4 33.06 11.67
Skype over
cellular interface
34.75 88.80 51.6
Skype over
WLAN
10.42 38.12 15.79
5 RELATED WORK
We are aware of several related studies that
investigate energy efficiency on mobile devices
using custom measurement environments for
capturing power traces and logging to capture
execution history (Milosevic et al., 2013; Rice and
Hay, 2010a; Shye et al., 2009).
Rice and Hay (Rice and Hay, 2010a) evaluated
energy efficiency of Android-based G1, Magic, and
Hero handsets using their custom measurement
setup. Their setup includes a replacement battery
and a high-precision shunt resistor placed in series
on the power line and an NI data acquisition device
that samples voltage drop across the resistor. Their
excellent studies focused on measurement-based
evaluation and optimization of wireless
communication in mobile handsets. A similar setup
is used in our prior study focusing on energy-
efficiency of Pandaboard and Raspberry Pi
development platforms that run Linux operating
system (Milosevic et al., 2013). The setup included
features to allow automated power measurements for
a number of profiled applications. The setup
proposed in this paper offers several advantages over
the setups introduced in (Milosevic et al., 2013; Rice
and Hay, 2010a). For example, we utilize Android
Debug Bridge (adb) to remotely control the mobile
device and launch script command files for
unobtrusive power measurements. Next, we use
network time synchronization protocol to precisely
capture activities on the mobile device and
synchronize the current samples collected on the
workstation with these activities. Our use of the
battery simulator eliminates any voltage changes
across the shunt resistor due to drainage of the
battery. Additionally, mLViewPowerProfile offers
flexible control and automation of experiments.
A study by Shye et al. (Shye et al., 2009) relies
on power models and extended activity logging to
generate power schemes which can provide
substantial energy saving across the entire system
while maintaining user satisfaction. Their study was
based on Android G1 running Android 1.0 firmware.
They also used a setup based on a shunt resistor to
capture power traces and a custom logger to
generate activity traces. However, their setup offered
a limited sampling frequency of only 1 Hz.
All these studies demonstrated the importance of
having power measurement setup for analyzing
energy consumption on mobile devices. They have
also shown how such measurement setup can be
used to directly achieve energy efficiency
improvements. Using high precision power
measurement environment and logging capabilities,
it is possible to create various power models, power
schemes, or simply to be able to analyze and debug
power consumption of any given task. Our setup
with high sampling frequencies, precise current
readings, and time-synchronized operation can
analyze shorter and discrete activities on mobile
devices to help generate more precise models and
power schemes.
6 CONCLUSIONS
This paper introduces an environment for automated
energy measurements and power profiling of
An Environment for Automated Measuring of Energy Consumed by Android Mobile Devices
37

applications running on Android-based mobile
devices. The environment utilizes a National
Instruments battery simulator which provides an
unobtrusive, high-resolution (down to 1 µA) and
high-frequency sampling (down to 5 µs) of the
current drawn by a mobile device. Our custom
program mLViewPowerProfile running on a
workstation interfaces both the mobile device under
test and the battery simulator to synchronize the
collection of samples from the battery simulator and
running applications on the mobile device.
mLViewPowerProfile connects to the mobile device
over Android debug interface and runs script
commands to allow for a full automation of profiling
with no user intervention.
The paper describes several approaches to
profiling Android applications that give software
developers and researchers an opportunity to gain a
deeper insight into application power requirements.
Finally, we present number of case studies that
demonstrate capabilities of the proposed setup and
its usefulness in increasing energy-efficiency of
mobile devices.
ACKNOWLEDGEMENTS
This work has been supported in part by National
Science Foundation grants CNS-1205439 and CNS-
1217470.
REFERENCES
Bircher, W.L., John, L.K., 2012. Complete System Power
Estimation Using Processor Performance Events.
IEEE Trans. Comput. 61, 563 –577.
doi:10.1109/TC.2011.47.
Carroll, A., Heiser, G., 2010. An analysis of power
consumption in a smartphone, in: Proceedings of the
2010 USENIX Conference on USENIX Annual
Technical Conference, USENIXATC’10. USENIX
Association, Berkeley, CA, USA, pp. 21–21.
Cisco, 2016. Cisco Visual Networking Index: Global
Mobile Data Traffic Forecast Update, 2015–2020
White Paper [WWW Document]. Cisco. URL
http://cisco.com/c/en/us/solutions/collateral/service-
provider/visual-networking-index-vni/mobile-white-
paper-c11-520862.html (accessed 2.13.16).
CyanogenMod, 2014. CyanogenMod | Android
Community Operating System [WWW Document].
URL http://www.cyanogenmod.org/ (accessed
6.14.14).
Gartner, Inc., 2016. Worldwide Device Shipments to
Grow 1.9 Percent in 2016, While End-User Spending
to Decline for the First Time [WWW Document].
URL http://www.gartner.com/newsroom/id/3187134
(accessed 2.13.16).
Google, 2015. Android Debug Bridge | Android
Developers [WWW Document]. URL
http://developer.android.com/tools/help/adb.html
(accessed 6.14.15).
Google, 2014a. Nexus - Google [WWW Document]. URL
http://www.google.com/intl/all/nexus (accessed
6.15.14).
Google, 2014b. Android [WWW Document]. URL
http://www.android.com/ (accessed 6.20.14).
Google, 2014c. Log | Android Developers [WWW
Document]. URL http://developer.android.com/
reference/android/util/Log.html (accessed 8.3.14).
IDC, 2016. Apple, Huawei, and Xiaomi Finish 2015 with
Above Average Year-Over-Year Growth, as
Worldwide Smartphone Shipments Surpass 1.4 Billion
for the Year, According to IDC [WWW Document].
www.idc.com. URL http://www.idc.com/getdoc.jsp?
containerId=prUS40980416 (accessed 2.13.16).
Li, T., John, L.K., 2003. Run-time modeling and
estimation of operating system power consumption.
SIGMETRICS Perform Eval Rev 31, 160–171.
doi:10.1145/885651.781048.
Milenkovic, A., Dzhagaryan, A., Burtscher, M., 2013.
Performance and Energy Consumption of Lossless
Compression/Decompression Utilities on Mobile
Computing Platforms, in: Modeling, Analysis
Simulation of Computer and Telecommunication
Systems (MASCOTS), 2013 IEEE 21st International
Symposium on. pp. 254–263.
doi:10.1109/MASCOTS.2013.33.
Milenkovic, A., Milenkovic, M., Jovanov, E., Hite, D.,
Raskovic, D., 2005. An environment for runtime
power monitoring of wireless sensor network
platforms, in: System Theory, 2005. SSST’05.
Proceedings of the Thirty-Seventh Southeastern
Symposium on. pp. 406–410.
Milosevic, M., Dzhagaryan, A., Jovanov, E., Milenković,
A., 2013. An Environment for Automated Power
Measurements on Mobile Computing Platforms, in:
Proceedings of the 51st ACM Southeast Conference,
ACMSE ’13. ACM, New York, NY, USA, p. 6.
doi:10.1145/2498328.2500064.
NI, 2014a. NI PXIe-4154 - National Instruments [WWW
Document]. URL
http://sine.ni.com/nips/cds/view/p/lang/en/nid/209090
(accessed 6.20.14).
NI, 2014b. NI PXIe-1073 - National Instruments [WWW
Document]. URL http://sine.ni.com/nips/cds/view/
p/lang/en/nid/207401 (accessed 6.20.14).
Pathak, A., Hu, Y.C., Zhang, M., 2012. Where is the
energy spent inside my app?: fine grained energy
accounting on smartphones with Eprof, in:
Proceedings of the 7th ACM European Conference on
Computer Systems, EuroSys ’12. ACM, New York,
NY, USA, pp. 29–42. doi:10.1145/2168836.2168841.
Pathak, A., Hu, Y.C., Zhang, M., Bahl, P., Wang, Y.-M.,
2011. Fine-grained power modeling for smartphones
using system call tracing, in: Proceedings of the Sixth
PEC 2016 - International Conference on Pervasive and Embedded Computing
38

Conference on Computer Systems, EuroSys ’11.
ACM, New York, NY, USA, pp. 153–168.
doi:10.1145/1966445.1966460.
Qualcomm, 2014. Snapdragon
TM
Mobile Processors -
Qualcomm Developer Network [WWW Document].
URL https://developer.qualcomm.com/discover/
chipsets-and-modems/snapdragon (accessed 6.20.14).
Rice, A., Hay, S., 2010a. Measuring mobile phone energy
consumption for 802.11 wireless networking.
Pervasive Mob. Comput., Special Issue PerCom 2010
6, 593–606. doi:10.1016/j.pmcj.2010.07.005.
Rice, A., Hay, S., 2010b. Decomposing power
measurements for mobile devices, in: 2010 IEEE
International Conference on Pervasive Computing and
Communications (PerCom). Presented at the 2010
IEEE International Conference on Pervasive
Computing and Communications (PerCom), pp. 70–
78. doi:10.1109/PERCOM.2010.5466991.
Shye, A., Scholbrock, B., Memik, G., 2009. Into the wild:
Studying real user activity patterns to guide power
optimizations for mobile architectures, in: 42nd
Annual IEEE/ACM International Symposium on
Microarchitecture, 2009. MICRO-42. Presented at the
42nd Annual IEEE/ACM International Symposium on
Microarchitecture, 2009. MICRO-42, pp. 168–178.
An Environment for Automated Measuring of Energy Consumed by Android Mobile Devices
39
