
Study on the Use of Deep Neural Networks for Speech Activity Detection
in Broadcast Recordings
Lukas Mateju, Petr Cerva and Jindrich Zdansky
Faculty of Mechatronics, Informatics and Interdisciplinary Studies,
Technical University of Liberec, Studentska 2, 461 17 Liberec, Czech Republic
Keywords:
Deep Neural Networks, Speech Activity Detection, Speech Recognition, Speech Transcription.
Abstract:
This paper deals with the task of Speech Activity Detection (SAD). Our goal is to develop a SAD module
suitable for a system for broadcast data transcription. Various Deep Neural Networks (DNNs) are evaluated
for this purpose. Training of DNNs is performed using speech and non-speech data as well as artificial data
created by mixing of both these data types at a desired level of Signal-to-Noise Ratio (SNR). The output
from each DNN is smoothed using a decoder based on Weighted Finite State Transducers (WFSTs). The
presented experimental results show that the use of the resulting SAD module leads to a) a slight improvement
in transcription accuracy and b) a significant reduction in the computation time needed for transcription.
1 INTRODUCTION
An important part of speech signal pre-processing
is identifying all segments containing speech. This
process, known as Speech Activity Detection (SAD),
is beneficial for a wide variety of speech process-
ing applications including speech enhancement and
transcription or speaker and language recognition. In
the case of broadcast recordings, which usually con-
tain a large portion of non-speech events, utilization
of a SAD module can not only speed up the pro-
cess of transcription but also improve the transcrip-
tion accuracy. For example, a one-hour recording of
radio programming containing numerous advertise-
ments, songs and music can be trimmed to a set of
a few utterances with a total duration of several tens
of seconds.
In recent years, various approaches for SAD have
been proposed. For example, methods based on
Gaussian Mixture Models (GMMs) (Ng et al., 2012),
DNNs (Ryant et al., 2013) (Ma, 2014), Convolu-
tional Neural Networks (CNNs) (Saon et al., 2013)
or Recurrent Neural Networks (RNNs) (Hughes and
Mierle, 2013) have been successfully used. More
complex models (mostly combinations of those men-
tioned above) are being employed as well (Thomas
et al., 2015), (Zhang and Wang, 2014) and (Wang
et al., 2015).
Similar to the model architecture of SAD, feature
vector extraction methods also have substantial in-
fluence on accuracy. Therefore, a large amount of
research work has been put into crafting more ro-
bust features (Zhang and Wang, 2014), (Wang et al.,
2015), (Thomas et al., 2012), (Graciarena et al.,
2013), and (Sriskandaraja et al., 2015) recently.
The main goal of this paper is to develop a SAD
module suitable for transcription of broadcast record-
ings that are specific by containing jingles, advertise-
ments, music and various noises in the background. A
transcription system for broadcast recordings comple-
mented with this module should have its Word Error
Rate (WER) on a level similar to a system without any
SAD module while its transcription speed should be
higher, as SAD prevents the non-speech frames from
being transcribed.
To achieve this goal, DNNs are first adopted and
trained on a set compiled from recordings of clean
speech, music and various noises. After that, the in-
formation about speech/non-speech frames from the
neural network is smoothed using Weighted Finite
State Transducers (WFSTs) to obtain the final out-
put of detection. To further improve accuracy, multi-
condition training is adopted by using artificial data,
which is created by mixing clean speech and non-
speech events at a desired level of Signal-to-Noise Ra-
tio (SNR). Moreover, DNNs trained with different a)
sizes of the input feature vectors and b) widths of hid-
den layers are also investigated. Experimental eval-
uation of all of these SAD approaches is performed
on hand-annotated broadcast data belonging to sev-
Mateju, L., Cerva, P. and Zdansky, J.
Study on the Use of Deep Neural Networks for Speech Activity Detection in Broadcast Recordings.
DOI: 10.5220/0005952700450051
In Proceedings of the 13th International Joint Conference on e-Business and Telecommunications (ICETE 2016) - Volume 5: SIGMAP, pages 45-51
ISBN: 978-989-758-196-0
Copyright
c
2016 by SCITEPRESS – Science and Technology Publications, Lda. All rights reserved
45

eral Slavic languages and using three different met-
rics.
Finally, the influence of the resulting SAD module
on accuracy and speed of transcription is also eval-
uated using a set of recordings of various broadcast
programs.
This paper is structured as follows: The evalua-
tion metrics used for the speech activity detection as
well as the speech recognition are described in Sec-
tion 2. The process of development and evaluation
of the SAD module is presented in Section 3. The re-
sults of application of the final SAD approach to a real
system for broadcast data transcription are then sum-
marized in Section 4. Finally, the paper is concluded
in Section 5.
2 EVALUATION METRICS
In this section, evaluation metrics for speech activity
detection (2.1) as well as speech recognition (2.2) are
presented.
2.1 Speech Activity Detection
Within this work, three different frame-dependent
metrics are evaluated.
The first metric, Frame Error Rate (FER), is de-
fined to evaluate the overall performance of the sys-
tem on the test data as:
FER[%] =
M
N
∗ 100, (1)
where M is the number of non-matching frames in the
reference and the decoded output, and N is the total
number of frames in the reference.
The other two metrics symbolize false negatives
(missed speech frame rate) and false positives (missed
non-speech frame rate). The rest of the relevance
measures are not presented as they are complemen-
tary to the presented metrics.
Missed speech frame rate or Miss Rate (MR) is
defined as:
MR[%] =
M
speech
N
speech
∗ 100, (2)
where M
speech
is the number of misclassified speech
frames, and N
speech
is the total number of reference
frames.
Similarly, missed non-speech frame rate or False
Alarm Rate (FAR) is defined as follows:
FAR[%] =
M
non−speech
N
non−speech
∗ 100, (3)
where M
non−speech
is the number of misclassified non-
speech frames, and N
non−speech
is the total number of
frames referenced.
Note that the optimal SAD approach should min-
imize the false negatives while keeping the false pos-
itives reasonably low. The reason is that the tar-
get speech recognition system should transcribe all
speech frames with only limited non-speech events
added.
2.2 Speech Recognition
Two metrics are used to evaluate the performance of
speech recognition. The first one, Word Error Rate
(WER), is defined as follows:
W ER[%] =
I + S + D
N
∗ 100, (4)
I is a count of insertions marking words the recog-
nizer added to its output, D stands for the number of
deletions (deleted words), S is the number of substi-
tutions, and N is the total number of words in the ref-
erence text.
Another important factor of speech recognition is
the speed of decoding. It can be measured using Real-
Time Factor (RTF), which can be expressed as:
RT F =
T
PT
, (5)
where T is the duration of the recording and PT is
the processing time of the decoding. Enlarging RTF
means speeding up the decoding.
3 DEVELOPMENT OF THE SAD
MODULE
3.1 Data Used for Evaluation
Two different datasets were used in the development
of the SAD module.
The first broadcast set consisted of TV and ra-
dio recordings in several Slavic languages including
Czech, Slovak, Polish, and Russian. These record-
ings contained jingles, music and various noises and
their total length was 6 hours. Their annotations
were created in two steps: at first, the baseline DNN-
based decoder was employed to produce automatic
speech/non-speech labels that were then corrected
manually. As a result of this process, approximately
70% of the frames were labeled as containing speech.
The remaining frames were annotated by non-speech
labels.
SIGMAP 2016 - International Conference on Signal Processing and Multimedia Applications
46
In contrast to the first evaluation set, the sec-
ond one was compiled just from recordings contain-
ing clean speech (50%) and clean music recordings
(50%). Their total length was 2 hours.
3.2 Baseline DNN-based Detector
The baseline speech/non-speech detector utilized a
deep neural network with a binary output. The data
used for the training of this network contained 30
hours of clean speech (in several Slavic languages and
English), 30 hours of music and one hour of record-
ings of non-speech events, e.g., jingles and noises.
The sampling frequency was 16 kHz. The network
had five hidden layers, each consisting of 128 neu-
rons. ReLU activation function and mini-batches of
size 1024 were utilized within 15 epochs of training.
The learning rate was 0.08 and was kept constant dur-
ing the training. 39-dimensional log filter banks were
employed for feature extraction. The input vector for
DNN had a length of 51 and was formed by concate-
nating 25 preceding frames, the current frame and the
25 frames that followed. The frame length was 25 ms
with a frame shift of 10 ms. Input data was normal-
ized locally within one-second long windows. Note
that the torch library
1
was used for this training.
The results obtained by the baseline DNN-based
detector are summarized in Table 1. They show that,
on broadcast data, it achieves 5.56% FER while miss-
ing close to 6% of speech frames (MR). It is also evi-
dent that it performs significantly better on clean data
with FER of 1.39%. On the other hand, the yielded
MR of 2% is still too high and may have a significant
negative influence on the accuracy of transcription.
Table 1: Results using baseline DNN-based SAD.
Dataset FER [%] MR [%] FAR [%]
Broadcast 5.56 5.59 5.46
Clean 1.39 2.30 0.48
3.3 DNN-based Detector with
Smoothing
As mentioned in the previous section, the baseline
decoder classifies every input feature vector (frame)
independently. On the other hand, every speech or
non-speech segment usually lasts for at least several
frames.
That means that, although the SAD module oper-
ates at a suitable level of FER, it still produces a high
number of transitions between speech and non-speech
1
http://torch.ch
frames that do not exist. This fact leads to an increase
in WER during transcription as the frames marked as
non-speech are omitted from being transcribed.
Therefore, our next efforts were focused on
smoothing the output from DNN. For this purpose,
weighted finite state transducers were utilized using
the OpenFst library
2
.
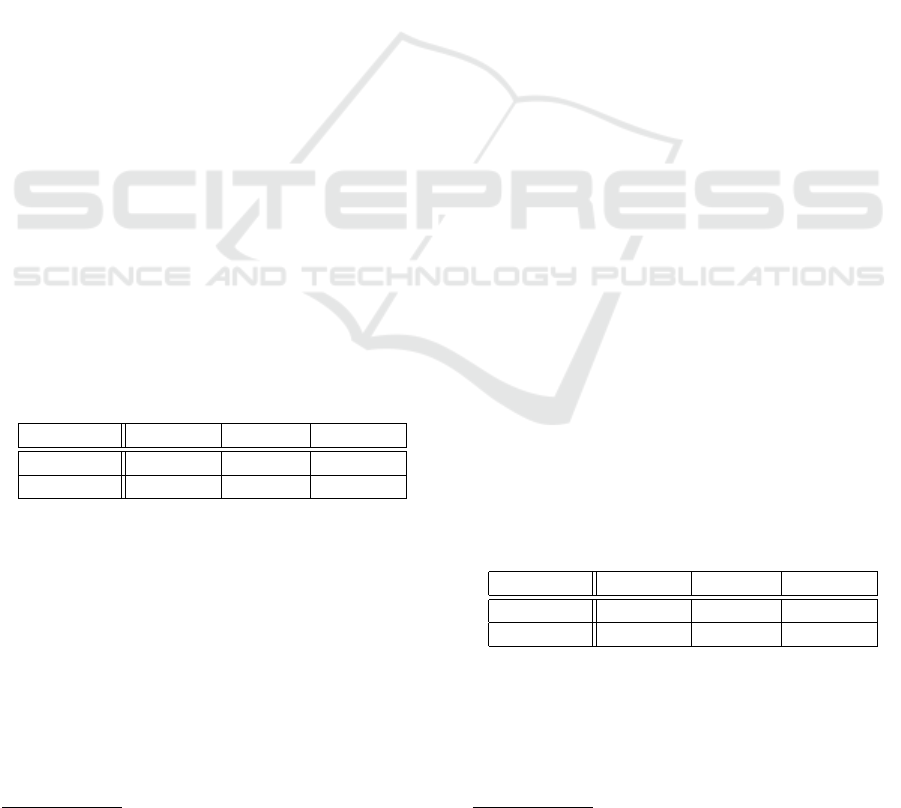
The resulting scheme consists of two transduc-
ers. The first models the input speech signal (see
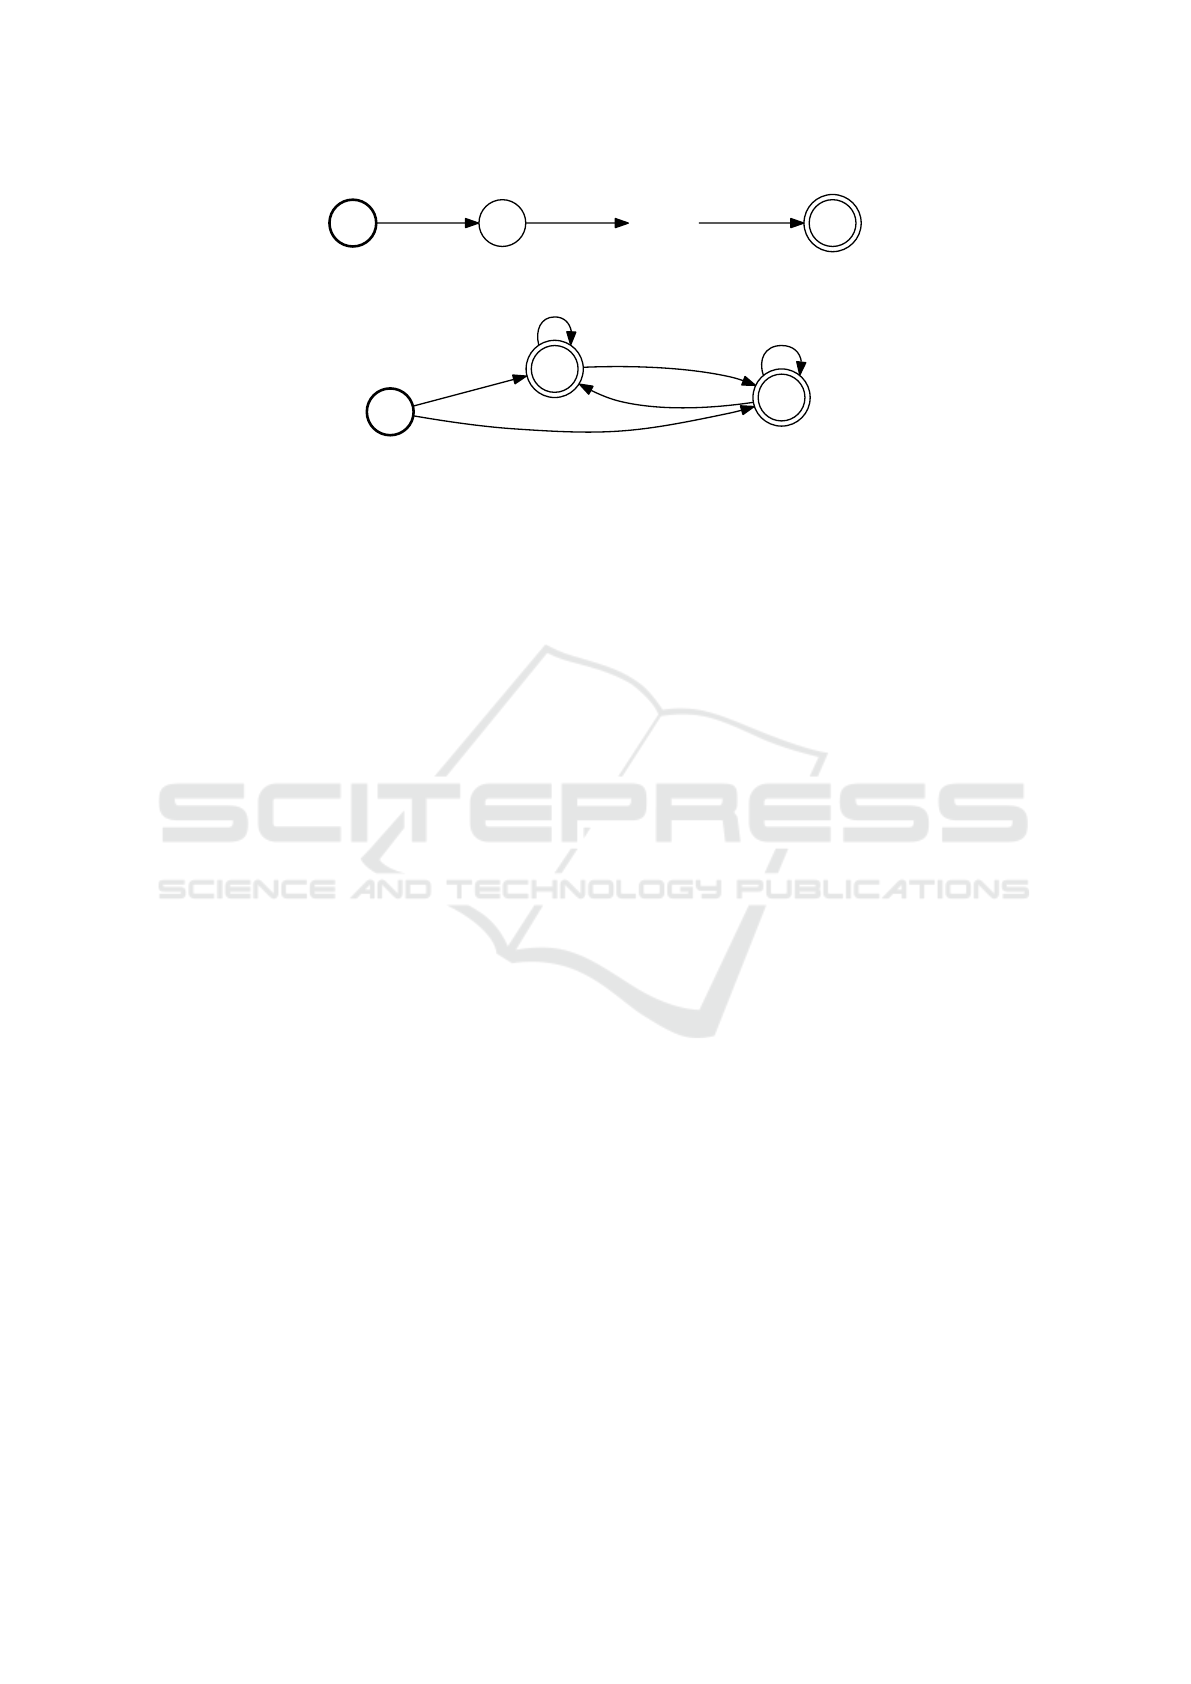
Figure 1). The second one, the transduction model,
represents the smoothing algorithm and is depicted in
Figure 2. It consists of three states. The first state,
noted as 0, is the initial state. The transitions between
states 1 and 2 emit the corresponding labels.
The transition between these two states is penal-
ized by penalty factors P1 and P2. Their values (500
and 500) were determined in several experiments not
presented in this paper.
Given the two described transducers, the decoding
process is performed using on-the-fly composition of
the transduction and the input model of an unknown
size. This is possible since the input is considered
to be a linear-topology, un-weighted, epsilon-free ac-
ceptor. After each composition step, the shortest-path
(considering tropical semiring) determined in the re-
sulting model is compared with all other alternative
hypotheses. When a common path is found among
these hypotheses (i.e., with the same output label), the
corresponding concatenated output labels are marked
as the final fixed output. Since the rest of the best path
is not certain, it is denoted as a temporary output (i.e.,
it can be changed later in the process).
From the results of the next performed experiment
(see Table 2), it is evident that smoothing leads to
significant improvement in the accuracy of the DNN-
based detector. On broadcast data, FER as well as MR
were reduced by more than 2%, and similar reduction
in all error rates can also be seen on the clean dataset.
Therefore, the DNN-based detector with WFST-
based smoothing was utilized for all further evalua-
tions.
Table 2: Results using DNN-based SAD with smoothing.
Dataset FER [%] MR [%] FAR [%]
Broadcast 3.26 2.97 4
Clean 0.61 0.73 0.48
3.4 Using Artificial Training Data
Results of the two previous experiments showed that
the detector yields good error rates on clean-speech
data. However, the accuracy of the system starts to
2
http://www.openfst.org/twiki/bin/view/FST/WebHome
Study on the Use of Deep Neural Networks for Speech Activity Detection in Broadcast Recordings
47
1 ...
frame 1
T+10
frame 0 frame T
Figure 1: The transducer modeling the input signal.
1
speech
2
non-s peech/P1
speech/P2
non-s peech
0
speech
non-s peech
Figure 2: The transducer representing the allowed transitions of the state decoder.
diminish on the broadcast recordings. The reason is
that the speech data used for the DNN training were
recorded in clean conditions (they originally served
for training of a speech recognition system).
Thus in the next step, the aim of our work was to
extend the training speech dataset by adding record-
ings containing non-speech events, e.g., music or jin-
gles. The lack of such annotated data forced us to cre-
ate an artificial dataset by mixing 30 hours of clean
speech and 30 hours of non-speech recordings. To
each speech recording a non-speech counterpart (its
volume was increased or decreased) was added to
achieve the desired SNR that was chosen randomly
from the interval between -30 dB and 50 dB. The la-
bels were produced automatically. When the SNR
value of the given recording was higher than a defined
threshold, the recording was marked as speech. In the
opposite case, the recording was included in a group
of non-speech recordings. In the end we obtained 30
hours of new training data.
To determine a suitable value of the SNR thresh-
old, another experiment was carried out where thresh-
old values of 0, 5 and 10 dB were evaluated. Results
of this experiment are summarized in Table 3.
The results show that the use of training data cre-
ated by mixing speech and non-speech recordings
leads to better results. A significant reduction in FER
as well as MR was observed for all thresholds.
It is also evident that lowering the SNR thresh-
old increases the amount of mixed data that is marked
as speech so that the classification of speech is im-
proved and, on the contrary, the system produces a
higher number of false non-speech segments. This is
especially noticeable for broadcast data. Here, with
the threshold set to 0 dB, the decoder is misclassi-
fying only 0.24% of speech while FAR is increased
by almost 6.5%. On the other hand, the value of the
threshold does not affect the results on clean data that
much, as the SNR of the utterances is mostly further
from the threshold.
Considering the target application of the decoder,
the threshold value of 5 dB seems to be optimal. The
reason is that decreasing of the SNR threshold (to 0)
increases the number of non-speech frames that are
being used for speech recognition. All of the remain-
ing experiments thus utilize mixed data with the SNR
threshold set to 5 dB.
3.5 Effect of the Size of the Feature
Vector
Is has been shown that the length of the input feature
vector is an important factor for DNN training. There-
fore, our subsequent efforts were focused on an exper-
iment which investigates the influence of this variable
on accuracy of the DNN-based SAD module.
Results of this experiment in Table 4 show that
the length of the input feature vector significantly in-
fluences the accuracy of the system. The best results
were reached for the size of 25-1-25. This in particu-
lar applies to the broadcast set.
On both sets, the shortest feature vector reduced
MR slightly more, but this fact was unfortunately
compensated by a higher number of misclassified
non-speech frames.
It should also be noted that an important factor for
choosing the optimal length of the feature vector is
the computation time needed for decoding. This time
is 2 and 1.7 times lower for short and medium win-
dow lengths, respectively, than for long feature vec-
tors. Therefore, the feature vector size of 25-1-25 was
chosen as the optimal one and it is used in the detec-
tor.
3.6 Effect of Width of the Hidden
Layers
The last experiment conducted within this paper in-
vestigates the influence of the width of the hidden lay-
ers. The use of DNNs with a small width could reduce
computation demands of the SAD module.
SIGMAP 2016 - International Conference on Signal Processing and Multimedia Applications
48
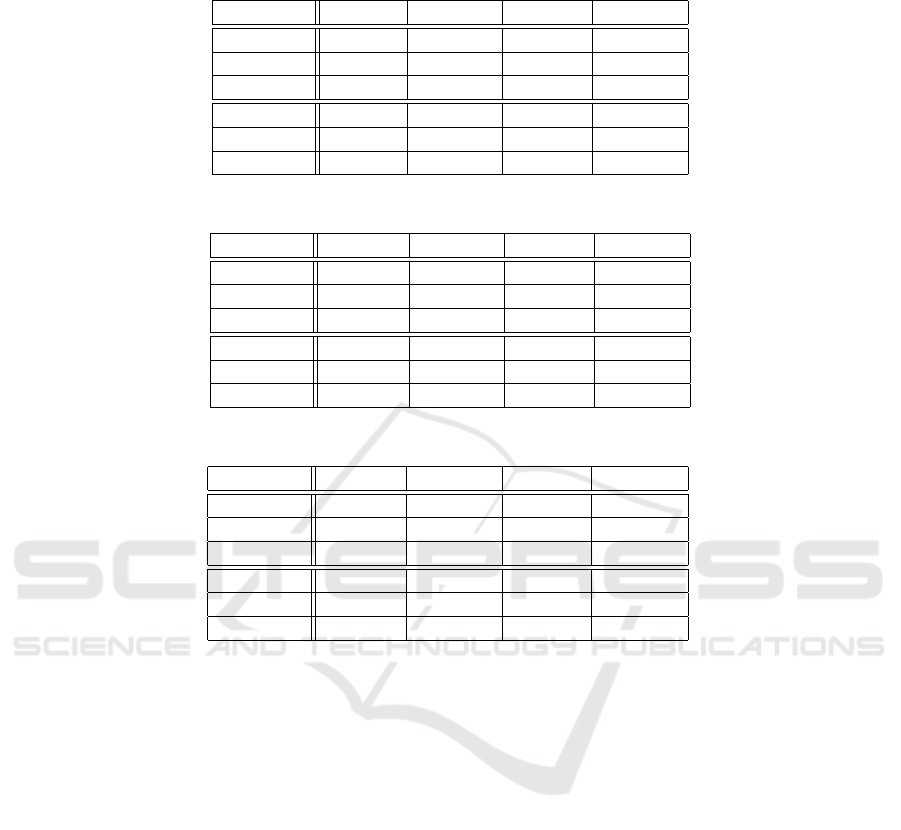
Table 3: Results after the use of additional training data created by mixing speech and non-speech recordings with different
values of the SNR threshold.
Dataset Th [dB] FER [%] MR [%] FAR [%]
Broadcast 0 2.94 0.24 9.83
Broadcast 5 2.14 0.50 6.34
Broadcast 10 1.91 1.26 3.57
Clean 0 0.33 0.04 0.64
Clean 5 0.27 0.04 0.50
Clean 10 0.28 0 0.56
Table 4: Effect of the size of the feature vector.
Data Features FER [%] MR [%] FAR [%]
Broadcast 5-1-5 2.62 0.48 8.08
Broadcast 25-1-25 2.14 0.50 6.34
Broadcast 80-1-80 2.81 1.12 7.11
Clean 5-1-5 0.25 0 0.50
Clean 25-1-25 0.27 0.04 0.50
Clean 80-1-80 0.59 0 1.17
Table 5: Effect of width of the hidden layers.
Dataset Neurons FER [%] MR [%] FAR [%]
Broadcast 64 2.05 0.62 5.7
Broadcast 128 2.14 0.50 6.34
Broadcast 256 2.27 0.49 6.81
Clean 64 0.32 0 0.63
Clean 128 0.27 0.04 0.50
Clean 256 0.37 0 0.74
The results of this experiment (see Table 5) show
that the smaller the net, the more speech segments are
missed and the number of misclassified non-speech
frames is reduced. The difference in missed speech
frames between the networks with widths of 128 and
256 is negligible. On the other hand, it is more notice-
able between the smallest and the middle networks.
A slightly different behavior can be observed on the
clean data, where the network with a width of 128
neurons per hidden layer performs the best. As a
compromise between missed speech and missed non-
speech frames on both sets, the network with a width
of 128 neurons per layer is chosen as a final model.
4 THE USE OF THE SAD
MODULE IN A SPEECH
RECOGNITION SYSTEM
The performance of the resulting SAD module was
evaluated in a speech transcription system.
For this purpose, recordings of Czech broadcast
news were utilized. Their length was 4 hours and
they contained 22,204 words. In total, 60% of these
recordings consisted of frames containing speech.
The transcription system used the acoustic model
based on DNN-HMM architecture presented first
in (Dahl et al., 2012). These models were trained on
270 hours of speech data. For the detailed information
about GMM-HMM model, see (Mateju et al., 2015).
The parameters used for the DNN training were as
follows: 5 hidden layers with decreasing numbers of
neurons per hidden layer (1024-1024-768-768-512),
ReLU activation function, mini-batches of size of
1024, 35 training epochs, and a learning rate of 0.08.
For signal parametrization, log-filter banks were used
with the context window of 5-1-5. Local normaliza-
tion was performed within one-second windows.
The linguistic part of the system was composed of
lexicon and language models. The lexicon contained
550k entries with multiple pronunciation variants.
The employed LM was based on N-grams. For practi-
cal reasons (mainly with respect to the very large vo-
cabulary size), the system used bigrams. However, 20
percent of all word-pairs actually include sequences
Study on the Use of Deep Neural Networks for Speech Activity Detection in Broadcast Recordings
49

containing three or more words, as the lexicon con-
tains 4k multi-word collocations. The unseen bigrams
are backed-off by Kneser-Ney smoothing (Kneser and
Ney, 1995).
4.1 Experimental Results
Within the performed experiment, the data for testing
were transcribed a) with and b) without the use of the
SAD module. The obtained results in terms of WER
and RTF are presented in Table 6.
They show that the use of the SAD module has ad-
vantages from accuracy as well speed of transcription
points of view: WER was slightly reduced by 0.22%
and RTF increased to almost twice the baseline value.
The reason is that most of the non-speech parts were
omitted from being recognized. The RTF of the SAD
module itself is around 85, making its computation
demands almost negligible. Note that the presented
RTF values were measured using Intel Core proces-
sor i7-3770K @ 3.50GHz.
Table 6: Evaluation of the resulting SAD module in a
speech transcription system.
SAD module used WER [%] RTF
No 12.67 1.29
Yes 12.45 2.44
5 CONCLUSIONS
Various DNN-based SAD approaches are evaluated in
this paper. Our goal was to find a method that could
be used in a system for transcription of broadcast data.
All of the findings obtained from the evaluation pro-
cess can be summarized as follows:
• Smoothing the output from DNN is essential as it
reduces the residual misclassified frames.
• The use of mixed data according to SNR leads to
a significant increase in the accuracy of detection.
• The context frame window of 25-1-25 performed
as the best while keeping the processing time low.
• The DNN with 128 neurons/layer showed to be a
compromise between the detection accuracy and
computation demands.
• RTF of the final SAD module is around 80, which
makes its computation demands almost negligi-
ble.
The advantages of using the resulting SAD ap-
proach (based on DNNs, smoothing and the use of
artificial training data) in a speech transcription sys-
tem can be summarized as follows:
• The yielded speech recognition accuracy is com-
parable or even slightly better.
• The data is transcribed almost two times faster.
Considering that the computation demands of the
SAD module itself are almost negligible, the time
savings for the transcription is significant.
In our future work, we plan to consider context-
dependent transduction models, which could better
represent the transitions between speech and non-
speech segments. Other neural network architectures,
e.g., convolution neural networks, recurrent neural
networks or even residual neural networks could also
be employed.
ACKNOWLEDGEMENTS
This work was supported by the Technology Agency
of the Czech Republic (Project No. TA04010199) and
partly by the Student Grant Scheme 2016 of the Tech-
nical University in Liberec.
REFERENCES
Dahl, G., Yu, D., Deng, L., and Acero, A. (2012).
Context-dependent pre-trained deep neural networks
for large-vocabulary speech recognition. Audio,
Speech, and Language Processing, IEEE Transactions
on, 20(1):30 –42.
Graciarena, M., Alwan, A., Ellis, D., Franco, H., Ferrer, L.,
Hansen, J. H. L., Janin, A., Lee, B. S., Lei, Y., Mi-
tra, V., Morgan, N., Sadjadi, S. O., Tsai, T. J., Schef-
fer, N., Tan, L. N., and Williams, B. (2013). All for
one: feature combination for highly channel-degraded
speech activity detection. In Bimbot, F., Cerisara, C.,
Fougeron, C., Gravier, G., Lamel, L., Pellegrino, F.,
and Perrier, P., editors, INTERSPEECH, pages 709–
713. ISCA.
Hughes, T. and Mierle, K. (2013). Recurrent neural net-
works for voice activity detection. In ICASSP, pages
7378–7382. IEEE.
Kneser, R. and Ney, H. (1995). Improved backing-off for
m-gram language modeling. In In Proceedings of the
IEEE International Conference on Acoustics, Speech
and Signal Processing, volume I, pages 181–184, De-
troit, Michigan.
Ma, J. (2014). Improving the speech activity detection for
the darpa rats phase-3 evaluation. In Li, H., Meng,
H. M., Ma, B., Chng, E., and Xie, L., editors, INTER-
SPEECH, pages 1558–1562. ISCA.
Mateju, L., Cerva, P., and Zdansky, J. (2015). Investiga-
tion into the use of deep neural networks for lvcsr
of czech. In Electronics, Control, Measurement, Sig-
nals and their Application to Mechatronics (ECMSM),
2015 IEEE International Workshop of, pages 1–4.
SIGMAP 2016 - International Conference on Signal Processing and Multimedia Applications
50

Ng, T., 0004, B. Z., Nguyen, L., Matsoukas, S., Zhou, X.,
Mesgarani, N., Vesel, K., and Matejka, P. (2012). De-
veloping a speech activity detection system for the
darpa rats program. In INTERSPEECH, pages 1969–
1972. ISCA.
Ryant, N., Liberman, M., and Yuan, J. (2013). Speech activ-
ity detection on youtube using deep neural networks.
In Bimbot, F., Cerisara, C., Fougeron, C., Gravier, G.,
Lamel, L., Pellegrino, F., and Perrier, P., editors, IN-
TERSPEECH, pages 728–731. ISCA.
Saon, G., Thomas, S., Soltau, H., Ganapathy, S., and Kings-
bury, B. (2013). The ibm speech activity detection sys-
tem for the darpa rats program. In Bimbot, F., Ceris-
ara, C., Fougeron, C., Gravier, G., Lamel, L., Pel-
legrino, F., and Perrier, P., editors, INTERSPEECH,
pages 3497–3501. ISCA.
Sriskandaraja, K., Sethu, V., Le, P. N., and Ambikairajah,
E. (2015). A model based voice activity detector for
noisy environments. In INTERSPEECH, pages 2297–
2301. ISCA.
Thomas, S., Mallidi, S. H. R., Janu, T., Hermansky, H.,
Mesgarani, N., Zhou, X., Shamma, S. A., Ng, T.,
0004, B. Z., Nguyen, L., and Matsoukas, S. (2012).
Acoustic and data-driven features for robust speech
activity detection. In INTERSPEECH, pages 1985–
1988. ISCA.
Thomas, S., Saon, G., Segbroeck, M. V., and Narayanan,
S. S. (2015). Improvements to the ibm speech activ-
ity detection system for the darpa rats program. In
ICASSP, pages 4500–4504. IEEE.
Wang, Q., Du, J., Bao, X., Wang, Z.-R., Dai, L.-R., and
Lee, C.-H. (2015). A universal vad based on jointly
trained deep neural networks. In INTERSPEECH,
pages 2282–2286. ISCA.
Zhang, X.-L. and Wang, D. (2014). Boosted deep neu-
ral networks and multi-resolution cochleagram fea-
tures for voice activity detection. In Li, H., Meng,
H. M., Ma, B., Chng, E., and Xie, L., editors, INTER-
SPEECH, pages 1534–1538. ISCA.
Study on the Use of Deep Neural Networks for Speech Activity Detection in Broadcast Recordings
51
