
Introducing Redundancy in the Radio Planning of LPWA Networks for
Internet of Things
Pedro Vieira
1,2
, Andr
´
e Martins
1,3
and Tiago Cunha
3
1
Instituto de Telecomunicac¸
˜
oes, Lisbon, Portugal
2
Instituto Superior de Engenharia de Lisboa (ISEL), Lisbon, Portugal
3
Celfinet, Consultoria em Telecomunicac¸
˜
oes, Lisbon, Portugal
Keywords:
Internet of Things, Low-Power-Wide-Area Networks, Radio Planning, Redundancy.
Abstract:
This paper presents an enhanced methodology in order to introduce redundancy requirements in the Low-
Power Wide-Area (LPWA) networks radio planning for Internet-of-Things (IoT). The Jake’s Curves were
extended, allowing to compute new log-normal fading margins which traduce combined coverage and redun-
dancy requirements. The methodology was applied developing a LPWA SIGFOX network simulator for a
typical urban environment. The double and triple redundancy requirement produced a 10 dB increase in the
log-normal fading margin, reducing the cell range to one half, which roughly quadruples the site density. In
fact, assuring redundancy enhances the networks’s quality of experience, but strongly increases the network
investment in base-station equipment and site acquisition. This new approach allowed to compute new site
grids and to introduce the concept of assisted planning for IoT networks, where the most suitable candidates
among a site list will be automatically chosen, avoiding the inefficient and ineffective trial and error method
in radio planning.
1 INTRODUCTION
Nowadays, Telecom engineers are being challenged
to plan and deploy LPWA networks that can connect
to modules requiring a single AA battery for 10 years
of life time, and which will cost less than 5 euro
each (Tom Rebbeck, Michele Mackenzie and Nuno
Afonso, 2014).
This challenge is, in fact, already in motion, since
LPWA networks are being built worldwide, boost-
ing Machine-to-Machine (M2M) connections and the
IoT.
It is believed that LPWA services can target a mar-
ket of over 3 billion M2M connections by 2023 and
generating over USD10 billion from connectivity rev-
enues alone. LPWA networks open new market op-
portunities due to:
1. Low Cost. By selling cheap terminals and an-
nual connectivity for some applications, LPWA
networks will enable connectivity to a wide range
of different services, from Smart Cities to agricul-
tural and environment driven businesses.
2. No Power Source Required. By producing a wire-
less service that can operate for years using the
same batteries, it opens the door to other markets,
like gas and water metering.
3. Strong Propagation. The strong link budget
with Maximum Allowed Path Loss (MAPL) val-
ues reaching 165 dB allows deploying less base-
stations for the same coverage area, when com-
pared with the traditional cellular solutions. Also
it allows reaching deep indoor locations, which
enables, for example, connecting meters located
in basements and sensors monitoring sewer con-
ditions.
Many of the LPWA technologies operate in
license-exempt spectrum. Whereas license-exempt
spectrum has some benefits, such as rapid time to mar-
ket and no spectrum fees, clear disadvantages also ex-
ist, such as the lack of control and the likelihood of
interference.
Concerning the chosen wireless technology, the
ability to re-use the existing network infrastructure
is very attractive for the already existing operators.
Integrating LPWA services with the existing network
infrastructure will reduce roll-out time, on going sup-
port and cost.
The technologies Clean-Slate (W. Guibene and K.
Vieira, P., Martins, A. and Cunha, T.
Introducing Redundancy in the Radio Planning of LPWA Networks for Internet of Things.
DOI: 10.5220/0005957701370144
In Proceedings of the 13th International Joint Conference on e-Business and Telecommunications (ICETE 2016) - Volume 6: WINSYS, pages 137-144
ISBN: 978-989-758-196-0
Copyright
c
2016 by SCITEPRESS – Science and Technology Publications, Lda. All rights reserved
137

E. Nolan and M. Y. Kelly, 2015) and Long Term Evo-
lution (LTE) Machine-Type-Communications (MTC)
(3GPP, 2014) or NB-IoT are being developed to be
integrated with existing 2G, 3G and LTE networks.
For these technologies, the aspects of network up-
grade are being clarified; it may be as simple as a
remote software upgrade but more likely hardware
changes will be required, but with no modifications
to the needed antennas. In contrast, proprietary tech-
nologies like SIGFOX, On-Ramp and Semtech (G.
Margelis and R. Piechocki and D. Kaleshi and P.
Thomas, 2015), require a purpose-built network to de-
ploy their services. For the existing operators, this
means still using existing sites, but additional integra-
tion and infrastructure, including antenna and base-
station equipment, should be required. For a new op-
erator entering in this market, the green field approach
is possible, although new operators should perform
agreements with the existent ones in order to perform
site-sharing and reduce costs.
Whatever the case, sites have to be chosen among
a (internal or external) site list, in order to fulfil cover-
age and capacity requirements. Moreover, when con-
sidering LPWA technologies, often base-station re-
dundancy must be met, i.e., coverage requirements
should be set not only for the serving base-station but
also for neighbour base-stations, which should pro-
vide redundant coverage. This assures that the LPWA
time diversity gain is achieved, hence enabling the up-
link driven performance of small terminals, simulta-
neously connecting to up to three base-stations.
Coverage requirements are usually integrated us-
ing the Jakes approach (Jakes, William C. and Cox,
Donald C., 1994). Starting from a coverage area re-
quirement which is usually high (90% to 95% is typ-
ical), a log-normal fading margin is computed, which
conditions the MAPL and the cell radius calculation,
during the initial link budget. The cell radius and site
distance is, in fact, the basis for producing a theoret-
ical site grid, where the site locations are pin-pointed
in order to commit the coverage requirements.
The aim of this paper is to present an enhanced
methodology in order to extend the Jakes curves to
scenarios where site redundancy is required, such as
the LPWA networks. This allows to compute new site
grids and to introduce the concept of assisted planning
for LPWA networks, where the most suitable candi-
dates among a site list will be automatically chosen,
avoiding the inefficient and ineffective ”trial and er-
ror” method.
The paper is organized as follows. Section 2
overviews the original Jake’s curves and the cover-
age area probability determination. In the sequence,
the extended Jakes curves are developed, consider-
ing redundancy, as simulations results are presented.
Section 3 presents a case study for urban environ-
ment where the new results are applied to single, dou-
ble and triple redundancy. Section 4 overviews the
developed radio planning simulator, developed from
scratch for this project, along with the introduction
to the assisted planning concept. Finally, conclusions
are drawn in section 5.
2 DETERMINATION OF
COVERAGE AREA
PROBABILITY
This section presents the research work around ex-
tending the Jakes area coverage probability for LPWA
networks when considering site redundancy. Firstly,
past work as in (Jakes, William C. and Cox, Don-
ald C., 1994), (Rappaport, Theodore, 2001) will be
overviewed. Secondly, the authors’ additional work
will follow.
2.1 The Jakes Approach for Computing
of the Coverage Area Probability
Due to random effects of shadowing (large-scale fad-
ing) some locations within the base-station surround-
ings will presents coverage problems, i.e., will be un-
der a certain received signal threshold. It is often use-
ful to compute how the border coverage reloads to
the amount of area covered within the border. For
a circular coverage area with radius R centred on the
base-station, let there be some desired received signal
threshold γ.
In the following, the percentage of useful service
area, i.e. the percentage of area with the received sig-
nal higher or equal to γ, U (γ), is given as a known
likelihood of coverage at the cell border.
Let d represent the radial distance from the base-
station. It can be shown that if Prob(P
r
(r) > γ) is the
probability that the random received signal power, P
r
,
at d = r exceed the threshold γ within an incremental
area dA, then U (γ) is given by,
U (γ) =
1
πR
2
Z
[Prob(P
r
(r) > γ)] dA =
1
πR
2
Z
2π
0
Z
R
0
[Prob(P
r
(r) > γ)] rdrdθ
(1)
where,
[Prob(P
r
(r) > γ)] = Q
γ −P
r
(r)
σ
!
(2)
WINSYS 2016 - International Conference on Wireless Networks and Mobile Systems
138

P
r
(r) is the distance dependent received signal
mean power, and Q(z) is defined as,
Q(z) =
1
√
2π
Z
∞
z
e
−
x
2
z
dx =
1
2
h
1 −e
z
√
2
i
. (3)
As in (D. C. Cox and R. R. Murray and A. W. Nor-
ris, 1984), (P. Vieira and P. Queluz and A. Rodrigues,
2007), measurements have shown that for any value
of d, the path loss, at a particular location d, PL(d), is
random and log-normally distributed around the mean
distance dependent value.
Hence,
PL (d) [dB] = PL (d
0
) + X
σ
=
PL (d
0
) + 10nlog
d
d
0
+ X
σ
(4)
where PL (d
0
) is the mean path loss at a reference dis-
tance d
0
, n is the path loss decay and X
σ
is a zero-
mean Gaussian random variable with standard devi-
ation σ (in dB). Moreover, the distance dependent
received power from the base-station P
r
(d) depends
also on the base-station radiated power, P
t
,
P
r
(d) [dBm] = P
t
[dBm] −PL (d)[dB]. (5)
In order to determine the path loss as referenced
to the cell boundary (r = R), it is clear that,
PL (r) = 10nlog
R
d
0
+10nlog
r
R
+PL (d
0
) (6)
and equation (2) can be expressed as:
[Prob(P
r
(r) > γ)] =
Q
γ −
h
P
t
−10nlog
R
d
0
+ 10nlog
r
R
+ PL (d
0
)
i
σ
(7)
2.2 The Enhanced Approach
considering Base-station
Redundancy
Consider the general implementation scenario pre-
sented in Figure 1. The base stations are placed on
a regular grid, with fixed inter-site distances and po-
sitioned using a non-orthogonal 60
0
Cartesian pair of
axis (u,v). Each base-station will consider a service
area limited by a cell radius, R.
Using this coordinate system, the distances r
i
from
base-station i to a generic point P can be calculated as:
v
u
(0,1)
(0,0)
(1,0 )
r
2
r
3
r
1
P
R3
Figure 1: General implementation scenario.
r
1
=
q
3(u
2
+ uv + v
2
)R (8)
r
2
=
r
3
u
2
+ u(v −1) + (v −1)
2
R
(9)
r
3
=
r
3
(u −1)
2
+ (u −1)v + v
2
R
(10)
Starting up at equation (7) by choosing the signal
level such that P
r
(R) = γ, γ is given by,
γ = P
t
−PL(d
0
) −10nlog
R
d
0
(11)
Additionally, γ is being chosen in order to equal
the mean received signal strength at the cell border,
therefore for the Q2 (50%) percentile. It can be use-
ful to consider a quite higher cell boundary γ cover-
age probability, which can be added in the following
way. Consider LNF
marg
as the shadow fading margin
which changes the cell boundary coverage probabil-
ity to a pre-defined value, typically higher than 50%.
The probability of the received signal strength being
higher than γ, where γ is the signal strength threshold
which guarantees the predefined cell border probabil-
ity is, based on equation (7), and given by,
[Prob(P
r
(r) > γ)] = Q
10nlog
r
R
−LNF
marg
σ
!
(12)
Moreover, and as stated, LPWA networks often
demand signal strength redundancy, i.e., base-station
radio planning should by performed considering that
each terminal should have a coverage level not only
Introducing Redundancy in the Radio Planning of LPWA Networks for Internet of Things
139
dependent on the serving base-station (best server),
but also from the surrounding base-stations. The re-
dundancy level, K, which is the number of base-
station that assures coverage is, in fact, an initial ra-
dio planning requirement, ranging from one to usually
three, and dependent on the radio environment and the
operator demand.
If received signal strength independence is as-
sumed between the transmitting base stations, which
is valid considering a macro cell-topology with cell
ranges of several kilometres, the signal strength cov-
erage area probability with redundancy will be given
by,
U (γ) =
1
πR
2
Z
2π
0
Z
R
0
[Prob(P
r
(r) > γ)]rdrdθ =
3
π
Z
u
Z
v
K
∏
i=1
Q
10nlog
r
i
R
−LNF
marg
σ
!
u
2
+v
2
≤
1
3
(13)
With this approach, the coverage area percentage
will be integrated within the serving cell radius R, but
considering not only the server base-station but also
the neighbour base-station coverage levels.
Moreover, a redundancy gain should be added,
since the radio connection will assume multiple radio
links affected by independent shadow fading. Spe-
cially along the serving cell border, shadow fading
can significantly change the serving cell received sig-
nal strength, which will enable the connection being
handovered to the surrounding cells, if the latter are in
better radio connections. Hence, a combination gain
must be added.
If combination by selection is set, the receiving
terminal will consider the best cell for each location
and the redundant coverage area probability is com-
puted by,
U (γ) =
3
π
Z
u
Z
v
K
∏
i=1
Q
10nlog
r
i
R
−LNF
marg
+ 10nlog
min(r
i
)
r
i
σ
u
2
+v
2
≤
1
3
(14)
with r
1
,r
2
and r
3
given by equations (8), (9) and (10),
respectively.
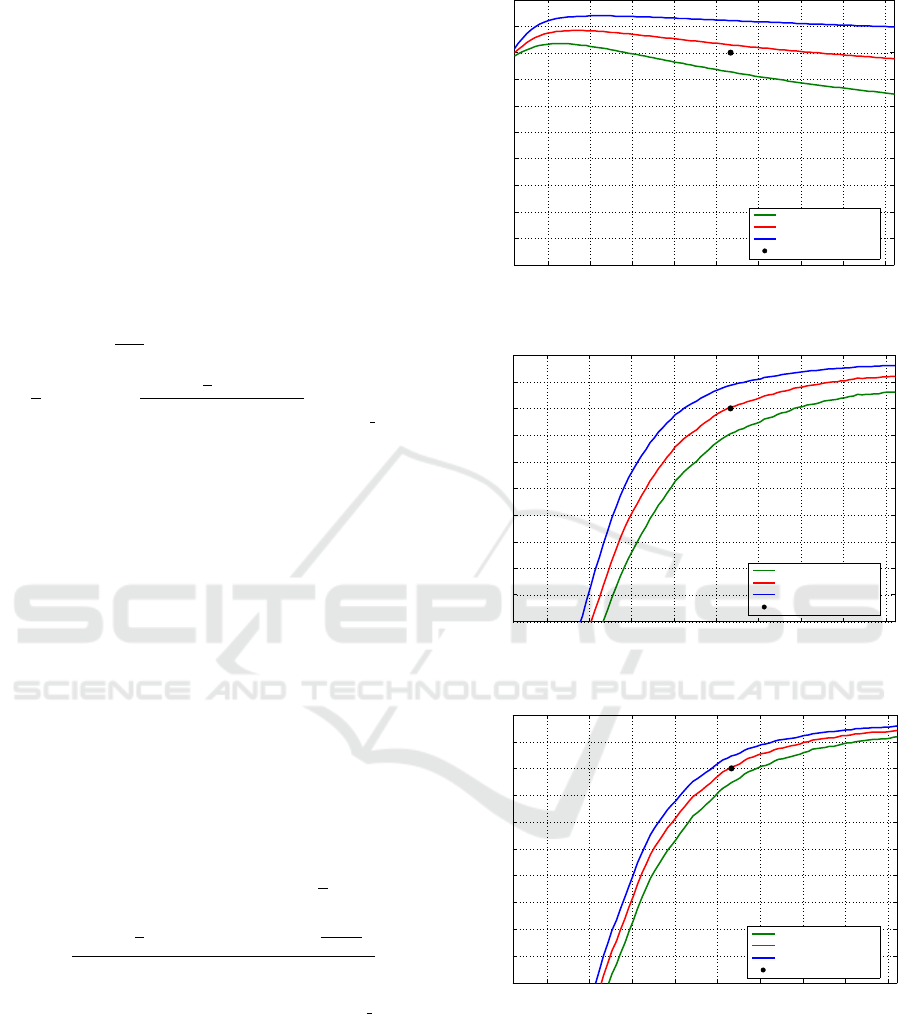
Figures 2, 3 and 4 present the coverage area prob-
abilities (in %) as a function of σ/n for several values
of border coverage, and for redundancy levels of one,
two and three base-stations, respectively. σ is the re-
ceived signal strength standard deviation (in dB) and
n in the propagation decay. Hence, the σ/n parameter
characterizes the radio environment.
0.5 1 1.5 2 2.5 3 3.5 4 4.5
50%
55%
60%
65%
70%
75%
80%
85%
90%
95%
100%
σ /n [dB]
Area Coverage [%]
70% @ Cell Border
80% @ Cell Border
90% @ Cell Border
Coverage Requirement
Figure 2: Area coverage for single redundancy.
0.5 1 1.5 2 2.5 3 3.5 4 4.5
50%
55%
60%
65%
70%
75%
80%
85%
90%
95%
100%
σ /n [dB]
Area Coverage [%]
96% @ Cell Border
97.8% @ Cell Border
99% @ Cell Border
Coverage Requirement
Figure 3: Area coverage for double redundancy.
0.5 1 1.5 2 2.5 3 3.5 4 4.5
50%
55%
60%
65%
70%
75%
80%
85%
90%
95%
100%
σ /n [dB]
Area Coverage [%]
99% @ Cell Border
98.6% @ Cell Border
98% @ Cell Border
Covergae Requirement
Figure 4: Area coverage for triple redundancy.
The curves were produced based on simulations
and are the key for the LPWA network initial plan-
ning, considering redundancy. Firstly, the coverage
area and redundancy level requirements are set, along
with the radio environment characterization, building
a triplet. Using the simulations, the triplet allows to
index the border coverage level, which is used to com-
pute the log-normal fading margin that reflects the ini-
WINSYS 2016 - International Conference on Wireless Networks and Mobile Systems
140

tial requirements.
As an example, let us map the triplet in the previ-
ous figures, but considering the case study values pre-
sented in the next section 3 . A black ”dot” represents
90% coverage area (y-axis), in a typical urban envi-
ronment with n = 3 and σ = 8 dB (σ/n, x-axis). Con-
sidering a redundancy increase from single to triple,
the border coverage probability for the focused en-
vironment, strongly increases, as expected. The as-
sociated log-normal fading margin, computed from a
log-normal distribution for the considered probability
also steps up, affecting the link budget and initial di-
mensioning.
Moreover, the log-normal fading margin in intro-
duced in the LPWA link budget. Along with the log-
normal fading margins, and for the considered tech-
nology, parameters like transmit power, receiver sen-
sitivity, antenna gain, cable and combiner losses, re-
ceiver Low Noise Amplifier (LNA) gain, and pene-
tration losses are used to calculate the MAPL. Then,
and using a large-scale propagation model, typically
tuned for the used frequency band, the cell range and
site distance is calculated, allowing to reach a theoret-
ical site location grid that mirrors the LPWA techno-
logical specifics, along with coverage and redundancy
requirements.
For a chosen environment, a higher coverage area
requirement produces a higher border coverage prob-
ability, increasing the log-normal fading margin and
reducing the cell range. The redundancy level re-
quirement has a strong impact in the log-normal fad-
ing margin, which rapidly grows, and originating a
reduced cell radius. If strong redundancy is an issue,
the site density will increase, along with the needed
investment concerning number of base-stations. This
will be properly quantified under a case-study in the
next section.
3 A CASE STUDY FOR URBAN
ENVIRONMENT USING
SIGFOX
The methodology was applied to a LPWA network in
a typical urban environment with n = 3 and σ = 8
dB. It is assumed that terminals are placed inside the
buildings, hence, a 15 dB penetration loss is con-
sidered. A large-scale propagation model was used
for the path loss calculations, after being tuned with
RF measurements. The coverage area requirement is
90%, and 3 scenarios are set, using single, double and
triple redundancy, respectively (K = 1,2,3).
The chosen LPWA technology was SIGFOX,
which was picked as an example. It should be high-
lighted that the presented methodology is transversal
to all point-to-area wireless technologies, which de-
pend on a coverage area requirement.
SIGFOX is an LPWA operated telecommunica-
tion technology, dedicated to the IoT, currently de-
ployed in Western Europe, San Francisco, and with
ongoing tests in South America and Asia. It oper-
ates on sub-GHz frequencies, on ISM bands : 868
MHz in Europe/ETSI and 902MHz in the USA/FCC.
SIGFOX uses an Ultra-Narrow Band (UNB) modu-
lation, With a 162 dB budget link SIGFOX enabling
long range communications. In uplink, the 14 dBm
terminals transmit to the closest base-stations, which
decode the signals and forward them to the network
back-end.
Table 1 presents the log-normal fading margin
(LNF
marg
), cell range (R), inter-site distance (ISD)
and site density (SD) for single, double and triple re-
dundancy.
Table 1: Simulation results.
K LNF
marg
R ISD SD
[dB] [km] [km] [site/km
2
]
1 5.91 2.17 3.75 8.18 ×10
−2
2 16.19 1.12 1.94 30.68 ×10
−2
3 17.47 1.03 1.78 36.28 ×10
−2
For the typical urban environment, the double and
triple redundancy requirement produces a huge 10
dB increase in the log-normal fading margin, reduc-
ing the cell range to one half, which roughly quadru-
ples the site density. In fact, assuring redundancy en-
hances the network quality, but also strongly increases
the network investment in base-station equipment and
site acquisition.
4 THE IoT RADIO PLANNING
SIMULATOR
In order to apply the developed methodology and to
considerer not only the link budget approach but also
to produce spatial simulations, a coverage prediction
simulator was developed for IoT network planning.
Section 4.1 will overview the simulator’s architecture
and section 4.2 will introduce the concept of assisted
planning.
Introducing Redundancy in the Radio Planning of LPWA Networks for Internet of Things
141
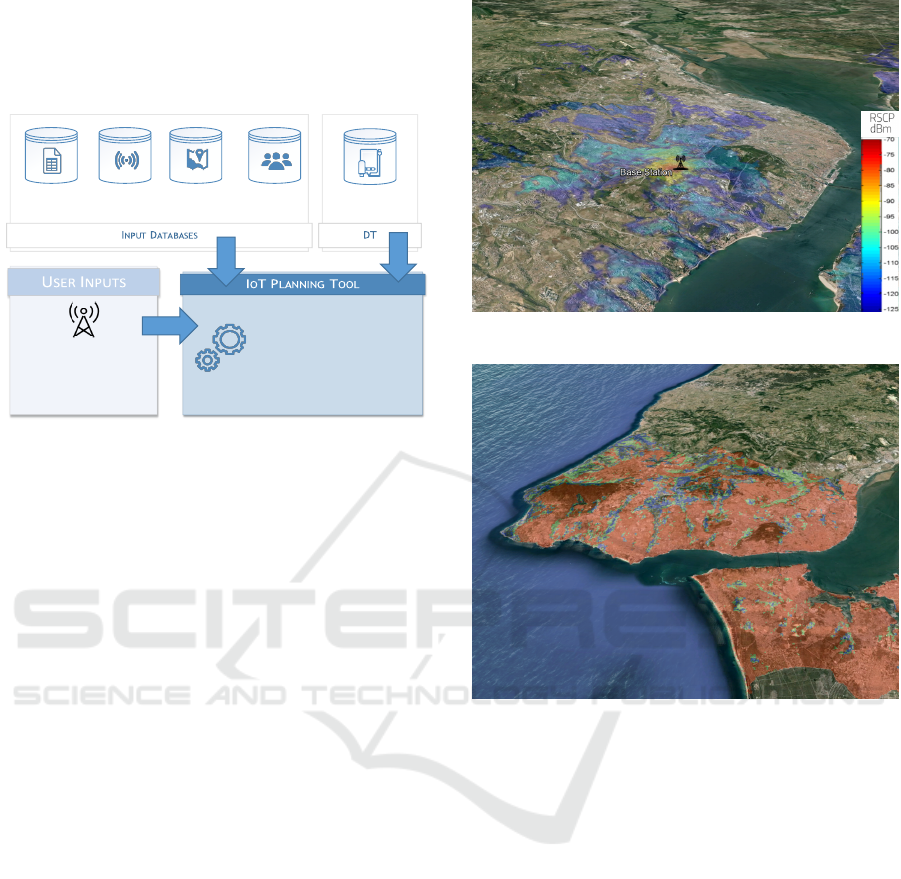
4.1 Planning Tool Architecture
The simulator was developed in C#, and its architec-
ture is presented in Figure 5.
VISFOX PLANNING TOOL
› PRODUCT DESCRIPTION
5
› CELFINET © 2015
NEW SOLUTIONS
SITE LOCATION & ANTENNA HEIGHT:
SITE SHARING (MOBILE NETWORKS)
GREENFIELD PLANNING
LOS EVALUATION
TERRAIN DIFFRACTION
CLUTTER ANALYSIS
RF PROPAGATION MODELS
CELLS FOOTPRINT
POPULATION
DENSITY DATASET
ADMINISTRATIVE
BORDERS
ANTENNA
PATTERNS
TERRAIN
DATASET
FIELD
MEASUREMENTS
Figure 5: IoT network planning simulator’s architecture.
The developed IoT simulator uses a large-scale
empirical propagation model in order to predict the
path loss and received signal strength for uplink and
downlink. As inputs, it relies on Geographic Infor-
mation System (GIS) datasets such as Terrain Digital
Surface and Elevation Models, as well as the Clut-
ter (Radio Environment) characterization. In addi-
tion, to accurately represent the antenna gain in each
azimuth/elevation, it also uses the antenna radiation
pattern model which is supplied by the vendor. Since
the considered use case may be to offer distinct cover-
age and redundancy requirements for each geograph-
ical region and population density, it requires the ge-
ographical population distribution, as well as its ad-
ministrative borders.
The median path loss is calculated depending
on the distance, frequency, antenna effective height,
Line-of-Sight (LoS) existence, diffraction losses and
clutter type. To get the best prediction results, it is still
necessary to adapt the model’s parameters to local
conditions and to the technology peculiarities of the
IoT radio planning. In this context, Lisbon field mea-
surements (using SIGFOX network) were also used,
to the tune the model.
As outputs, it produces several thematic maps of
individual base-station foot-print, global coverage, re-
dundancy level, along with planning reports where the
considered regions compliance to the pre-set coverage
requirements are presented. As an example, Figure
6 represents the coverage footprint for a certain cell
whilst Figure 7 presents the redundancy level for one
of the Lisbon’s simulations. Here, the red stands for
the triple redundancy, the green for double, and finally
the blue shaded area for the single redundancy (K).
Figure 6: Coverage Footprint for a given cell.
Figure 7: Base-station redundancy level.
4.2 Assisted Planning
Using the presented methodology, it is possible to in-
troduce a new concept dependent on the redundancy
level, which will be named Assisted Planning. The
assisted planning feature provides a way of picking
the most suitable locations to plan the sites, in order
to achieve the coverage and redundancy requirements
in a specific region.
In fact, and as mentioned, new and already ex-
istent IoT operators should follow a site-sharing ap-
proach to reduce costs. Hence, they will have to pick
the best sites from an existing candidate list, in order
to build up the new network. The assisted planning
helps the radio planner in this task, since supplies a
cell grid already moulded to the specific radio envi-
ronment and also coverage and redundancy require-
ments. Hence, using assisted planning, it is possible
to automatically determine the best location to install
the base-station, simply pin-pointing the location or
by selecting it from a set of candidate locations.
WINSYS 2016 - International Conference on Wireless Networks and Mobile Systems
142
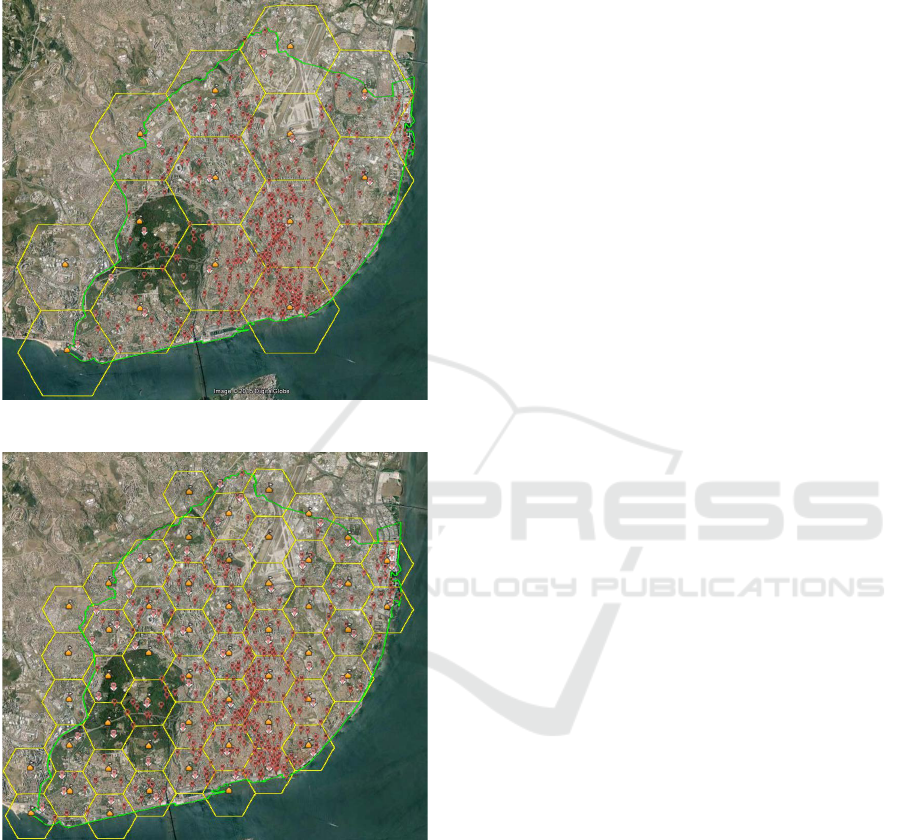
Figures 8 and 9 present the assisted planning grid
for the single and triple redundancy scenarios, respec-
tively. For triple redundancy, the ISD strongly re-
duces, as already mentioned.
ASSISTED PLANNING & NOMINAL PLANNING
› THE JAKE’S APPROACH FOR A REDUNDANT IOT BASE STATION SYSTEM (CONT.)
› CELFINET © 2015
N
EW SOLUTIONS
• CHANGING THE INTER SITE DISTANCE FROM 3 KM TO 1.5 KM…
50
Figure 8: Assisted planning for single redundancy scenario.
ASSISTED PLANNING & NOMINAL PLANNING
› THE JAKE’S APPROACH FOR A REDUNDANT IOT BASE STATION SYSTEM (CONT.)
› CELFINET © 2015
N
EW SOLUTIONS
• CHANGING THE INTER SITE DISTANCE FROM 3 KM TO 1.5 KM…
50
Figure 9: Assisted planning for triple redundancy scenario.
The yellow planning grid, which is set for each
region according to its terrain and clutter character-
istics, reveals an average site separation, dependent
on the redundancy level which the network is trying
to achieve.Both figures consider a 90% coverage area
target, but for different redundancy levels which im-
pose different site distance separations, as mentioned.
In this case, a set of candidate locations for site-
sharing is available (represented by red markers),
along with the yellow markers that represent the best
theoretical site locations. The assisted planning fea-
ture picks the best sites, after a ranking procedure,
where not only distance to theoretical markers is con-
sidered, but also the location height, type of radio en-
vironment and construction limitations.
5 CONCLUSIONS
This paper presented an enhanced methodology in
order to introduce redundancy requirements in the
LPWA networks radio planning for IoT. The Jake’s
Curves were extended, allowing to compute new
log-normal fading margins which traduce coverage
and redundancy requirements.The presented method-
ology is transversal to all point-to-area wireless tech-
nologies, which depend on a coverage area require-
ment, from emerging LPWA technologies (e.g SIG-
FOX, On-Ramp, Semtech) to existing cellular tech-
nologies which are focusing on IoT integration (NB-
IoT).
The methodology was applied to a LPWA SIG-
FOX network in a typical urban environment. The
double and triple redundancy requirement produced
a huge 10 dB increase in the log-normal fading mar-
gin, reducing the cell range to one half, which roughly
quadruples the site density. In fact, assuring redun-
dancy strongly increases the network investment in
base-station equipment and site acquisition.
This new approach allowed to compute new site
grids and to introduce the concept of assisted plan-
ning for IoT networks, where the most suitable candi-
dates among a site list will be automatically chosen,
avoiding the inefficient and ineffective ”trial and er-
ror” method in radio planning.
ACKNOWLEDGEMENTS
This work was supported by the Instituto de
Telecomunicac¸
˜
oes (IT) and the Portuguese Founda-
tion for Science and Technology (FCT) under project
PEst-OE/EEI/LA0008/2013.
REFERENCES
3GPP (September 2014). Study on provision of low-cost
Machine-Type Communications (MTC) User Equip-
ments (UEs) based on LTE. In 3GPP TR 36.888.
D. C. Cox and R. R. Murray and A. W. Norris (1984). 800-
MHz attenuation measured in and around suburban
houses. AT T Bell Laboratories Technical Journal,
63(6):921–954.
Introducing Redundancy in the Radio Planning of LPWA Networks for Internet of Things
143

G. Margelis and R. Piechocki and D. Kaleshi and P. Thomas
(2015). Low Throughput Networks for the IoT:
Lessons learned from industrial implementations. In
Internet of Things (WF-IoT), 2015 IEEE 2nd World
Forum on, pages 181–186.
Jakes, William C. and Cox, Donald C., editor (1994). Mi-
crowave Mobile Communications. Wiley-IEEE Press.
P. Vieira and P. Queluz and A. Rodrigues (2007). A Dy-
namic Propagation Prediction Platform Over Irregular
Terrain and Buildings for Wireless Communications.
In Vehicular Technology Conference, 2007. VTC-2007
Fall. 2007 IEEE 66th, pages 884–888.
Rappaport, Theodore (2001). Wireless Communications:
Principles and Practice. Prentice Hall PTR, Upper
Saddle River, NJ, USA, 2nd edition.
Tom Rebbeck, Michele Mackenzie and Nuno Afonso
(2014). Low-powered wireless solutions have the po-
tential to increase the M2M market by over 3 billion
connections. Analysys Mason.
W. Guibene and K. E. Nolan and M. Y. Kelly (2015). Sur-
vey on Clean Slate Cellular-IoT Standard Proposals.
In Computer and Information Technology; Ubiqui-
tous Computing and Communications; Dependable,
Autonomic and Secure Computing; Pervasive Intel-
ligence and Computing (CIT/IUCC/DASC/PICOM),
2015 IEEE International Conference on, pages 1596–
1599.
WINSYS 2016 - International Conference on Wireless Networks and Mobile Systems
144
