
Radar and LiDAR Sensorfusion in Low Visibility Environments
Paul Fritsche
1
, Simon Kueppers
2
, Gunnar Briese
2
and Bernardo Wagner
1
1
Institute of Systems Engineering - Real Time Systems Group, Leibniz Universit
¨
at Hannover, Appelstr. 9A,
30167 Hannover, Germany
2
Fraunhofer Institute for High Frequency Physics and Radar Techniques FHR, Fraunhoferstr. 20,
53343 Wachtberg, Germany
Keywords:
Mobile Robotics, Low Visibility Environments, FMCW-Radar, LiDAR, Sensorfusion, Smoke Detection.
Abstract:
LiDAR sensors are unable to detect objects that are inside or behind dense smoke, fog or dust. These aerosols
lead to problems for environmental modeling with mobile robotic platforms. For example, if a robot equipped
with a LiDAR is surrounded by dense smoke, it can neither localize itself nor can it create a map. Radar
sensors, on the other hand, are immune to these conditions, but are unable to represent the structure of an
environment in the same quality as a LiDAR due to limited range and angular resolution. In this paper, we
introduce the mechanically pivoting radar (MPR), which is a 2D high bandwidth radar scanner. We present
first results for robotic mapping and a fusion strategy in order to reduce the negative influence of the aforemen-
tioned harsh conditions on LiDAR scans. In addition to the metric representation of an environment with low
visibility, we introduce the LRR (LiDAR-Radar-Ratio), which correlates with the amount of aerosols around
the robot discussing its meaning and possible application.
1 INTRODUCTION
In many areas of field and rescue robotics, it is es-
sential to have a precise model of an environment.
For example, in disaster operations, fire and smoke
create situations dangerous for human life. To get a
clear picture of the scenario ahead, a mobile platform
with sensors that are able to handle harsh conditions,
is sent in to record the map necessary for operational
planning and orientation. Commonly, standard sen-
sors like LiDAR scanners, sonar sensors and stereo
cameras have established themselves as state-of-the-
art for most tasks in indoor robotics. Radar sensors
appear in field and rescue robotics. They are, how-
ever, not used frequently to perform tasks like map-
ping and localization, due to their limited range and
angular resolution.
Commercially available radar sensors have a
legally restricted band width, resulting in a limited
range resolution of frequency modulated continuous
wave (FMCW) radars, thus making them unsuitable
for indoor environments. This is one of the rea-
sons why research groups that apply radar in mo-
bile robotics, often use self built sensors. The first
appearance of radar sensors in the robotic commu-
nity is tracing back to the Australian Centre for Field
Robotics (ACFR) in the nineties, where fundamen-
tal work on probabilistic SLAM algorithms in com-
bination with radar was developed (Clark and Dis-
sanayake, 1999). Also, they built their own radar
scanner (Clark and Whyte, 1998). Besides the ACFR,
Adams et al. (Adams and Jose, 2012) were doing
research on radar in robotics with the integration of
the PHD filter and the application for mapping of
mines. The PHD SLAM is working with a commer-
cial NavTech device. In contrast to the feature based
SLAM approaches, Vivet et al. (Vivet et al., 2013)
use scan matching through a Fourier-Mellin transform
with the custom made K2PiMMW scanner produc-
ing large scale maps. Mapping of indoor environ-
ments was performed by Detlefsen (Detlefsen et al.,
1993) and Marck (Marck et al., 2013). We have been
studying the use of low bandwidth FMCW sensors
for robotic mapping using a rotating scanner setup
with lateration and lope offsets (Fritsche and Wagner,
2015). Together with an international team, Sakamoto
presented the application of a modified version of his
inverse boundary scatter transform (IBST) and Kirch-
hoff migration, a SAR algorithm, for an environmen-
tal imaging with a mobile robot (Salman et al., 2013).
Most SAR algorithms are very sensitive toward noise,
which makes it difficult to apply them in robotic map-
ping. A sensor fusion between radar and LiDAR for
obstacle avoidance was realized by Yamauchi (Ya-
30
Fritsche, P., Kueppers, S., Briese, G. and Wagner, B.
Radar and LiDAR Sensorfusion in Low Visibility Environments.
DOI: 10.5220/0005960200300036
In Proceedings of the 13th International Conference on Informatics in Control, Automation and Robotics (ICINCO 2016) - Volume 2, pages 30-36
ISBN: 978-989-758-198-4
Copyright
c
2016 by SCITEPRESS – Science and Technology Publications, Lda. All rights reserved
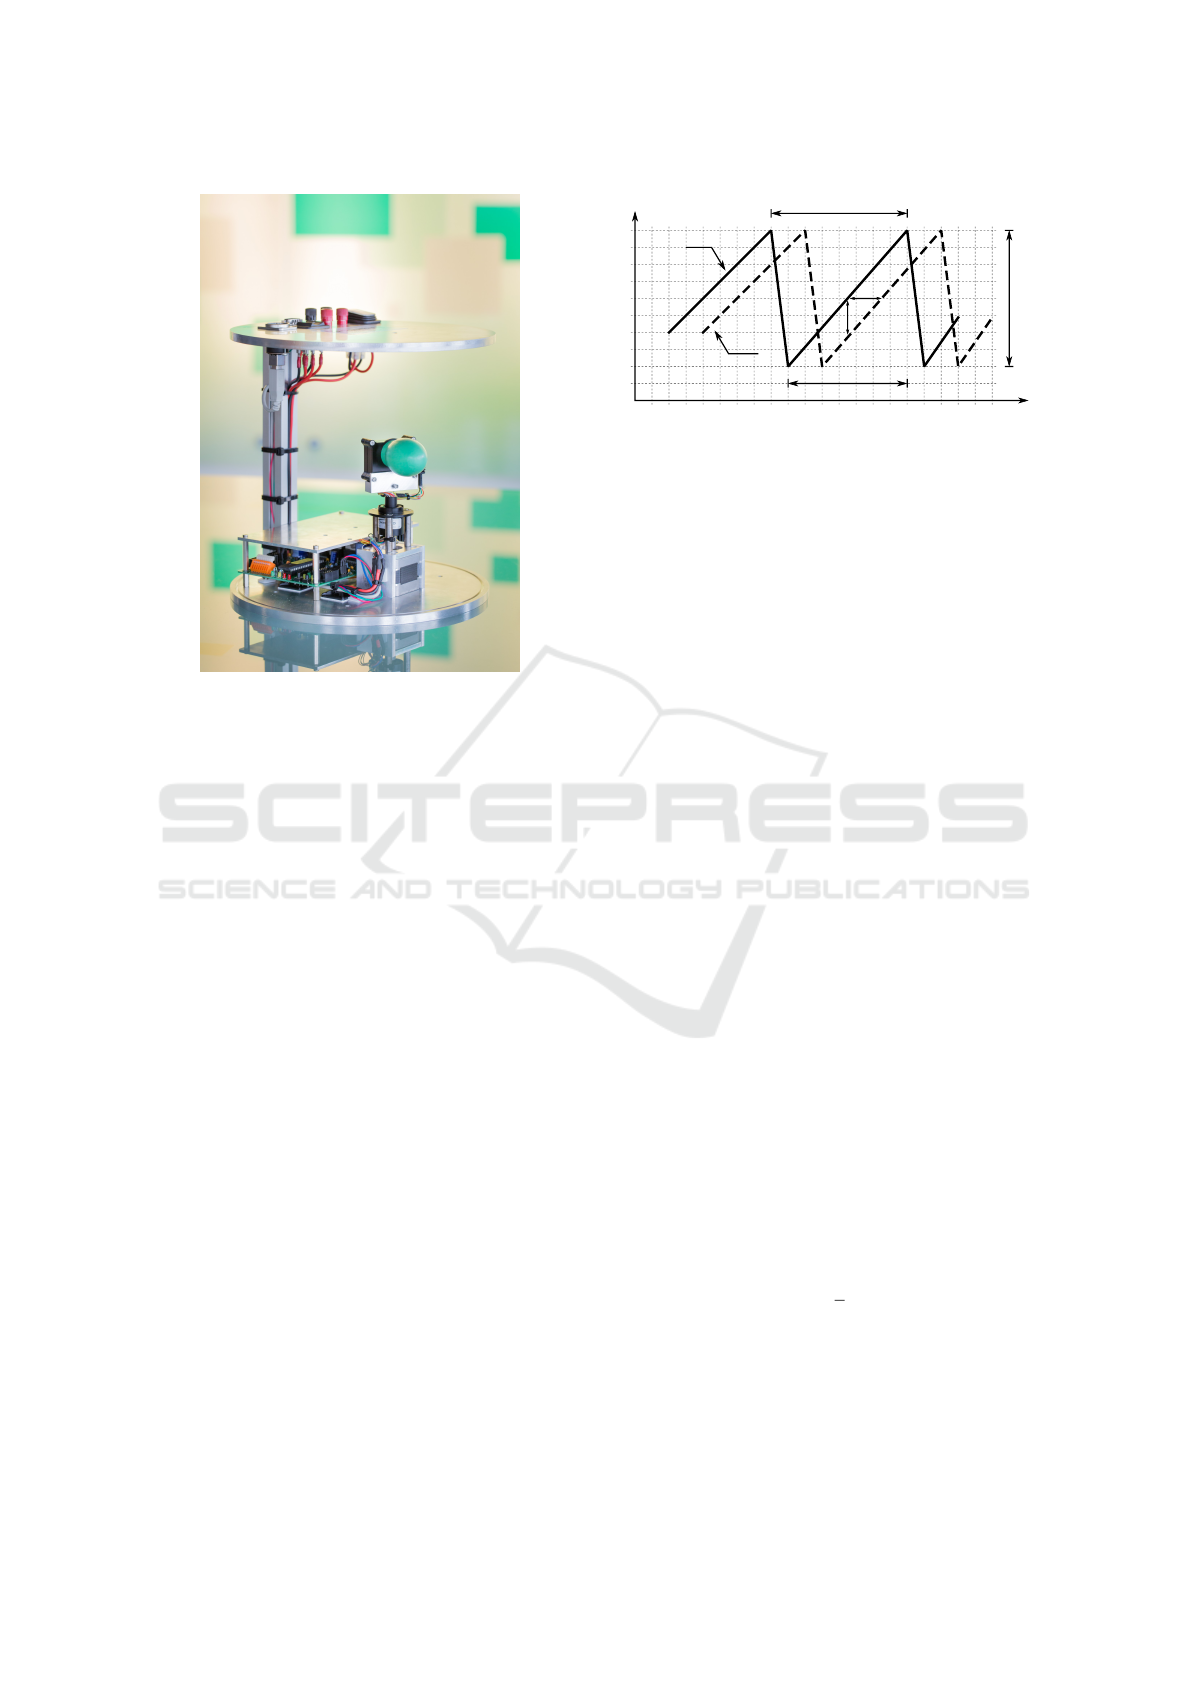
Figure 1: Picture of Mechanically Pivoting Radar.
mauchi, 2010).
Section 2.1 describes the functionality of the me-
chanically pivoting radar (MPR). The comparison of
MPR and two other sensor for the same purpose is
given in Section 2.2. Section 2.3 presents our scan fu-
sion method and the LiDAR-Radar-Ratio (LRR). Ex-
periments described in Section 3 provide the imple-
mentation of our methods. Section 4 brings out the
results and discusses limitations and possible applica-
tions. Finally, Section 5 sums up our results describ-
ing our contribution.
2 METHODS
The following section explains principles behind the
MPR comparing it with a Velodyne VLP-16 as well as
with a NavTech MMW radar scanner. Then, we focus
on the integration of radar and LiDAR measurements,
in order to reduce the influence of aerosols on LiDAR
scans. The fused scan suits for modeling of low vis-
ibility environments. Furthermore, we introduce the
LRR, which correlates with the amount of smoke in-
side an environment.
2.1 The MPR - A 2D FMCW Radar
Scanner
The development of the MPR system has been car-
ried out by the Fraunhofer Institute for High Fre-
f(t)
t
Δt
Δf
f
TX
(t)
f
RX
(t)
BW
RF
1/f
PRF
T
sweep
Figure 2: Frequency-over-time plots of transmit and re-
ceive signal in linear frequency modulated continuous wave
radars.
quency Physics and Radar Techniques in order to pro-
vide hardware for a radar based approach for two-
dimensional scanning. Its principle function is com-
parable to a regular laser scanning unit, where a me-
chanically rotating element is used to generate a con-
tinuously revolving beam. As it can be seen in Figure
1 the MPR hardware consists of a compact USB con-
trolled FMCW radar unit, that is based on a custom
MMIC with 80 GHz center frequency and a maximum
sweep bandwidth of 25 GHz providing a range reso-
lution of about 6 mm (sel f −citation). A slip ring has
been used up to the USB data and power lines in order
to allow the FMCW radar beam to be rotated contin-
uously in the azimuth plane. The rotary movement
was realized using stepper motors controlled via a
commercially available stepper motor controller. The
overall mechanical dimensions are 250 millimeters in
diameter and 275 millimeters in height.
In order to present the operation of the USB radar
unit, Figure 2 shows the basic relationship between
the momentary frequency of the transmitted signal
f
T X
(t) and the received signal f
RX
(t) in an FMCW
based radar system with a single stationary target re-
flection. As can be seen, the transmitted signal (solid
line) is a linear frequency sweep covering a frequency
bandwidth of BW
RF
over T
sweep
. This signal is radi-
ated using an appropriate antenna structure. Due to
the propagation delay of the emanated electromag-
netic waves, the reflected signal (dashed line) of the
target is delayed by a time delay of ∆t once received
by the radar system. From this observation, the basic
relationship of target distance R to time delay ∆t can
be described as shown in Equation 1.
R =
c
2
∆t (1)
Due to the linear frequency modulation, the frequency
offset ∆ f indicated in Figure 2 has a direct relation-
ship to the time delay ∆t introduced by the propaga-
tion delay as described previously. It is proportional
with a factor of BW
RF
/T
sweep
. Thus the distance R to
Radar and LiDAR Sensorfusion in Low Visibility Environments
31
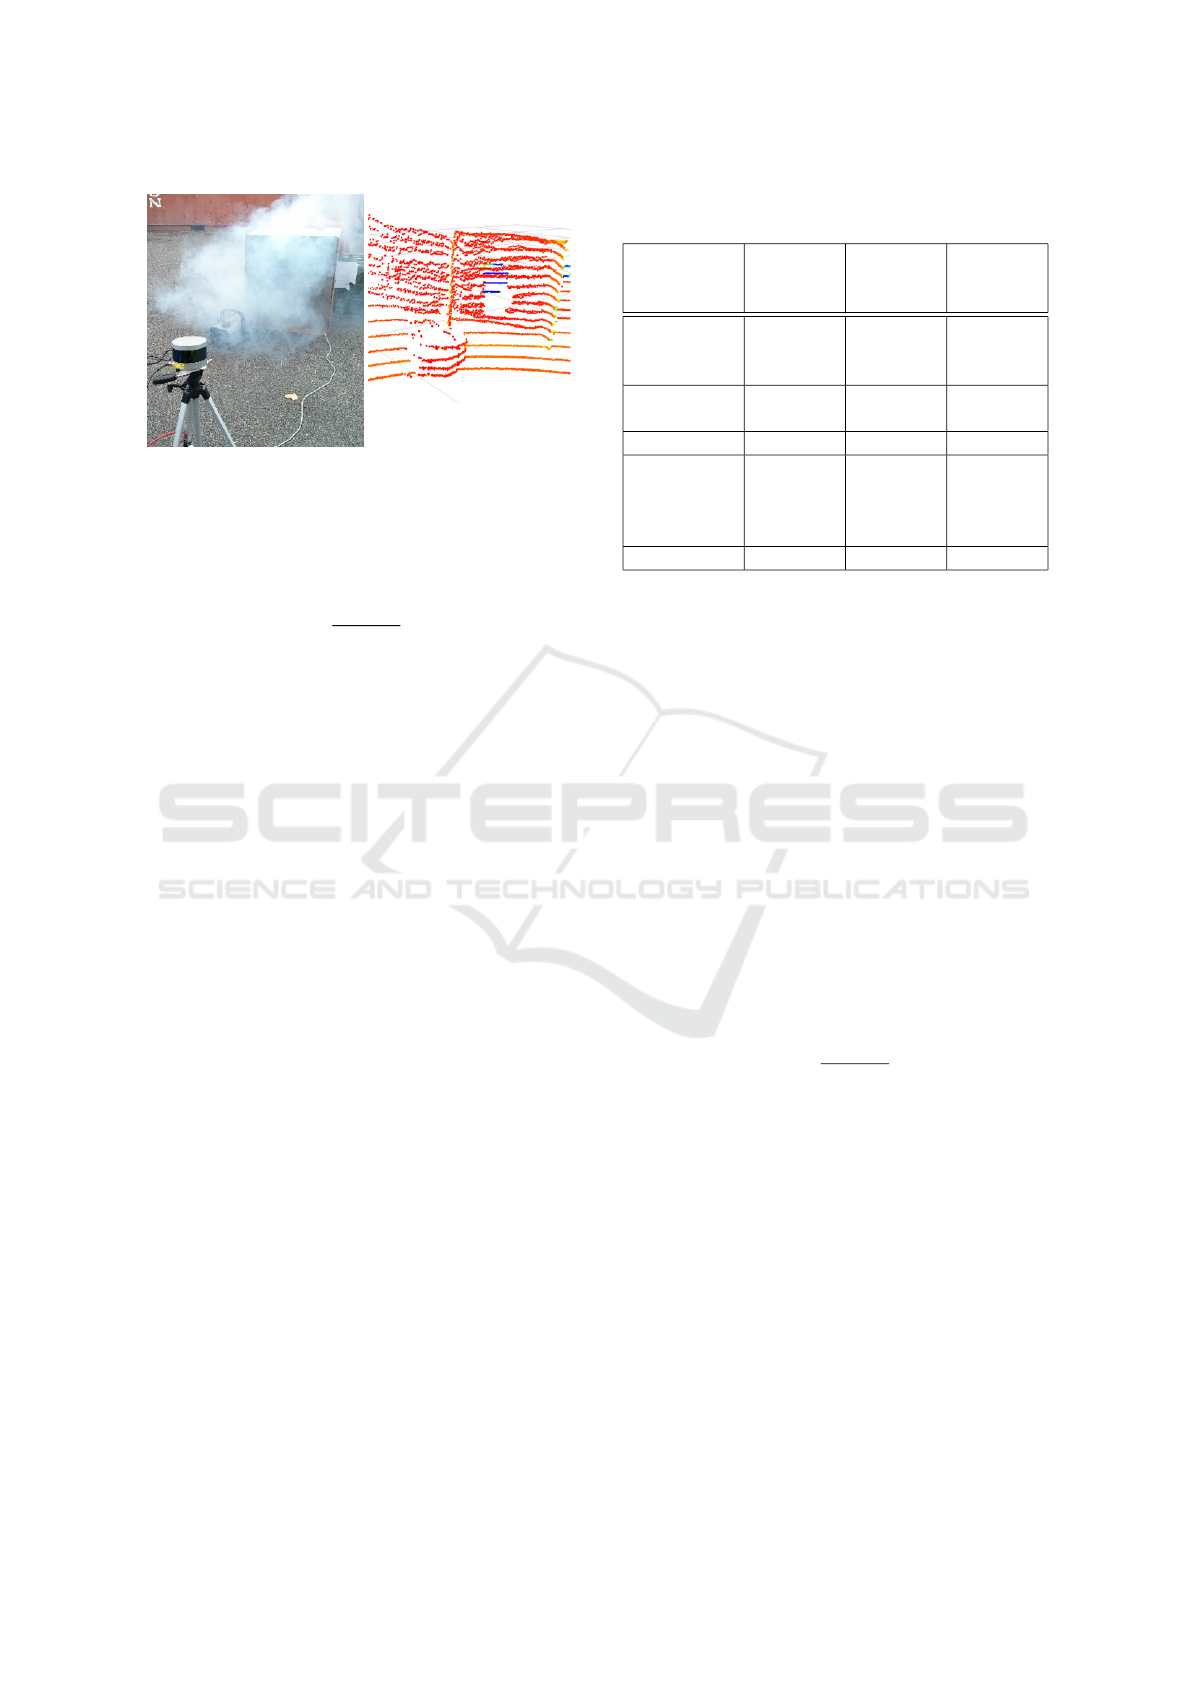
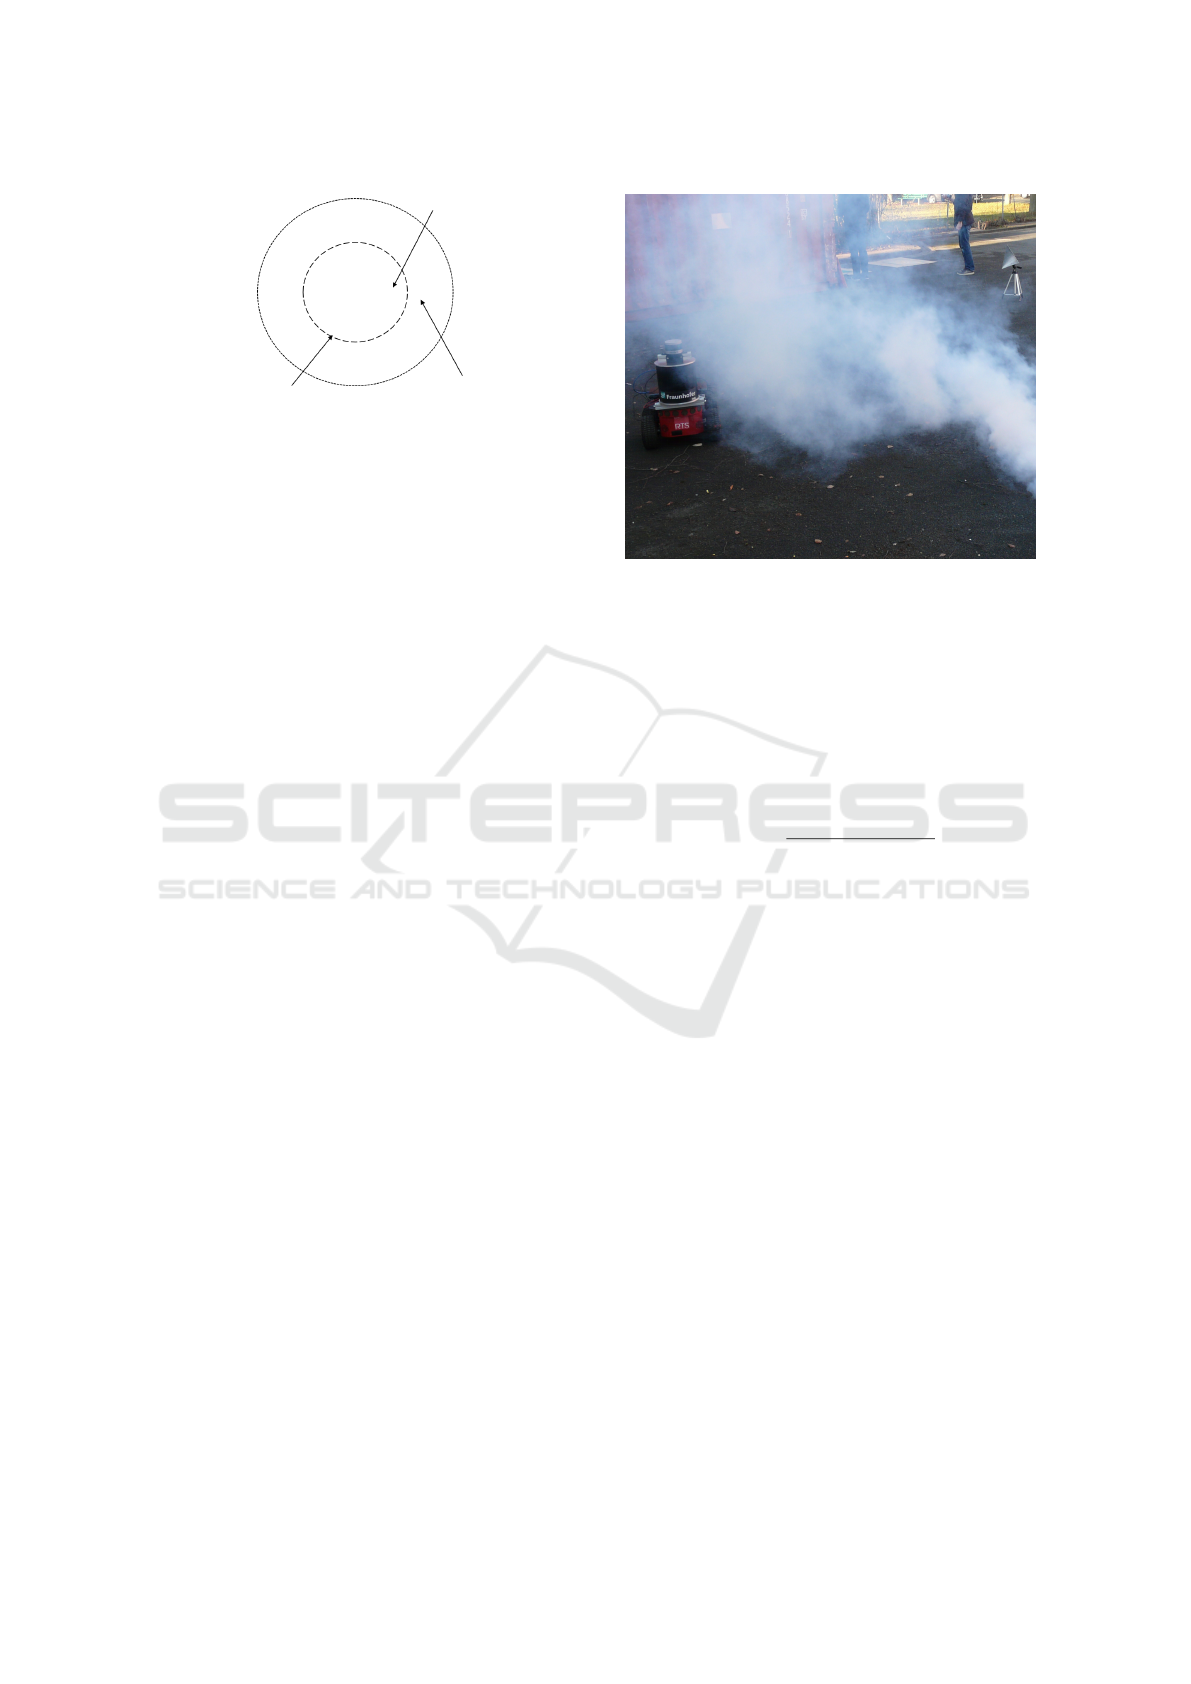
Figure 3: Left: Stationary LiDAR scanner in front of a box,
which is filled with fog. Right: 3D scan image of the Velo-
dyne VLP-16 showing the detection of fog.
a single target can be evaluated from the frequency
difference ∆ f as shown in Equation 2.
R =
c · T
sweep
2 · BW
RF
∆ f (2)
Through the use of frequency mixing, the frequency
offset ∆ f can be extracted with little effort. The re-
sulting intermediate frequency (IF) signal is a linear
superposition of the above described relationships for
all targets visible by the radar system. Further pro-
cessing of the radar information is then done by digi-
tizing the IF signal and using algorithms such as Fast-
Fourier-Transform and peak detection in the digital
domain to extract range information for multiple tar-
gets.
With a rotary resolution of 1.8 degrees, a maxi-
mum of 200 radar acquisitions can be resolved during
one rotation of the radar unit. At the maximum rota-
tion rate of 2.5 Hz, up to 500 single radar acquisitions
are carried out per second, while the radar is contin-
uously scanning in the azimuth plane. The measure-
ment range of the MPR is between 0.2 meters to about
15 meters, depending on the type of target to be de-
tected.
2.2 Comparing the MPR
As mentioned before, aerosols influence the measure-
ment quality of LiDAR significantly. The reason for
the radar not being affected by aerosols is that the
wave length of radar is larger than most aerosol par-
ticles. For example, dust is larger than 0.5 µm and
smoke particles are submicrometer in size (Willeke
et al., 1993, p. 5). Dense fog, as can be seen in Fig-
ure 3, gets detected by the Velodyne VLP-16, even
if the strongest return echo is selected. On the other
hand, radar scanners cannot represent an environment
in the same quality as LiDAR scanners. Table 1 sum-
marizes the most important sensor properties of the
Table 1: Comparing Velodyne VLP-16, MPR and NavTech
MMR radar.
Velodyne
VLP-16
MPR NavTech
MMW
radar
Measurement
range
up to 100
m
up to 15
m
up to
200-800
m
Angular
resolution
0.1-0.4
◦
1.8
◦
0.09
◦
Beam width 0.17
◦
4.9
◦
1.8
◦
Wave length 903 nm 3.26-
3.41 mm
(88-92
GHz)
3.89-
3.95 mm
(76-77
GHz)
Scan rate 5-20 Hz 2.5 Hz 2.5 Hz
Velodyne VLP-16, the MPR and the NavTech MMW
Radar, which was used by Adams (Adams and Jose,
2012, p. 329).
The measurement range depends mainly on the
power of the emitted radar wave, the focussing of
the antenna, the radar cross section (RCS) of the ob-
ject and the detection algorithm. NavTech radars are
meant for airport and vehicle traffic surveillance and
work accordingly with a stronger emitting power. The
angular resolution refers to the steps between two
measurements. The NavTech Radar has the highest
angular resolution, but its wide beam width results
in a blurry scan image. Due to large beam widths,
radar scanners usually measure the same object from
more than one angular step, which leads to a sickle-
shaped representation of objects inside a radar scan.
The MPR has a sweep bandwidth of 4 GHz, which
corresponds according to Equation 3 to a distance res-
olution of 3.75 cm.
∆R =
c
2 · BW
RF
(3)
A radar’s resolution is its capability to distinguish
objects. Usually, the distance accuracy is higher.
One MPR scan contains 200 single radar acquisitions.
Due to radar’s technical principle, radar scanners have
slower scan rates compared to 2D LiDAR scanners,
which even exist with 100 Hz.
2.3 Integrating MPR- and
LiDAR-Scans
The fusion of LiDAR and radar scans to a fused scan
combines the advantages of both sensors. Usually,
a scan message contains an array of range measure-
ments S = [R
0
,R
1
,...,R
n
]. We diminish outliers in-
side radar scans, which are caused by reflections and
ICINCO 2016 - 13th International Conference on Informatics in Control, Automation and Robotics
32
R
F
Case I,II and III
Case IV
Figure 4: This drawing depicts the overlapping scan fields.
wrong detection, by applying a local outlier factor
(LOF) filter (Breunig et al., 2000). Our proposed fu-
sion method replaces a LiDAR point R
i,LiDAR
of a 2D
scan, which is affected by smoke, with a correspond-
ing radar points R
j,Radar
, according to the sensor setup
in Figure 5.
In general, different sensors have different scan
ranges. In our case, the LiDAR has a larger scan range
than the radar. This basically depends on the emitted
power, the focusing of the antenna and the sensitivity
of the detection algorithm. The maximum range of
LiDAR and radar is not constant also depending on
the reflectivity of the objects inside the scene. There-
fore, a sensor fusion can only be performed in over-
lapping scan fields, which can be determined dynam-
ically through the fusion range R
F
depending on the
average range of a radar scan R
Radar,∅
, the maximum
range of a radar scan and the parameter α = [0..1].
R
F
= R
Radar,∅
+ α(R
Radar,max
− R
Radar,∅
) (4)
Inside the fusion range, there can be three cases to
form a fused scan, as shown in Figure 4.
• Case I: ||R
LiDAR
− R
Radar
|| < β : R
Fusion
= R
LiDAR
If the corresponding pair of points from LiDAR
and radar do not have a larger Euclidean distance
to each other than a pre-defined parameter β, then
the LiDAR point is used to build the fused scan.
• Case II: R
LiDAR
< R
Radar
: R
Fusion
= R
Radar
If there are aerosols in the air, the corresponding
LiDAR points are in front of the radar points.
• Case III: R
LiDAR
> R
Radar
: R
Fusion
= R
Radar
Some rare objects, which have, for example, ele-
ments of a metal grid or mesh, reflect radar, but
let LiDAR shine through it.
Outside the overlapping scan fields, only LiDAR
points contribute to the fused scan.
• Case IV: R
LiDAR
> R
F
: R
Fusion
= R
LiDAR
The maximum measurement range of our radar is
lower. The fused scan will keep LiDAR points,
which are larger than the average radar distance.
Figure 5: This figure shows the setup of the experiment. It
has been performed in a yard with a robotic platform, which
is equipped with the 2D MPR and a 3D Velodyne VLP-16
LiDAR.
The experiments of this paper were performed
with α = 0.
Every point of the fused 2D scan contains the infor-
mation, from which case, it has been derived. In this
article, we propose the calculation of the LRR.
LRR =
∑
R
Fusion
∈ CaseII
∑
R
Fusion
(5)
The LRR can represent the amount of smoke in an
environment, but is not related to the density. On the
other side, objects which cannot be detected by the
radar lead to an increasing of the LRR as well. In this
article, we will monitor the LRR during the presence
of fog and during the presence of objects, which are
invisible for radar. Since smoke sensors are usually
very slow, the LRR can be used for faster smoke de-
tection.
3 EXPERIMENTS
Before performing our main experiment, we wanted
to see if it is possible to integrate MPR scans into
scan registration based SLAM approaches, because
previous studies indicate that due to most radar scan-
ner’s bad accuracy and resolution, the focus has been
on feature based SLAM approaches. Therefore, we
drove up and down a corridor of our building with a
Pioneer platform and recorded radar and LiDAR data.
The main experiment was performed inside a yard
where we were able to generate fog with a fog ma-
chine to simulate low visibility conditions. This ex-
periment was carried out to find out about the affect
Radar and LiDAR Sensorfusion in Low Visibility Environments
33

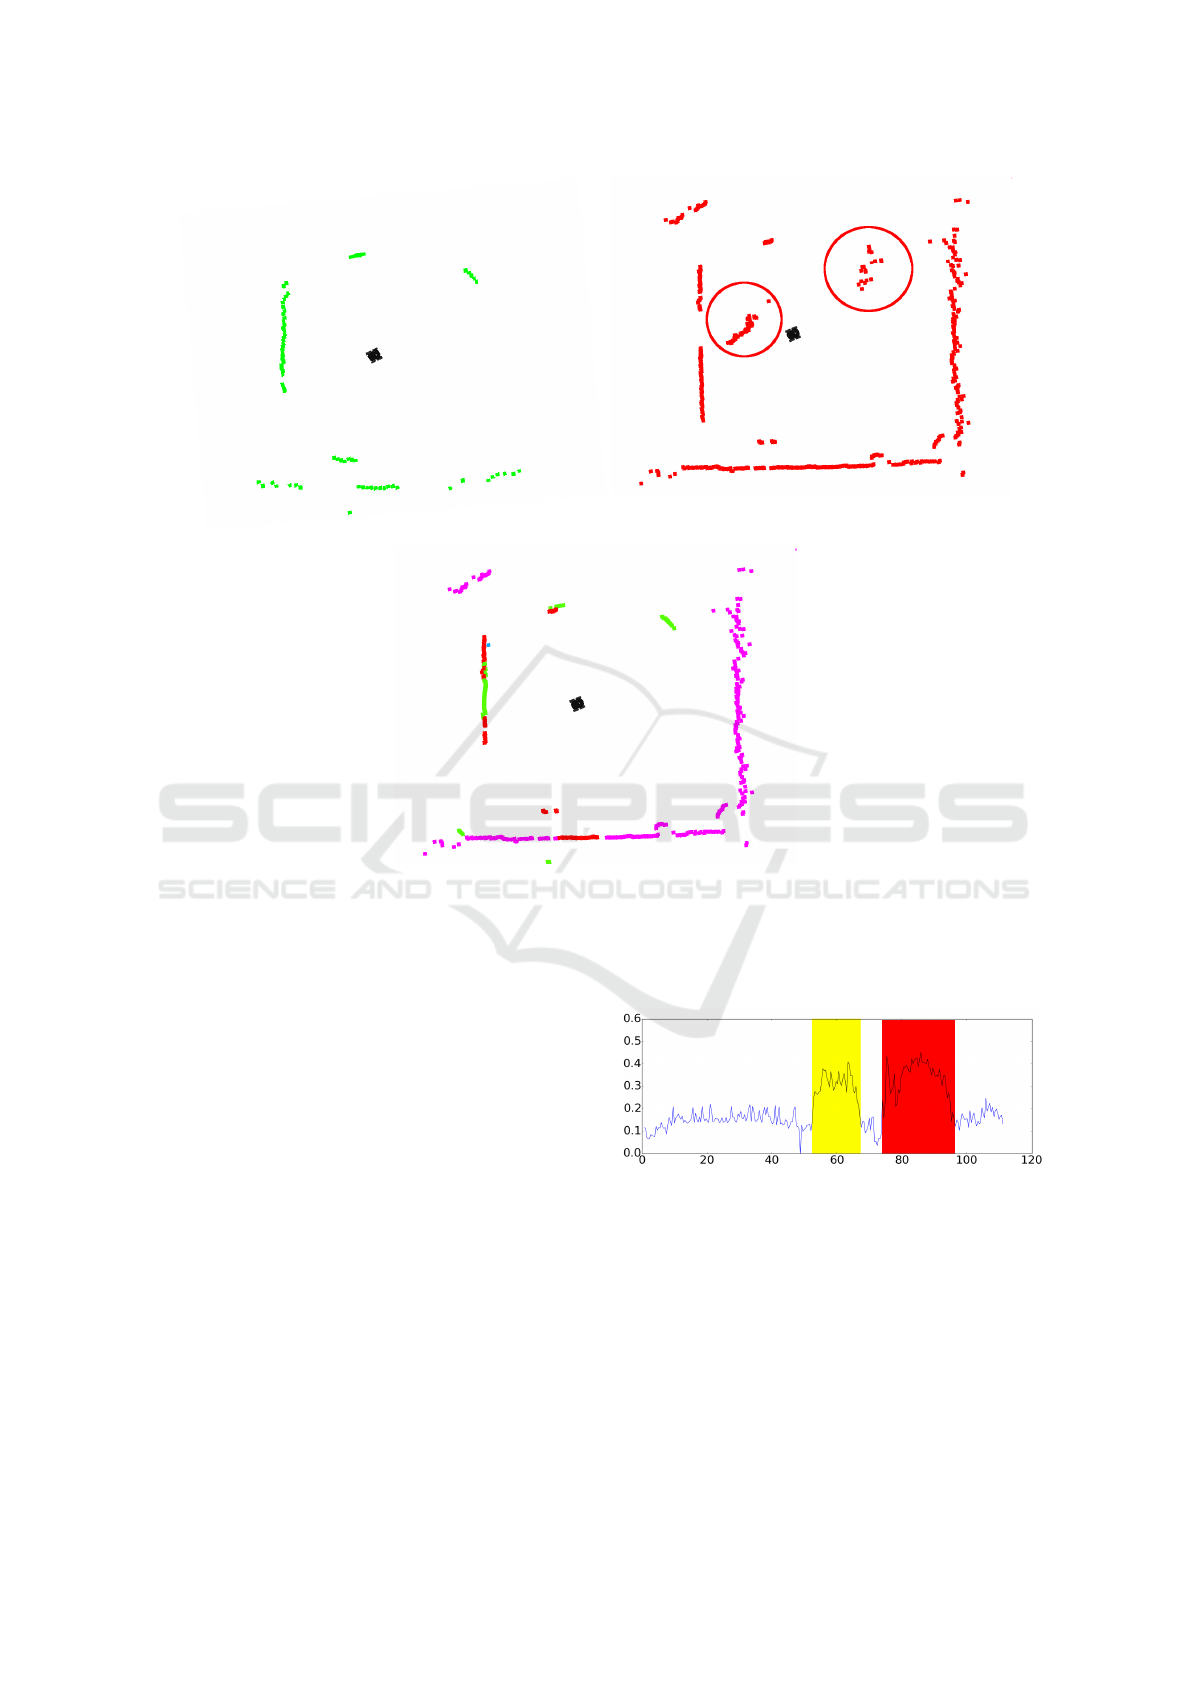
(a) Velodyne VLP-16 (b) MPR (c) MPR and LOF filtering (d) Velodyne and MPR fusion
Figure 6: These maps reveal first results including the MPR for robotic mapping.
of aerosols on robotic mapping, observing our fusion
method and the LRR. As can be seen from Figure
5, we equipped a Pioneer platform with a Velodyne
VLP-16 and the MPR.
Our software was implemented via the middle-
ware ROS. In order to remotely control the Pioneer,
we used the rosaria driver package. Furthermore, we
applied the Velodyne stack to get sensor reading from
the LiDAR and the standard ROS SLAM tool gmap-
ping (Grisetti, 2005).
4 RESULTS AND DISCUSSION
FHR have introduced a new radar scanner, for map-
ping and localization in low visibility environments.
Figure 6 presents grid maps of a corridor and the esti-
mated robot trajectories. Figure 6(a) and Figure 6(b)
visualize the difference between maps that have been
built with LiDAR and radar. Obviously, the LiDAR
scanner results in a clearer map than the MPR and
the robot’s trajectory jumps while using the MPR for
SLAM. But, to the author’s knowledge, not many suc-
cessful implementation of radar for grid based map-
ping with simultaneous localization in an indoor en-
vironment were achieved. We believe, this is due
to the very good sensor specification of the MPR
(and due to the robustness of gmapping). However,
there are Marck et al. (Marck et al., 2013) who ap-
plied ICP between two consecutive radar scans. Other
publications address mapping ((Brooker et al., 2005),
(Adams and Jose, 2012, p. 18), (Fritsche and Wag-
ner, 2015)) but with known sensor locations or feature
based SLAM (Clark and Dissanayake, 1999).
As shown in Figure 6(c), outliers inside the re-
sulting map can be diminished via LOF filtering, al-
though it is not possible to erase them completely.
Consequently, if an environment does not contain any
smoke, fog or dust, then a radar scanner has no advan-
tageous over a LiDAR scanner. Our fusion method
enhances the resulting map under normal conditions.
Since we are not able to suppress all outliers, the map
(Figure 6(d)) still contains more spikes than the pure
LiDAR map.
The advantage of our fusion method is depicted in
Figure 7. Figure 7(a) and 7(b) reveal one scan image
of the MPR and the Velodyne VLP-16 (horizontal cut)
with the presence of fog, which is marked via a yellow
circle. As can be seen from Figure 7(c), the scan fu-
sion replace LiDAR points which are affected by fog
with radar points, in order to get a clean scan for lo-
calization, mapping or SLAM. This permits making
structure visible, which is inside or behind aerosols.
At the same time, our fusion method gives LiDAR
the priority when aerosols are absent. The used fog
machine could not generate enough fog to keep the
environment very nebulous for a long time, because
it needs to recharge frequently. During a real rescue
scenario, which involves fire and smoke, there can be
more occlusion.
But, there is one situation, we should have a closer
look at: If an object can be detected by the LiDAR,
but cannot be detected by the radar and it is inside the
fusion range R
F
, then it gets erased from the scan, be-
cause the conditions regarding the cases are the same
as in case II. If the radar detects nothing, the LiDAR
should not be used consequently, because there can be
smoke for example in front of an open scene.
As a further aspect of the LiDAR and radar scan
integration, we introduced the LRR. Common gas
sensors and smoke detectors are disadvantageous as
they have a slow respond time and measure only one
certain point. Additionally, the measurement proce-
ICINCO 2016 - 13th International Conference on Informatics in Control, Automation and Robotics
34
(a) MPR scan.
(b) Velodyne VLP-16 scan.
(c) Fused scan.
Figure 7: 7(a): Scan with the MPR. 7(b): 2D scan (horizontal cut of 3D scan) of the Velodyne VLP-16. The red circle marks
an area, where LiDAR detects fog. 7(c): Our sensorfusion replaces LiDAR point, which are affected by fog, with radar points.
Red points represent case I, green points represent case II and magenta points represent case IV.
dure requires a stationary setup, so if a gas sensor is
placed on a mobile robot, the result is not clearly in-
terpretable. Usually, gas and smoke distributions are
highly dynamic and the movement of the robot itself
creates a swirling. Consequently, it is very hard to
model fog or smoke in an environment. The LRR
can give a remarkably quick information about the
amount of aerosols and objects which cannot be de-
tected by radar inside the fusion range.
During the experiments that we performed in the
yard, we let the robot stay for 40 seconds and started
driving afterwards. After approximately 50 seconds,
we turned on the fog machine for 10 seconds. This
phase is marked yellow in Figure 8.
The LRR correlates accordingly to the amount of
fog in the yard. On one side of the yard, there is a big
hedge and at 75 second we drove the robot close to the
hedge, so that it was inside the fusion range R
F
. We
observed that the hedge cannot be detected with the
MPR. Consequently, case II of our algorithm handles
LRR
t in s
Figure 8: The LRR raises if the robot is surrounded by fog
(yellow). If, the robot drives close to an object (closer than
R
∅,radar
), which cannot be detected by the radar, then the
LRR raises as well (red).
it if it were fog. Future work will include a geometry
detection, for example lines, in order to distinguish
smoke from structured shapes, which are invisible for
the radar. Afterwards, we drove away from the hedge.
This phase is marked red on the diagram in Figure 8
and cannot be distinguished from the yellow phase.
Radar and LiDAR Sensorfusion in Low Visibility Environments
35

-0.1
-0.2
-0.3
-0.4
-0.5
LRR
Figure 9: This figure presents the LRR visualization during
robotic navigation.
Figure 9 shows a grid map, which was generated with
the fused scan and the ROS SLAM tool gmapping.
The outliers are caused by the MPR, but can be re-
duced by filtering the MPR scan, for example via ra-
dial outlier removal, before fusing it with the LiDAR.
The LRR is visualized along the robot path in the grid
map as well.
Equivalent to Figure 8, the yellow circle presents
the phase with operating fog machine and the red cir-
cle marks the phase, where the robot is too close to
the hedge. A map or trajectory containing LRR in-
formation can give the operator additional informa-
tion about an environment. The LRR can be used as
an alert signal for operators to make them control the
robot more carefully. It could be used to trigger the
measurement of gas sensors.
5 CONCLUSION
With this work we have shown that the MPR is a use-
ful scanning device and can be used in low visibility
environments. The MPR is suitable for applications
such as rescue robotics and field robotics. We have
developed a new fusion strategy in order to reduce the
influence of fog, smoke, dust, etc. on a single LiDAR
scan. Our approach enhances the use for scan regis-
tration based SLAM, where a clean scan is preferred.
Additionally, we introduced the LRR, which can be
used as a fast fog or smoke detector under certain con-
ditions. More data sets involving fog or smoke will be
needed, for further evaluation of our proposed meth-
ods. Future work will include gas and smoke sensors
to investigate correlation with the LRR, the integra-
tion of a data fusion through joint probability distri-
butions for case I and the investigation of outlier re-
duction methods for radar data.
ACKNOWLEDGMENT
This work has partly been supported within H2020-
ICT by the European Commission under grant agree-
ment number 645101 (SmokeBot).
REFERENCES
Adams, M. and Jose, E. (2012). Robotic navigation and
mapping with radar. Artech House.
Breunig, M. M., Kriegel, H.-P., Ng, R. T., and Sander, J.
(2000). Lof: Identifying density-based local outliers.
ACM SIGMOD International Conference on Manage-
ment of Data, 29(2):93–104.
Brooker, G., Scheding, S., Bishop, M., and Hennessy, R.
(2005). Development and application of millimeter
wave radar sensors for underground mining. IEEE
Sensors Journal, 5(6):12701280.
Clark, S. and Dissanayake, G. (1999). Simultaneous local-
isation and map building using milimetre wave radar
to extract natural features. Internation Conference on
Robotics and Automation.
Clark, S. and Whyte, H. D. (1998). The design of a high
performance mmw radar system for autonomous land
vehicle navigation. In Field and Service Robotics.
Detlefsen, J., Rozmann, M., and Lange, M. (1993). 94 hgz
3-d imaging radar sensor for industrial environments.
EARSeL ADVANCEA IN REMOTE SENSING.
Fritsche, P. and Wagner, B. (2015). Comparison of two
radar-based scanning-techniques for the use in robotic
mapping. In Informatics in Control, Automation and
Robotics (ICINCO), 2015 12th International Confer-
ence on, volume 01, pages 365–372.
Grisetti, G. (2005). Improving grid-based slam with rao-
blackwellized particle filters by adaptive proposals
and selective resampling.
Marck, J. W., Mohamoud, A., van Heijster, R., et al. (2013).
Indoor radar slam a radar application for vision and
gps denied environments. In Radar Conference (Eu-
RAD), 2013 European, pages 471–474. IEEE.
Salman, R., Willms, I., Sakamoto, T., Sato, T., and Yarovoy,
A. (2013). Environmental imaging with a mobile uwb
security robot for indoor localisation and positioning
applications. In Microwave Conference (EuMC), 2013
European, pages 1643–1646.
Vivet, D., Checchin, P., and Chapuis, R. (2013). Local-
ization and mapping using only a rotating fmcw radar
sensor. Sensors.
Willeke, K., Baron, P., and Martonen, T. (1993). Aerosol
Measurement: Principles, Techniques and Applica-
tions, volume 6. [New York, NY]: Mary Ann Liebert,
Inc., c1988-2007.
Yamauchi, B. (2010). Fusing ultra-wideband radar and li-
dar for small ugv navigation in all-weather conditions.
Proc. SPIE 7692, Unmanned Systems Technology XII.
ICINCO 2016 - 13th International Conference on Informatics in Control, Automation and Robotics
36
