
An Experimental and CFD Analysis of a Two-Phase Flow Air
Induction Nozzle with Agricultural Application
Foad Vashahi
1
, Sothea Ra
1
, Yong Choi
2
and Jeekeun Lee
3
1
Mechanical System Engineering, Chonbuk National University, 54896, Jeonju-si, Jeollabuk-do, Korea, Republic of
2
Agricultural Engineering, Rural Development Administration, Farming Automation Division, 560-500310
Nongsaengmyeong-ro, Wansan-gu, Jeonju-si, Jeollabuk-do, Korea, Republic of
3
Division of Mechanical System Engineering, Chonbuk National University, 54896, Jeonju-si,
Jeollabuk-do, Korea, Republic of
Keywords: CFD, VOF Model, Two-Phase Flow, Air Induction Nozzle (AIN), Drift Reduction.
Abstract: The two phase flow parametric study on the air induction nozzle is presented with water and air as working
fluid where liquid was supplied at the pre-orifice with various inlet pressures ranged from 3 to 6 bar. The
interaction between air and water at molecular level at the orifice exit leads to forming a strong shear layer
intensified with increase in inlet pressure. Mean diameter and void fraction in each bubble and their
individual shapes is adjusted prior to the desired criteria. Thus, it is vital to regulate the ratio of intake air to
the supplied liquid so that the generated micro bubbles fit the design criteria. CFD analysis was
accompanied via commercial software STAR CCM+ from cd-adapco and validated against experimental
data to find the most appropriate turbulence model. Then, the chosen model is used to investigate design
parameters and their effect on the desired parameters. A volume of fluid (VOF) method of RANS models
used to undertake the air-water interaction. Results of such comparison revealed minor priority of the
Realizable k-ε to the k-ω model. In addition, the unsteady state solution presented remarkable predictions in
compare to that of steady state solution in particular predicting air behaviour.
1 INTRODUCTION
Spray drift is becoming significantly important
aspect of every spray operation. With greater
diversification of crops, higher active or non-
selective herbicides, and greater awareness of
pesticides effects on the environment, spray drift
management has been widespread. Nozzles can play
an important role in drift management due to the
ability to provide a wide range of droplet sizes
which determines how effective the spray deposit is,
and how much the spray itself will drift (Wolf and
Kutcher, 2001). Furthermore, their structure is
relatively simple and low cost.
Air-induction/venturi nozzle systems appeared to
be very promising for improving efficiency and drift
reduction, in particular, for the systemic herbicides
usage. Large droplets generated by these nozzles,
results in a reduction in the surface coverage area
which is implementable in insecticides and
fungicides (Miller et al., 2003 and Tobi et al., 2008).
These nozzles are relatively new; therefor the
mechanism of droplet generation and mixing process
is not fully understood.
The design characteristics of the spray under the
influence of the venturi throat diameter and final
orifice size was investigated (Butler Ellis et al.,
2002). It was shown that increasing both factors
resulted in a rise in airflow rate, as did a reduction in
liquid flow rate. In addition, droplet size was found
affected mostly by the size of the final orifice and
slightly by the air intake. The amount of air sucked
into the nozzle was found highly dependent on the
chemical mixture being sprayed and the nozzle
design (Dorr et al., 2013). Also, the air inclusion was
found crucial for modifying the droplet behaviour
and their impact on target surface and the ability of
spray droplets to retain air bubbles will be a function
of spray liquid properties (Miller et al., 2000). The
air induction design is more sensitive to changes in
physical characteristics of the spray liquid than
conventional hydraulic pressure nozzles.
172
Vashahi, F., Ra, S., Choi, Y. and Lee, J.
An Experimental and CFD Analysis of a Two-Phase Flow Air Induction Nozzle with Agricultural Application.
DOI: 10.5220/0005960601720178
In Proceedings of the 6th International Conference on Simulation and Modeling Methodologies, Technologies and Applications (SIMULTECH 2016), pages 172-178
ISBN: 978-989-758-199-1
Copyright
c
2016 by SCITEPRESS – Science and Technology Publications, Lda. All rights reserved
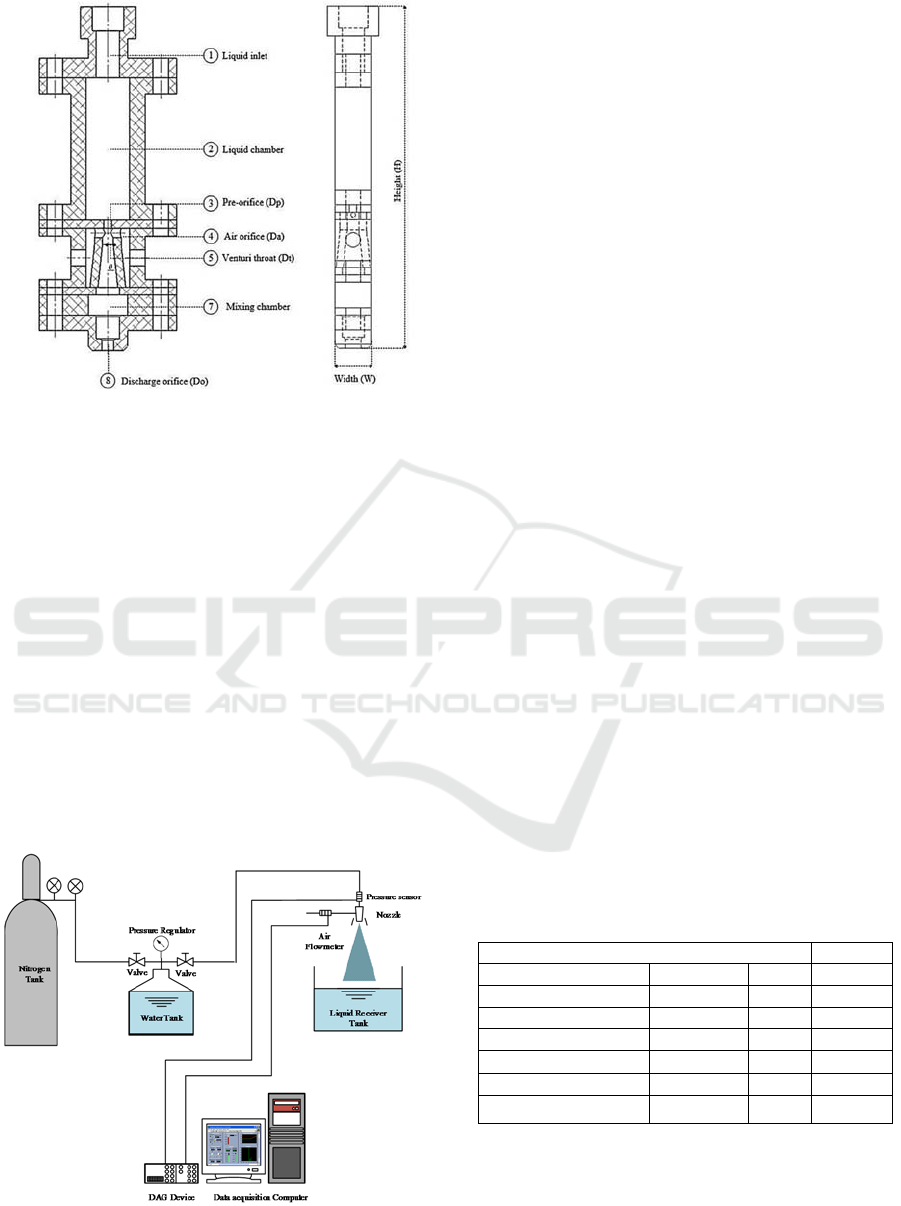
Figure 1: Schematic of the 2D Air Induction Nozzle
(AIN).
The amount of air intake into the nozzle plays an
important role on the air induction nozzle
characteristic. For sure, more research is needed to
verify the effect of several geometrical parameters,
especially strength of each parameter on the spray
characteristic of the nozzle.
Computational Fluid Dynamic (CFD) has found
its way through design process of AIN. A mixture
model of algebraic slip model along with standard k-
ε turbulent model was applied on coaxial flows
(Yadav et al., 2008). This approach required solving
a slip velocity equation along with momentum and
continuity equations for ejector between gas and
liquid. Applying standard k-ε turbulent model for
gas-liquid ejector was confirmed by other scientists
such as (Kandakure et al., 2005 and Li et al., 2012).
Figure 2: Experimental apparatus for the 2D AIN.
It was concluded that the standard k-ε model is
applicable to model the turbulent behaviour of flow
in ejector due to its robustness and reasonable
accuracy. They found that the Standard k-ε model
predicts the entrainment performance satisfactorily
for gas-liquid ejectors. Meanwhile the entrained
mass flow rates calculated by the SST k-ω model
and the Standard k-ε model showed deviation from
the experimental results (Zhu et al., 2009).
In this paper, a comparison of CFD with
experimental results on a 2D AIN is established to
find the proper turbulence scheme and then based on
the validate results a 3D nozzle is developed. The
strength of design parameters on the ALR reduction
is investigated and a theoretical design is proposed.
2 EXPERIMENTAL APPARATUS
The air induction nozzle is composed of several
parts such as: liquid chamber, pre-orifice, venturi
with air orifice, mixing chamber and discharge
orifice as demonstrated in Figure 1. Detailed
dimensions are given in Table 1. Front and back
view of the nozzle were covered by two transparent
acrylic plates which are assembled by bolts and nuts.
Plastic seals were used to prevent fluid leak-out
from the nozzle body. The main facilities
components for this experimental set up are shown
in Figure 2. Liquid (water) is injected to the nozzle
from the pressurized tank. Two ball valves are
located on the top of pressurized water tank and are
used to control the pressure and water flowrate. The
liquid injection pressure of 3 to 6 bar was read at the
liquid inlet port through various experimental
conditions. Liquid receiver is set up at the bottom of
the nozzle and the liquid mass flowrate is measured
from the discharge orifice of nozzle.
Table 1: Detailed description of the 2D AIN.
Part name Units
Height of nozzle H 93.0 mm
Width of nozzle W 10.0 mm
Pre-orifice diameter Dp ϕ 2 mm
Throat diameter Dt ϕ 3.2 mm
Divergent angle
6.0 °
Air orifice diameter Da (equi.) ϕ 3.8 mm
Discharge orifice Do ϕ 4.2 mm
The principle of air induction nozzle suggests that
within the venturi throat section a vacuum pressure
is created and air is drawn into the nozzle through
air orifice side. Thus, mixing with the spray liquid
stream as it passes by while liquid flows from liquid
An Experimental and CFD Analysis of a Two-Phase Flow Air Induction Nozzle with Agricultural Application
173

chamber through the pre-orifice. As the result air-
filled droplets are created. Therefore, system was not
equipped with any air supply tank and air orifice is
opened to the atmospheric with the room
temperature condition of 20°C. It is anticipated that
the amount of air flowrate should change according
to the changing of pressure supply. A NI-LabVIEW
based data acquisition system is used to store all data
from measurement sensor devices. The pressure
sensor (ETM-375-500A) is located before the nozzle
inlet. In addition, in order to measure the
entrainment of air, the gas mass flow sensor
FS4008-50 with a pressure drop of approximately
600Pa is required to be placed right before the air
orifice. This amount of pressure drop is adequately
low so that the measurement is considered highly
accurate.
3 NUMERICAL SCHEME AND
BOUNDARY CONDITION
The analysis was based on the commercial CFD
software STAR CCM+ Version 10.06.010, which
applies the finite volume method. Steady and
implicit unsteady segregated flow solvers were
compared implementing a second-order scheme for
temporal discretization. Volume of Fluid (VOF)
method was used to simulate the interaction of a two
phase flow within the nozzle. The VOF model
describes the fluid phase in the volume with the
assumption of shared velocity, pressure and
temperature fields. Here the iso-thermal solver was
used thus the temperature effects are not considered.
The conservation equation that describes the
transport of volume fractions α
i
is given :
d
dt
α
i
dV
V
+ α
i
v-v
g
da= S
α
i
-
α
i
ρ
i
Dρ
i
Dt
i
dV
VS
Where, α
i
=V
i
/V is the volume fraction, S
and
are the source or sink of the i
th
phase and the
material or Lagrangian derivative of the phase
densities ρ
i
, respectively (cd-adapco, 1987).
The Reynolds averaged Navier stocks (RANS)
approach is used validating against experimental
data. Substituting the Reynolds decomposition into
the Navier-Stokes equations yields the general
equations, which are termed the mean-momentum or
Reynolds equations. The k-ε and k-ω models are
generally classified into the two-equation models
where each is frequently used as solutions to the
RANS equations (Pope, 2000). The Realizable k-ε
model (RKEM) satisfies certain mathematical
constrains for the normal stress that are consistent
with the physics of turbulent flows. In this study, it
is accompanied by a two-layer near-wall-treatment
formulation because the traditional k-ε approach is
not capable of resolving the viscous forces in the
viscous sub-layer.
Air enters from two sides of the nozzle with inlet
boundary condition of zero gauge pressure and
liquid water enters from the top of the nozzle with a
mass flow corroborating to the experimentally
applied pressure. Air and water were treated as
constant density at 21 and 20⁰C respectively. No-
slip boundary conditions and an all y+ treatment
were applied to obtain velocity profiles in wall-
affected regions. Y
+
<5 was achieved by adjusting 8
prism layers near the walls along by applying all y
+
treatment.
The polyhedral mesh was generated from a
maximum of 0.4 mm down to 0.004 mm within the
area where high shear layer is anticipated due to the
interaction of air and water. The total cell count
varied from 5.0 to 8.0×10
5
depending on the
geometrical study. Unsteady simulations were
performed via marching time of 5×10
-5
s within
inner iterations of 5 to achieve a courant number<1.
4 RESULTS AND DISCUSSION
4.1 Turbulence Model Validation
Figure 3 presents a comparison between inlet
pressure achieved experimentally and the calculated
one from the CFD code (The error percentage is
given as [(V
Exp.
-V
CFD
)/V
Exp
] ×100). A slight
overestimation for the equivalent mass flow rate at
inlet was given by the k-ω model (Menter, 1994).
Due to better performance of the k-ε model, the
unsteady case was limited to this model and not
performed for the k-ω one. Steady and unsteady k-ε
results resembled and both well predicted the inlet
pressure. However, unsteady simulation was found
to be superior to other models. It is vital to note that
in terms of simulation time, the steady ones are
preferred. On the other hand, if case is care about
accuracy then the unsteady simulation is the
sophisticated choice and fast solutions should be
sacrificed. Add to this, the comparison of the air-
liquid-ratio (ALR) acquired from the experiment and
CFD given in Figure 4, indicates absolute
superiority of unsteady simulations to that of steady
in both cases of k-ε and k-ω.
SIMULTECH 2016 - 6th International Conference on Simulation and Modeling Methodologies, Technologies and Applications
174
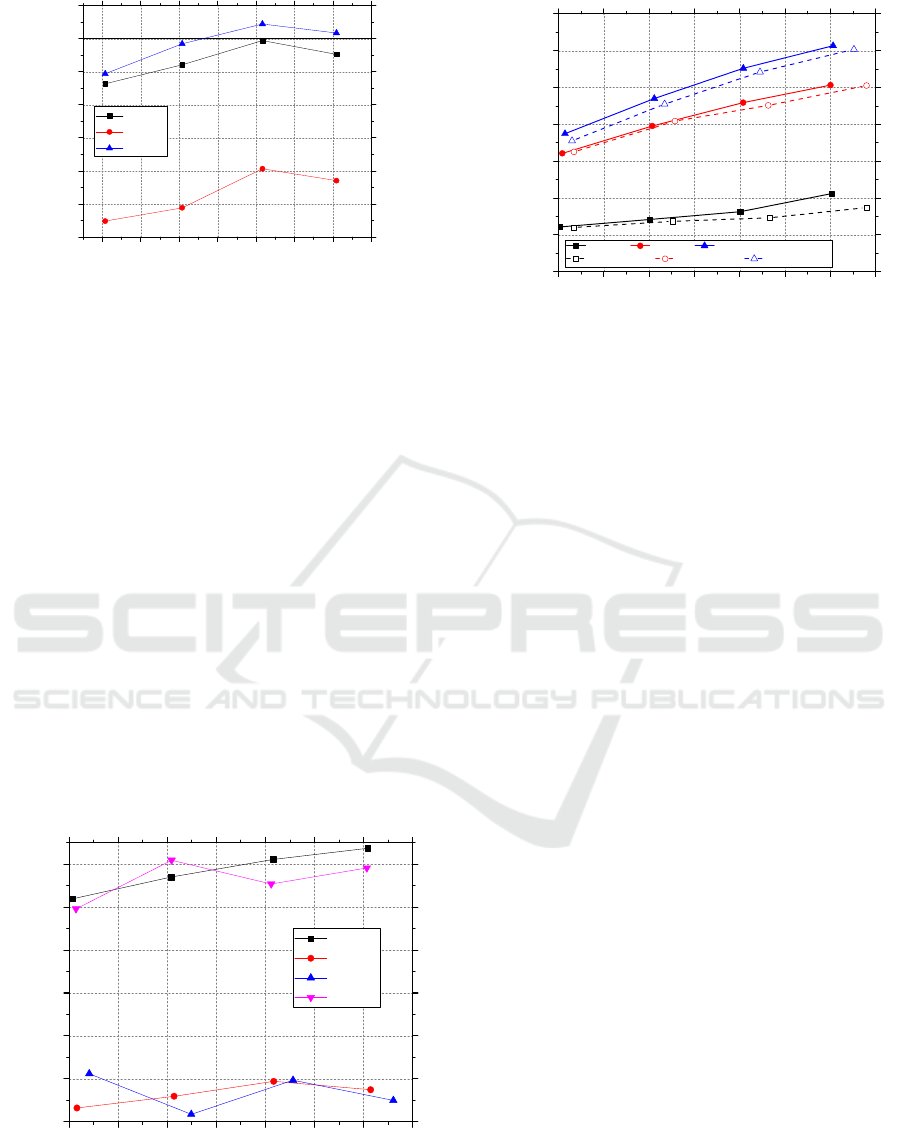
Figure 3: Error percentage of CFD against experimental
data.
This shows the unsteady nature of these flows and
denies the application of steady state solutions to
these cases. Also shows that the VOF method is
applicable to predict the intake air amount and the
ratio of air to water flow. Revealing the unsteady
solver to the steady one, the effect of throat diameter
(D
t
) on the air suction is investigated experimentally
and numerically.
Figure 5, shows two important points. First,
increasing the throat diameter at different inlet
pressures would result in a linear rise in the amount
of air entrained. The reason this is happening is that
increase in throat diameter, simply provide a wider
passage for the entrained flow and less kinetic
energy is required to overcome the liquid flow
exited from the liquid orifice. These effects are more
pronounced varying from certain range of diameter
and become less significant once that certain
diameter is exceeded due to the air excess within the
mixing chamber.
Figure 4: Comparison of the ALR of different turbulence
model for inlet pressures of 3.0, 4.0, 5.0 and 6.0.
Figure 5: Effect of throat diameter (D
t
) on the air
entrainment.
Secondly, although some over and under estimations
are given, the unsteady simulation results were
found to be in agreement with the experimental
results both qualitatively and quantitatively and
provide a prediction capability where no
experimental result is available.
4.2 Parametric Study on the
Theoretical 3D AIN
Since the reliability of the turbulence model with a
certain degree of estimation error was found
acceptable, parametric studies on the 3D AIN were
then performed via CFD as the next step after the
model validation. To this extent, a base model was
designed with an assumption of D
p
remains constant
and then different parameters were modified to
achieve the target ALR<0.00025. A schematic of a
the air/water interaction section from pre-orifice
down to a distance through the divergence section is
given in Figure 6a, to get familiar with the upcoming
introduced geometrical parameters such as D
p
.
Constructed polyhedral mesh given in Figure 6b.
varies at the range of 600,000 cells for different
cases and the same methodology as the 2D AIN was
applied for y
+
, turbulence model and other solver
settings.
Two case of D
a
=0.2 and 1.0 mm was compared
to the base simulation case of D
a
=0.5. Figure 7
shows the effect of decreasing D
a
on the air intake at
inlet constant pressure of 3 bar. It is seen that a fall
in D
a
leads to a decrease in the ALR down to 0.0008
which is still higher than the target value. The effect
of the throat diameter on the air intake is marked
with the red line in Figure 7. Same tendency as the
2D AIN can be seen where the increase in the throat
diameter leads to an increase in the ALR.
3.0 3.5 4.0 4.5 5.0 5.5 6.0 6.5
-6
-5
-4
-3
-2
-1
0
1
Inlet Pressure Error %
P (exp.)
R k-
k-
U R k-
3.0 3.5 4.0 4.5 5.0 5.5 6.0 6.5
0.0016
0.0018
0.0020
0.0022
0.0024
0.0026
0.0028
ALR - Based on mass flow rate of kg/s unit
Pressure
(
bar
)
exp.
R k-
k-
U R k-
3.0 3.5 4.0 4.5 5.0 5.5 6.0 6.5
0.0
5.0x10
-4
1.0x10
-3
1.5x10
-3
2.0x10
-3
2.5x10
-3
3.0x10
-3
3.5x10
-3
Air Flow Rate (kg/s)
Pressure
(
bar
)
D
t
=2.4 mm D
t
=3.2 mm D
t
=3.6 mm
CFD - D
t
=2.4 mm CFD - D
t
=3.2 mm CFD - D
t
=3.6 mm
An Experimental and CFD Analysis of a Two-Phase Flow Air Induction Nozzle with Agricultural Application
175
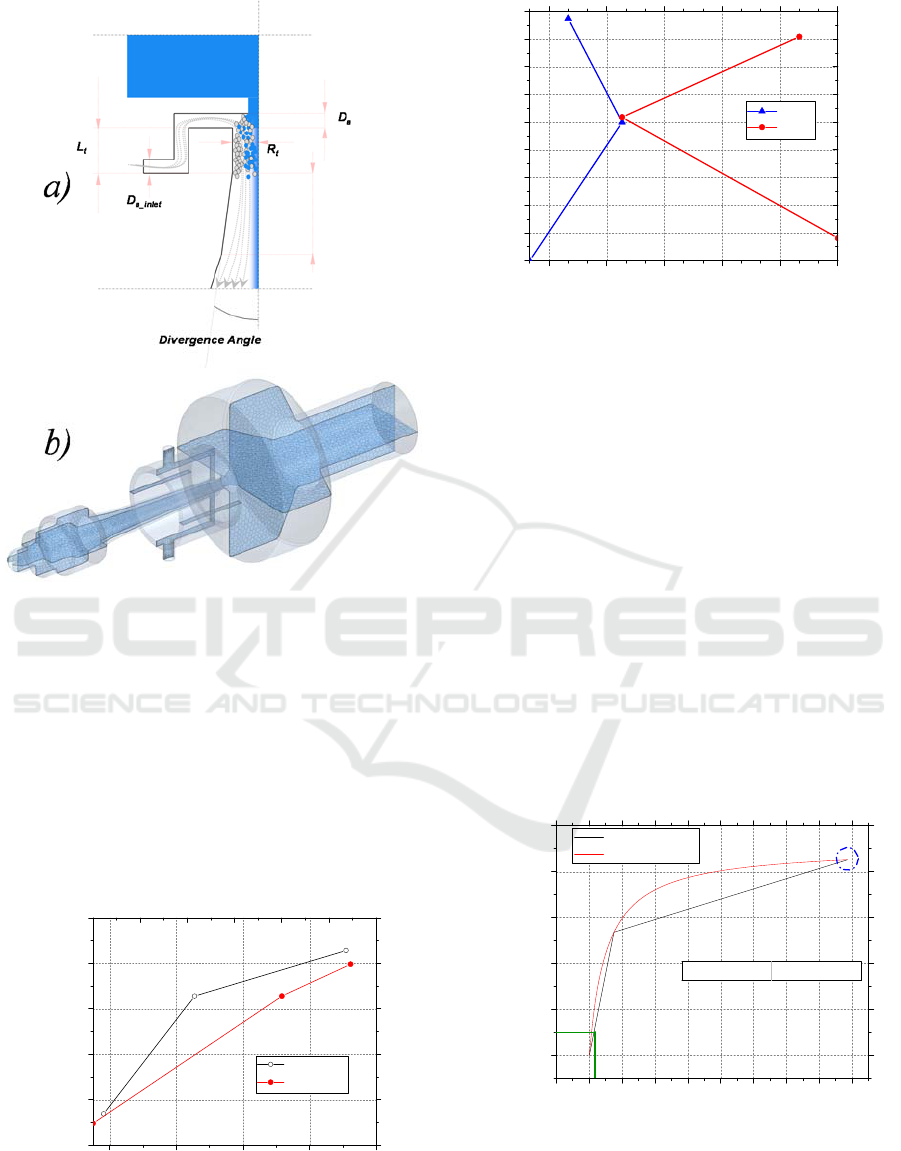
Figure 6: a) Schematic of the interaction area where liquid
meets the entrained air and the geometrical parameters –
b) Polyhedral mesh generation on the 3D AIN concept.
Although the reduction trend of ALR with a
decrease of D
a
occurs with a steeper slope, the
decrement of D
t
down to a minimum diameter of
0.55mm resulted in a slightly lower ALR. Thus, it
can be seen that within roughly the same ratio to D
p
the increase or decreasing amount of air intake
resemble in both cases where the strength is
weighted to the D
t
side.
Figure 7: Effect of Da and Dt on the (ALR).
Figure 8: Effect of Divergence angel and divergence
length on the ALR.
The effect of Divergent Angle and length is given in
Figure 8. Parameters were normalized by the base
angle and D
p
respectively. Zero divergent angle
dictates a state where the mixing chamber is straight
and it is sloped as the angle ratio is increases. It can
be seen that the ALR first increases then decreases.
Yet these changes are insignificant in compare to D
a
and D
t
effects on the air/liquid ratio. At the same
time decrease and increase of divergent length
results shows contradictory behaviour to that of
divergent angle where minimum is located at the
central DL/D
p
at midpoint. This shows that the
mixing chamber and mixing length section are of
minor importance in terms of reducing the ALR.
Study of the reduction air inlet area and how it
affects the ALR is demonstrated in Figure 9. In
general, it shows that any increase in the total area
results in a decrease in the air suction rate.
Figure 9: Effect of air inlet total area (A1+A2).
0.2 0.4 0.6 0.8 1.0
0.0005
0.0010
0.0015
0.0020
0.0025
0.0030
ALR
D
a
/D
p
Effect of D
a
Effect of D
t
1.01.11.21.31.41.51.6
D
t
/D
p
1.95x10
-3
2.10x10
-3
2.25x10
-3
2.40x10
-3
2.55x10
-3
2.70x10
-3
0.0
0.2
0.4
0.6
0.8
1.0
1.2
1.4
1.6
1.8
DA/
ALR
DA/
DL/D
p
0.25
0.50
0.75
1.00
1.25
1.50
1.75
2.00
2.25
2.50
DL/D
p
-0.2 0.0 0.2 0.4 0.6 0.8 1.0 1.2 1.4 1.6
0.0000
0.0005
0.0010
0.0015
0.0020
0.0025
Target Area
Zero Area
Area with Assumption of Constant Velocity
ALR
Area
(
mm
2
)
ALR - CFD
Hill Function Fit
0.01258 2.44367E-4
Base CFD
SIMULTECH 2016 - 6th International Conference on Simulation and Modeling Methodologies, Technologies and Applications
176
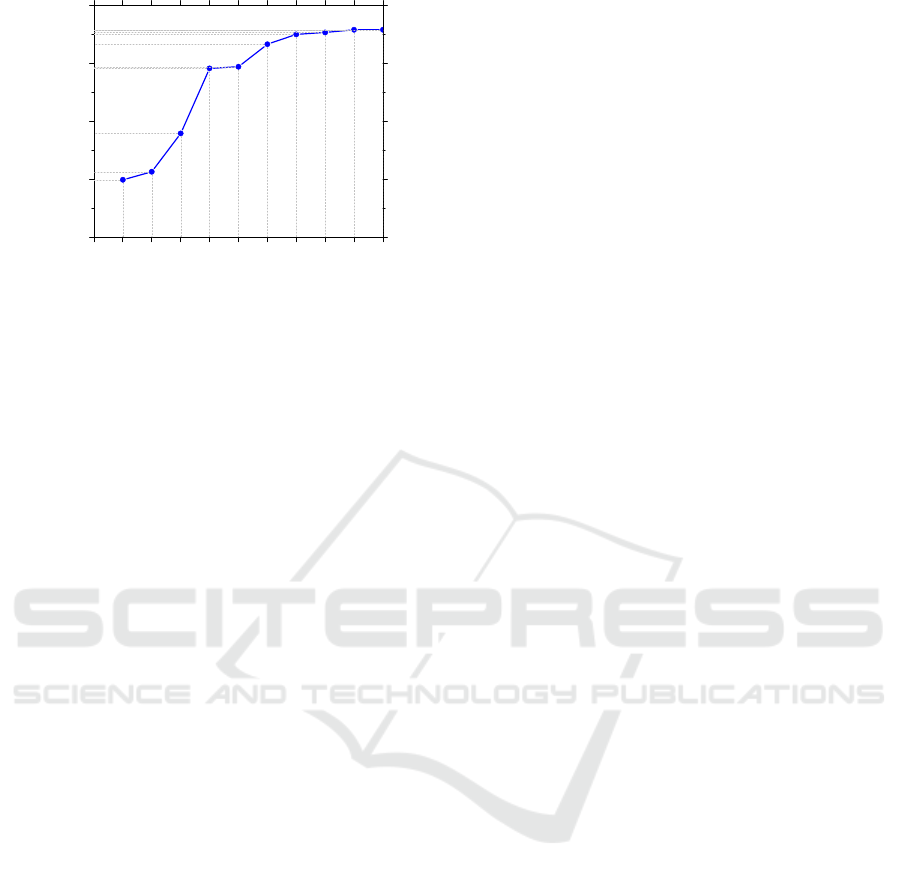
Figure 10: ALR comparison of various study cases – ALR
is normalized to the base CFD results.
Rough estimation of air inlet area with an
assumption of velocity constant gave a 0.18 mm
2
total area for air inlet on bases of simple continuity
equation. Simulation of this predicted area gave an
ALR of 0.0013 indicating the deficiency of the first
assumption. Thus the estimation was enhanced by
the fitted hill function curve to get an appropriate
estimation of the required inlet area. The fitted curve
demonstrates that in order to achieve the target ALR,
the total area on both inlets should be decreased
down to a maximum of 0.012 mm
2
. This cannot be
considered a practical value since it is too small to
manufacture. Different air inlet areas were simulated
and added to the simulation table. But in order to
have a clear look on the parameters and their effects
on the ALR a simple figure is required.
To this extent, a summary of the given study is
presented in Figure 10 where all the parameters and
their effects on ALR are compared. It can be seen
that the major impact on the ALR are of “D
t
, D
a
, and
A” parameters, respectively while the throat length
from varying from minimum, down to air orifice to
its maximum value, has the worst impact on the
ALR by increasing it. However, simulating all these
cases, the ALR did not reach the desired value of
0.00025. Thus, all the geometrical parameters
together should be considered in order to reduce the
ALR to the desired target. A more scrutiny shows
that although D
t
has decreased ALR down to the
minimum in relevance to all the other parameters,
yet the ALR difference for the D
a
was higher. This
indicates that the strength of these two parameters
can be considered higher than the rest in order.
A combination of optimized design parameters
of D
t
/D
p
=1.09, D
a
/D
p
=0.18, and A=0.019 mm
2
altogether gave an ALR of 0.000236 which is
reasonably decreased and falls within the desired
range. It should be noted that the effect of D
p
should
also be considered along with other design criteria
otherwise other dimensions may suggest unrealistic
values.
5 CONCLUSIONS
An experiment on the 2D Air Induction Nozzle
(AIN) was developed and compared to the
simulation results of steady and unsteady k-ω and k-
ε as the first step to design a three dimensional AIN
with agricultural application. It was shown that the
unsteady model superiorly gives better results due to
the nature of flow, in particular, predicting the Air
Liquid Ratio (ALR). Then, the theoretical three
dimensional model was developed and strength of
each parameters such as D
t
,D
a
, air inlet area, L
t
, DA
and DL was studied while keeping the D
p
constant.
It was found that the D
t
and D
a
have the highest
impact on the ALR where the throat length has the
least effect in decreasing ALR. An optimized 3D
model was then simulated and an ALR of 0.000236
achieved.
ACKNOWLEDGEMENTS
This work was carried out with the support of
“cooperative Research Program for Agricultural
Science & Technology Development (Project No.
PJ011719)” Rural Development Administration,
Republic of Korea.
REFRENCES
Wolf, T. M., Kutcher, H. R., March 2001. Spray
application methods to maximize sclerotinia control in
Cansada with foliar fungicide, Canola Agronomic
Research Program (CARP AG#98-23), final report.
Miller, P. C. H., Powell, E. S., Orson, J. H., Kudsk, P., and
Mathiassen S., September 2003. Defining the size of
target for air induction nozzles, The Home-Grown
Cereal Authority (HGCA), project report 317.
Tobi, I., Saglam, R., Turgut, M. M., October 2008.
Equipment and application techniques reduced
agricultural pesticide drift, 10th International
Congress on Mechanization and Energy in Agriculture
Antalya-TURKIYE.
Butler Ellis, M. C., Swan, T., Miller, P. C. H., Waddelow,
S., bradly, A., Tuck, C.R., 2002. Design Factors
affecting spray characteristics and drift performance
of Air induction nozzles. Biosystems Engineering
82(3), 289-296.
D
t
min
D
a
min
ADL
min
AD
t
max
DL
max
D
a
max
L
t
min
L
t
max
0.00
0.35
0.70
1.05
1.40
ALR
Design Parameters
/ALR
Base
Cases
An Experimental and CFD Analysis of a Two-Phase Flow Air Induction Nozzle with Agricultural Application
177

Dorr, G. J., Hewitt, A. J., Adkins, S. W., Hanan, J.,
Zhang, H., Noller, B., 2013. A comparison of initial
spray characteristics produced by agricultural
nozzles. Crop Protection 53 (2013) 109-117.
Miller, P. C. H., Butler Ellis, M. C., 2000. Effects of
formulation on spray nozzle performance for
applications from ground-based boom sprayers. Crop
Protection 19 (2000) 609-615.
Yadav, R. L, Patwardhan, A. W., 2008. Design aspects of
ejectors: Effects of suction chamber geometry.
Chemical Engineering Science 63 (2008) 3886 – 3897.
Kandakure, M. T., Gaikar, V. G., Patwardhan, A. W.,
2005. Hydrodynamic aspects of ejectors. Chemical
Engineering Science 60 (2005) 6391-6402.
Li, C., Li Y., Wang L., 2012. Configuration dependence
and optimization of the entrainment performance for
gas-gas and gas-liquid ejectors. Applied Thermal
Engineering 48 (2012) 237-248.
Zhu, Y., Cai, W., Wen, C., Li, Y., 2009. Numerical
investigation of geometry parameters for design of
high performance ejectors. Applied Thermal
Engineering 29 (2009) 898–905.
Pope, S.B., 2000. Turbulent Flows, Cambridge University
Press.
Menter, F. R., 1994. Two-equation eddy-viscosity
turbulence models for engineering applications. AIAA
Journal, Vol. 32, No. 8 (1994), pp. 1598-1605.
Cd-adapco, 1987. STAR-CCM+ manual, Version
10.06.010.
SIMULTECH 2016 - 6th International Conference on Simulation and Modeling Methodologies, Technologies and Applications
178
