
A Metropolitan Area Living Lab based on a Wireless Sensor Network
Jorge Arturo Pardiñas-Mir, Luis Rizo-Dominguez, Luis Eduardo Pérez-Bernal,
Tino Hohler and Marino Esteban Pérez-Dorador
Electronics, Systems and Informatics, ITESO University, Periférico Sur 8585, 45604, Tlaquepaque, Mexico
Keywords: Living Lab, Wireless Sensor Networks, Smart Cities, Environmental Monitoring.
Abstract: This paper presents a Living Lab based on a wireless sensor network with a metropolitan area dimension. It
is an experimental infrastructure providing real conditions to facilitate the development and testing of
technological solutions in the context of a smart city in subjects such as wireless sensor networks, wireless
data transmission, web services, software analytics and visualization systems. The first stage of the Lab is the
development of a base target application for sensing the environmental conditions at various locations in an
urban area.
1 INTRODUCTION
The concept of Living Lab has many meanings, being
the most mentioned the one which states that is a
living environment which houses both people and
technology, in a semi experimental setting that
promotes symbiotic innovation, development and
research (Chin and Callaghan, 2013). This
signification is sometimes extended or limited
according to the vision behind a particular
application. (Del Vecchio et al., 2014) presents a
review of the literature and contributions about the
Living Labs focusing on their implications for the
development of entrepreneurial competencies. In the
field of education, for example, (Justice and Do,
2012) presents a living lab to promote learning
through challenging real-life hands-on experiences
that are supervised by faculty, students and staff. In
(Vicini et al., 2012) the Living Lab design approach
is applied into a paediatric section of a hospital to the
understanding, studying and measuring of the
interaction between children and services and the
potential of Internet of Things in innovation. This
paper defines the Living Lab as an experimental
infrastructure with an urban area dimension,
providing real conditions to facilitate the
development and testing of technological solutions in
the context of a smart city. The technical contribution
of this work is to bring to the entrepreneurial and
educational community a platform that allows quick
access to the validation of the concept of a new
product, to generate experience, and eventually
identifying new products to strategic markets in five
main lines of technologies: wireless sensor networks,
wireless data transmission, web services, software
analytics and visualization systems.
The design and implementation of the proposed
system has as base target application the sensing of
the environmental conditions at various points in an
urban area. This will let characterize the air quality in
the zone, generating information that can be exploited
and analysed by additional software tools. The main
features of the system defined for the first stage were
the use of wireless technology for interconnection,
being hybrid in such a way that it allows the
coexistence of different wireless technologies, an
open architecture that allows the system to easily
expand and improve, the ability to add additional
sensors, and its ease of being replicated. The system
built for this application stays in a stage ready to be
used for other kind of applications, starting to play its
role as a Living Lab. It was already being used into
an Internet of Things university course.
Section 2 presents the context of the application
for the first stage of the Living Lab. Section 3
describes the elements of the system while Section 4
shows the results of the first stage of deployment.
Finally, some conclusions and a discussion of the
future work are introduced.
158
Pardiñas-Mir, J., Rizo-Dominguez, L., Pérez-Bernal, L., Hohler, T. and Pérez-Dorador, M.
A Metropolitan Area Living Lab based on a Wireless Sensor Network.
DOI: 10.5220/0005970501580164
In Proceedings of the 13th International Joint Conference on e-Business and Telecommunications (ICETE 2016) - Volume 6: WINSYS, pages 158-164
ISBN: 978-989-758-196-0
Copyright
c
2016 by SCITEPRESS – Science and Technology Publications, Lda. All rights reserved
2 MONITORING
ENVIRONMENTAL
CONDITIONS
There are two application goals for the Living Lab at
this first stage. One is to have a computational tool for
acquiring information to help the forecasting of
environmental contingency situations, for example,
to prevent when a pollutant could exceed its
allowable limit. The second, is the monitoring of
environmental conditions around the most important
forest in the city. This serves to identify the way and
speed in which the forest is degraded because of
urban growth and to help taking corresponding
actions to support the survival of the forest.
According to international standards (EPA, 2013), it
was decided to monitor the so called criteria
pollutants: the ozone, the carbon monoxide, the
sulphur dioxide, the nitrogen dioxide and particulates
less than 10 microns (PM10). Unlike employ a
weather station for measuring ambient air pollutants,
as is usually done, the use of wireless sensors can
provide a more practical, economic and smaller
solution at the possible expense of the measurement
accuracy.
To identify the technological possibilities used in
this kind of applications, some examples reported in
the literature can be mentioned. A system measuring
carbon monoxide and fine particles is reported in
(Wang et al., 2012) and (Liu et al., 2012). It is based
on an electronic card using a low power consumption
microcontroller from Texas Instruments and a ZigBee
radio circuit. The sensors are solid state and low cost.
The wireless network is controlled by a Gateway
based on an industrial personal computer. A different
approach is proposed in (Devarakonda et al., 2013),
where a mobile sensor sends the detected values
wirelessly by a cell phone linked to a server in
internet. This makes the information available on the
web. Here two kind of nodes are proposed, one to be
placed on a vehicle and one to be carried by a person.
The first one is built based on an Arduino card and a
cellular communication shield with both a fine
particles and a carbon monoxide sensors. The
personal node uses a commercial device named
NODE having the ability to measure carbon
monoxide, moisture, temperature, atmospheric
pressure and ambient light. Finally, a different
approach is presented in (Boubrima et al., 2015),
where a model is described to position environmental
pollution sensors in a city in order to lower the cost of
implementation, being the number of sensors the
main objective.
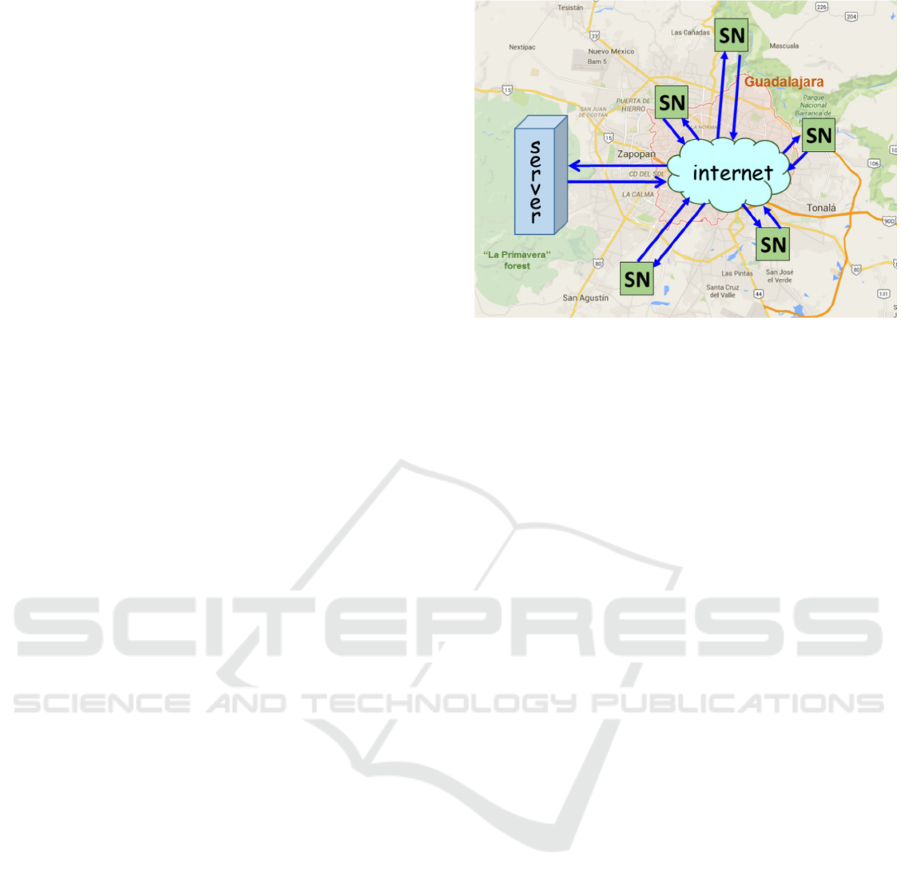
Figure 1: General view of the proposed system.
3 SYSTEM OVERVIEW AND
DESCRIPTION
As mentioned before, the proposed system is a
wireless network of sensor nodes (SN) dedicated to
measure the air quality at different places of an urban
area, as shown in Figure 1. The collected information
is stored on a server on the internet and made
available for consultation. Similarly, a website and a
mobile application allow access to the information.
3.1 General Structure and Operating
Principle
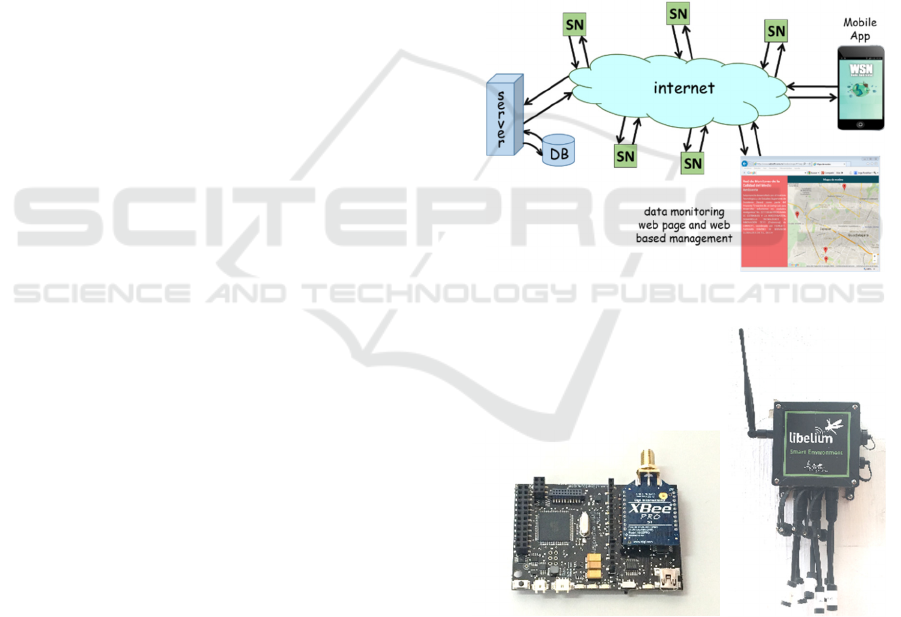
The structure of the system consists of the following
elements, illustrated in Figure 2.
Several sensor nodes. Each node with the sensors
to measure the pollutants. They can be connected
to the internet through different kind of wireless
links;
A server on the Internet. It keeps track of each
node and stores the collected information in a
database. It also provides web services necessary
for the operation of the website and the mobile
app;
A web application that allows system
management. To add and delete nodes, to add and
delete sensor variables to be measured, and to
assign a location to each node;
A Web page and a mobile application. They show
the position of the sensor nodes on a map and
provides current and historical values of the
sensors.
First, the way in which the system operates was
defined, establishing the main characteristics of each
A Metropolitan Area Living Lab based on a Wireless Sensor Network
159
element of the system. The main operation of the
system is based on the communication between the
sensor nodes and the server. For this an own protocol
for messages exchange was defined. Starting from the
normal state of the node, low power consumption, it
periodically awakes and perform some tasks such as
to take samples of the variables to be measured, send
them to the server, and ask the server for a specific
action to be done. The server is continuously listening
for node messages and eventually can ask the sensor
node for some action.
For the sensor nodes we used off-the-shelf devices
that we specifically programmed for the system, for
which we created some particular libraries. We
defined a communication protocol between the nodes
and the server as well as a gateway to cope with the
ZigBee technology. We developed all the needed
software, web services, web pages, and the mobile
applications. In the following subsections we describe
the characteristics of each element and some of the
challenges for its realization.
3.2 The Sensor Node
The sensor node is the starting point of the system. In
order to maintain its electrical autonomy its operation
was defined to remain in a low power state most of
the time and periodically awake and perform the
following tasks: to take samples of the variables to be
measured, to store locally those values, and connect
to the server and perform requested actions such as
data transfer to the server, changing settings, etc.
The choice of the technology to be employed for
the sensor nodes took into account the following
requirements:
Ability to quickly deploy a solution;
Being easily configurable or programmable;
Having a set of robust basic libraries ready to be
used in different applications;
Ability to enhance its hardware platform;
Interoperability of wireless technologies.
We analysed four possible options that could meet the
requirements:
Fully design the sensor node;
Use of general purpose electronic control devices
such as Arduino and Raspberry Pi;
General purpose off-the-shell wireless sensor
devices, like Digi’s XBee and Memsic’s sensor
nodes;
Specific Application, open architecture, wireless
sensor nodes, like Libelium’s Waspmote.
We found that the option that best fulfilled the requi-
rements was the Waspmote from Libelium, a Spanish
company mainly dedicated to wireless sensor
networks products (Libelium, 2016). Either way,
being a device with an open architecture, the
development of the system took into account the
possibility of using any other technology and not
staying constrained to the use of only one provider.
These Waspmotes are based on a controller card
using an ATmega1281 microcontroller, a real time
clock and a solar cell rechargeable battery controller.
The sensor interfacing is done through special adapter
cards with the possibility of using user made
customized cards. It exists two versions of the
Waspmote, one aimed to experiment and develop
OEM solutions, and the other called Plug&Sense
aimed to quickly deploy the device for a specific
application, they are shown in Figure 3.
Figure 2: Elements of the wireless sensor network system.
Figure 3: The Waspmote OEM version, left, and the
Plug&Sense! Version, right.
The communication between the nodes and the
network for the first stage of the project follows two
connection strategies related to two different
application scenarios. The one without a near
connection to the internet, where a link through a
ZigBee network from the sensor node to a gateway
WINSYS 2016 - International Conference on Wireless Networks and Mobile Systems
160
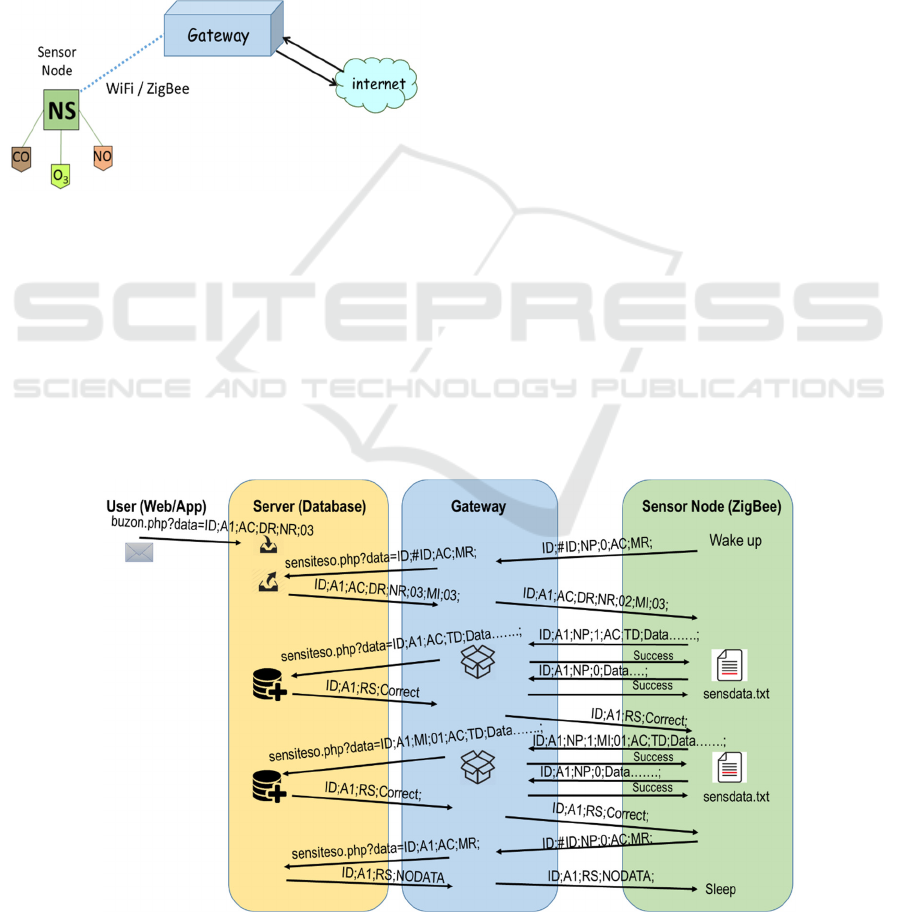
with internet connection is used. The second scenario
envisages having a close internet connection, where a
link through a wireless local area network can be
established. We also considered and tested a GPRS
link, but at the time of writing this document we still
haven´t deployed a sensor node with such a
communication technology. In both application
scenarios it is necessary to have a Gateway that can
receive signals from the node and send them over the
internet to the server. This situation is shown in
Figure 4. For the WiFi case a commercial wireless
router was used, while in the ZigBee case a
customized Gateway was built.
Figure 4: Communication between server and nodes
through a Gateway.
3.3 The Server
The server consists of a set of web applications and
web services that perform as a whole the following
functions:
To periodically request to the sensor nodes the
data collected and stored in its local memory;
To make available the database on the Internet;
To provide information related to the nodes
connected to the system, such as geographical
position and sensor variables that can be
measured;
To provide information to the user related to the
data being collected from the system;
To provide an interface for managing nodes (add,
delete and modify) and communicate with them
(action messages).
As mentioned before, a proprietary protocol for
exchanging messages between the sensor nodes and
the server was defined. The main command is the
Data Request (DR) and Transmit Data (TD) pair, for
which the node prepares the information and sends it
to the server. Figure 5 shows the flow of messages
between the sensor node and the server for this
function in the particular case of using a ZigBee link.
In this case, because of limits in length of a ZigBee
frame, the information from the sensor node must be
divided in smaller packets in order to be managed by
the ZigBee gateway which repack them and send
them to the server as a one whole frame.
At the beginning, the sensor node awakes and
sends a message request (MR) to the server through
the ZigBee gateway. The gateway passes the message
directly to the server. The server responds with a Data
Request (DR), message that is directly passed from
the gateway to the node. The sensor node prepares the
data and because its length is longer than a standard
ZigBee frame, it is divided in 2 packets for the case
illustrated in Figure 5. The gateway collects the two
packets and builds a single frame to send to the server,
who finally responds confirming the good reception
Figure 5: Time chart example of the communication protocol.
A Metropolitan Area Living Lab based on a Wireless Sensor Network
161
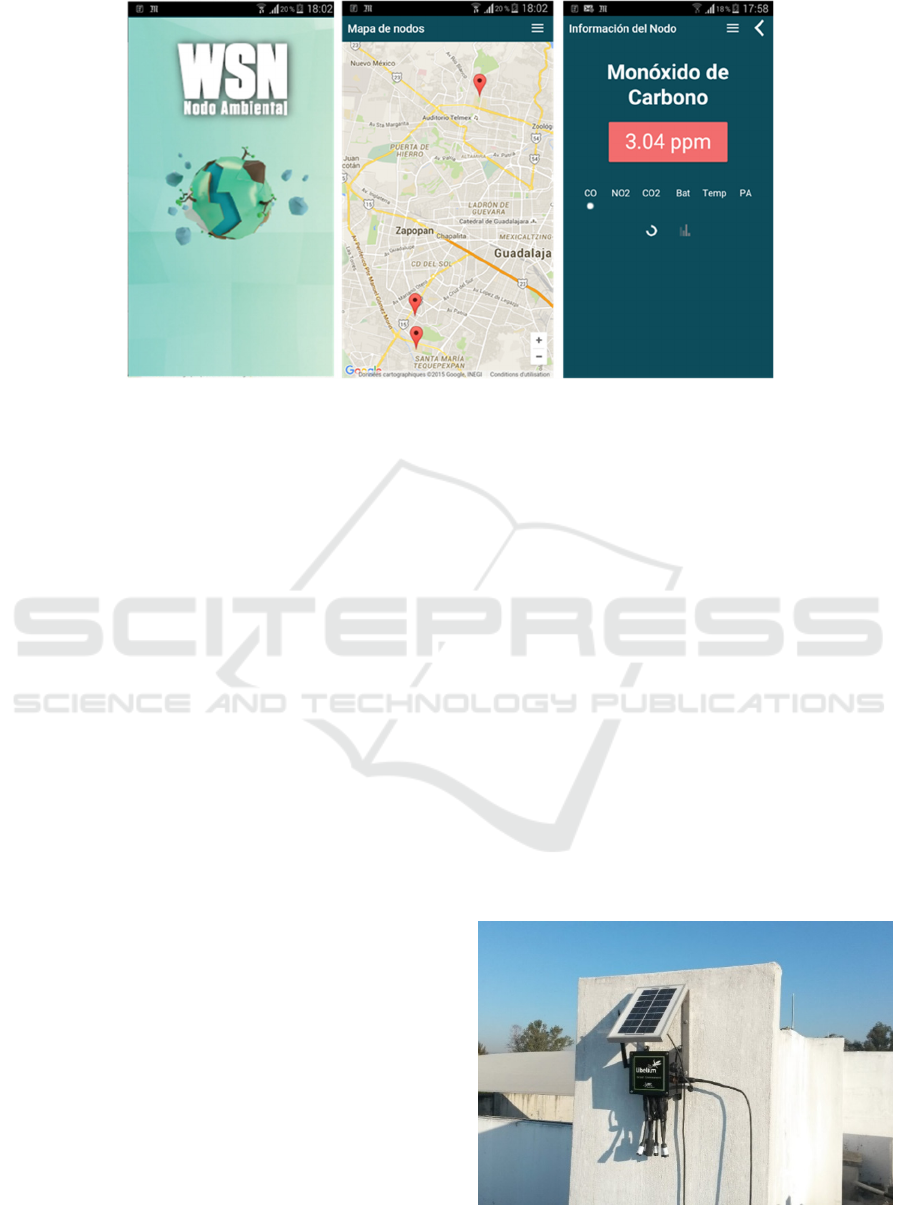
Figure 6: Screenshots of the mobile application.
of the frame with a Correct message.
This way of interacting between the gateway and
the node allows to build standard frames to be sent to
the server, avoiding the use of an exclusive treatment
of data for the ZigBee case at the server.
3.4 System Management Web
Application
The system management is made through a web
application developed in php and running in the
server. It allows to register, unregister, and edit the
sensor nodes and its characteristics, and to make the
same thing with the sensor to be employed. For each
node you can fix its protocol identifier, its position,
and the different sensors associated.
For each sensor you can fix the label to be used in
the protocol, and the name and units to be shown in
the information display application. According to
this, the system allows you to add any new sensor to
be measured and to associate any sensor to a
particular node independently of the rest of nodes and
sensors.
This gives the system the versatility of not being
constrained to only one kind of application.
In addition to the functions above, the
management application can generate a set of basic
data reports, either by node or by dates.
3.5 Website and Mobile Application
The website and the mobile application were
developed to show the information collected by the
system in a simple way. The first one is optimized for
a computer screen, while the second one is optimized
for a mobile device.
The function assigned to these elements is to
display the following information:
The position of the sensors on a map;
The sensors associated to a node;
The latest value of a chosen sensor;
The historical values of a chosen sensor.
Figure 6 illustrates the appearance of the mobile
application.
4 RESULTS
As the time of writing this paper, 4 sensor nodes have
been deployed along the city. Figure 7 shows one of
the nodes installed on a roof. They measure 4 of the
criteria pollutants: ozone, carbon monoxide, carbon
dioxide, and nitrogen dioxide, plus air temperature
and relative humidity.
Figure 7: A sensor node located at the roof of the
department building.
WINSYS 2016 - International Conference on Wireless Networks and Mobile Systems
162
Three of the deployed nodes are connected to the
internet via WiFi while the fourth one is connected by
a ZigBee gateway. The ZigBee connection is made up
with XBee ZigBee S2 radio modules from Digi
International. Each node has been powered with a 3.7
V - 6600 mAh battery rechargeable through a 7V –
500 mA solar cell.
The debugging of the node and the server program
was made possible through the use of two specially
developed web services intended to closely follow the
different stages of the system. A log service shows all
messages exchanged between the server and the
nodes, and a read service lists a number of latest
information frames being stored in the server. Table
1 shows an example of the data corresponding to one
information frame.
In the first stage of the project it was chosen to use
standard sensors with a medium accuracy. The values
collected will be analysed and compared to reference
sensors of a higher accuracy in order to adequately
calibrate the standard ones. Figure 8 shows a screen
corresponding to the historical values of one of the
sensors measuring the temperature of the
environment.
Table 1: Sample of registered data.
id id Node
17606 A1
data
{"id":"A1","ac":"td","ts":"2016-03-28T18:06:14-
0400","bat":"97","temp":"31.61","hum":"6.79","c02":"2.72","
no2":"0.14","03":"0.00","co":"0.87"}
date_hour
2016-03-28 18:06:14
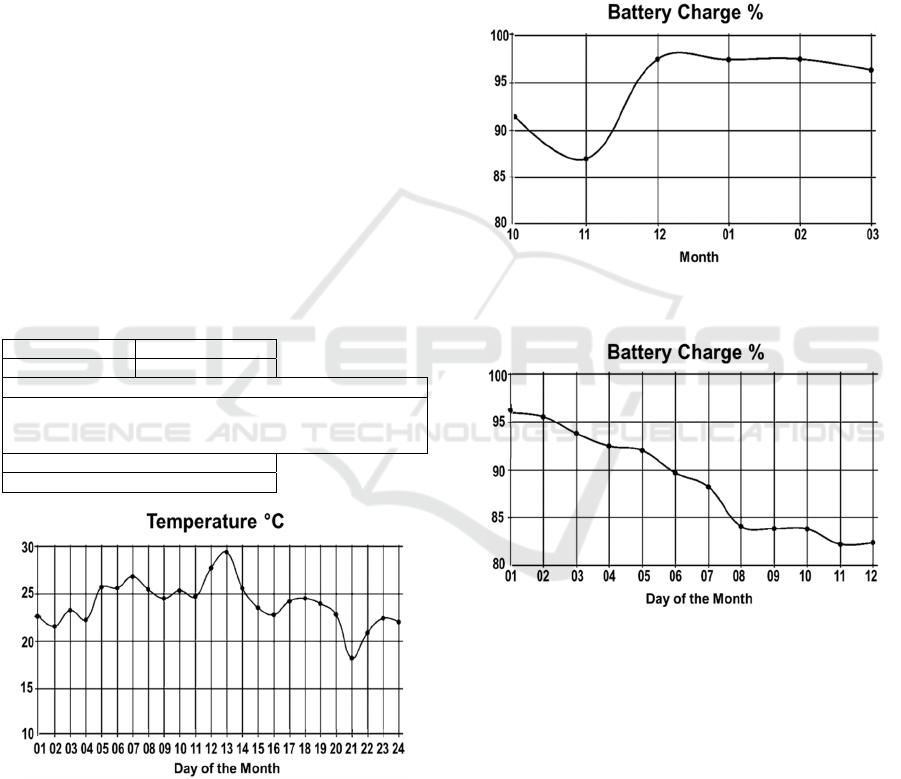
Figure 8: One month historical values graph for the
temperature of the environment.
The performance of the electrical autonomy of the
nodes was monitored through the charge capacity of
the batteries. It was found that the nodes rest
autonomously powered by the rechargeable battery
and the solar cell. This is the case for two of the nodes
which have lasted for more than 5 months without
additional powering. The other two nodes were
powered recently. Figure 9 shows the average charge
percentage of the battery of one of the nodes for the
last 5 months. The performance of the charge capacity
of the battery without recharging was also tested.
Figure 10 shows that after almost two weeks of
operating without solar cell the charge of the battery
dropped from 97 % to near 80 %, meaning that during
a similar period the node can survive before a new
recharge in case of a failure of the solar cell.
Figure 9: Average charge percentage graph of a node’s
battery with solar cell during 5 months.
Figure 10: Average charge percentage graph of a node’s
battery without solar cell during twelve days.
5 CONCLUSIONS AND FUTURE
WORK
This paper presents the development and some
experiences regarding the implementations of a
whole system for monitoring the air quality at
different locations in a city through a wireless sensor
network and an internet based information and
management system. All of this working under real
conditions. It represents the materialization of an
infrastructure to experience and validate tangible
A Metropolitan Area Living Lab based on a Wireless Sensor Network
163

concepts and proposals to develop solutions to the
problems present in cities, a Living Lab for smart
cities.
In the first stage of development of the system 4
sensor nodes have been deployed and its good
operation has been verified.
In the next stage of development the calibration of
the standard sensors employed in the system will be
adjusted compared to factory calibrated accurate
sensors. New sensor nodes will be added to the
system using new communication links as 3G and
LoRa.
The use of the system as a Living Lab has already
started into an undergraduate course about wireless
sensor networks and Internet of Things. It has also
began the collaboration with a research group
dedicated to strength a buffer and transition zone
around the most important forest near the city aimed
to the conservation of the forest. The location of next
nodes will be set according to the objectives of the
group.
ACKNOWLEDGEMENTS
This work was supported by CONACYT and Hewlett
Packard Centro de Servicios Globales S. de R.L. de
C.V. through ProInnova 2015 funds.
REFERENCES
Chin, J., Callaghan, V., 2013. Educational Living Labs: A
Novel Internet-of-Things Based Approach to Teaching
and Research. In 2013 9th International Conference on
Intelligent Environments, Athens.
Del Vecchio, P., Elia, G., Ndou, V., Secundo, G., Specchia,
F., 2014. To what extent the practice on living labs
match with the theoretical framework? The case of
VINCENTE Living Lab for the creation of technology
entrepreneurship. In 2014 International ICE
Conference on Engineering, Technology and
Innovation (ICE), Bergamo.
Justice, C., Do, L., 2012. IT experiential learning: The
Living Lab. In Frontiers in Education Conference
(FIE), Seattle, WA.
Vicini, S., Bellini, S., Rosi, Sanna, A., 2012. An internet of
things enabled interactive totem for children in a living
lab setting. In 2012 18th International ICE Conference
on Engineering, Technology and Innovation (ICE),
Munich.
United States Environmental Protection Agency (EPA),
2013. Quality Assurance Handbook for Air Pollution
Measurement Systems, Volume II, Ambient Air Quality
Monitoring Program, EPA-454/B-13-03.
Wang, Ch., Huang, Y., Zheng, X., Lin, T., Chuang, Ch.,
Jiang, J., 2012. A self-sustainable air quality monitoring
system using WSN. In 2012 5th IEEE International
Conference on Service-Oriented Computing and
Applications (SOCA).
Liu, J., Chen, Y., Lin, T., Lai, D., Wen, T., Sun, Ch., Juang,
J., Jiang, J., 2011. Developed urban air quality
monitoring system based on wireless sensor networks.
In 2011 Fifth International Conference on Sensing
Technology (ICST).
Devarakonda, S., Sevusu, P., Liu, H., Liu, R., Iftode, L.,
Nath, B., 2013. Real-time air quality monitoring
through mobile sensing in metropolitan areas. In
Proceedings of the 2nd ACM SIGKDD International
Workshop on Urban Computing (UrbComp '13). ACM,
New York, NY, USA.
Boubrima, A., Matigot, F., Bechkit, W., Rivano, H., Ruas,
A., 2015. Optimal Deployment of Wireless Sensor
Networks for Air Pollution Monitoring. In 2015 24th
International Conference on Computer Communication
and Networks (ICCCN).
Libelium Comunicaciones Distribuídas, 2016.
http://www.libelium.com/ [Accessed February 26,
2016].
WINSYS 2016 - International Conference on Wireless Networks and Mobile Systems
164
