
Impact of Machine Reliability on Key Lean Performance Measures:
The Case of a Flexible Manufacturing System (FMS)
Wa-Muzemba Anselm Tshibangu
Department of Industrial and Systems Engineering, Morgan State University, 1701 E Cold Spring Lane,
Baltimore, MD 21251, U.S.A.
Keywords: Little’s Law, Simulation, Lean Six Sigma, Throughput, Mean Flow Time, Work in Process, Reliability,
MTBF, MTTR.
Abstract: Uncertainty in production systems may arise from different sources including machines, parts, tools or
material handling failures. For this reason the need for the production system to be flexible enough to
respond to unanticipated breakdowns or failures become highly recognized. This paper considers a flexible
manufacturing system (FMS) and analyzes the effect of a combination of various design and operational
parameters on the overall system performance under different machine failures/breakdowns patterns. Three
performance criteria including throughput rate (TR), mean flow time (MFT), work-in-process (WIP), are
analyzed for various machine and AGV scheduling rule combinations over a range of AGV fleet size. These
key Lean indicators are selected because they are tenants of Little’s Law considered as the backbone
equation in Lean Six Sigma methodologies as it advocates the reduction of waste, variability and work in
process around the process in order to reduce the cycle time while increasing quality. Comparison is made
with the performance profile of a system operating in a failure-free mode. The results reveal that machine
and material handling scheduling rule combinations together with the maintenance policy in use may affect
significantly the performance of a production system. The results also show that there is an acceptable level
of machine breakdown (reliability) for which the system performance is similar to a failure free system.
1 INTRODUCTION
Manufacturers and service providers usually need to
deal with a certain number of uncontrollable factors
including variations in input part arrival rate,
probability distribution of the input part type, failure
rate of machines, and rework rate of parts after
inspection, etc. (Tshibangu 2006). Because a
characteristic of demand in a modern economy is
small quantity and high variety of products and or
services, the effects of variations due to these
uncontrollable factors can be drastic. In order to face
increasing global competition manufacturing and
production systems operate with small batches and
high variability of products and or services in
conditions similar to that of a flexible manufacturing
system (FMS). During the operation of such highly
integrated and automation driven facilities (e.g.,
FMS) various components can fail due to different
reasons. The failure of a single component may
force a very expensive machine to idle, and, because
there is limited work-in-process (WIP) within the
system boundary, the entire system can be brought
to starvation or stoppage. Therefore, in these
potentially disruptive environments reliability-
related issues become important because of their
possible negative effect on the overall system
performance. It has been demonstrated that for an
FMS with a given performance reliability, operating
policies for the scheduling decisions also affect the
performance of the system (Sridharan, 2000).
Many analytical tools exist to address these
issues with simulation being one of the most
powerful and extensively used, particularly for
design (Ball and Love, 2009). This is the reason why
this study uses simulation experiments on a flexible
manufacturing system (FMS) to study the effect of
machine reliability on the overall performance of the
system. The research investigates the effect of
scheduling decisions on FMS performances under
various machine failure scenarios. The scheduling
decisions studied in this research include the number
of automated guided vehicles AGVs, the queue
discipline, and the AGV dispatching rules.
Tshibangu, W-M.
Impact of Machine Reliability on Key Lean Performance Measures: The Case of a Flexible Manufacturing System (FMS).
DOI: 10.5220/0005986705670575
In Proceedings of the 13th International Conference on Informatics in Control, Automation and Robotics (ICINCO 2016) - Volume 2, pages 567-575
ISBN: 978-989-758-198-4
Copyright
c
2016 by SCITEPRESS – Science and Technology Publications, Lda. All rights reserved
567

2 MOTIVATION
At present, there is little research available on the
effect of FMS reliability on the overall performance
of the system. It has been shown that for an FMS
with a given performance reliability, operating
policies for the scheduling decisions also affect the
performance of the system (Sridharan, 2000).
However, during the FMS operation, some
disturbances, such as machine and/or AGV
breakdowns, maintenance operations, poor tool
management, may drastically affect the FMS
performance. Depending on the breakdowns
occurrence (frequency) and the length of the repair
(criticality), the system performances such as
throughput time of parts, completion time of parts,
machines and AGVs utilization may deteriorate
significantly. Thus, it is necessary to include the
breakdown aspect of disturbances for a realistic
evaluation of FMS performances.
This research particularly deals with machine
breakdowns and repair in an FMS. Although AGV
system is considered as the backbone component of
an FMS, AGV breakdown is not considered because
the author believes that an AGV is such a critical
component to an FMS that a wise management
decision may consist in investing in redundancy than
incurring loss because of unpredicted unavailability
of the equipment.
3 RESEARCH PROBLEM
The research problem addressed in this study is to
analyze the effect of combination of a pairwise
machine and AGV dispatching rules with a design
problem such as number of vehicles on the
performances of an FMS operating under various
patterns of machine breakdowns. The results are
compared to the same FMS configuration under a
failure-free operating mode.
4 DECISION LEVELS IN FMS
Decision making problems in FMSs are made at
three levels, namely: i) the design level, which deals
with long-term decisions, such as the selection and
layout of machine tools and the material handling
system; ii) the planning level which addresses
medium-term resource allocation decisions, such as
assigning operations and cutting tools to machines,
and iii) the scheduling level, which considers the
execution of orders in the short term, and includes
determining the sequence for processing various
parts on each machine.
4.1 Design-related Problems
Design related problems encompass many aspects
including: i) part types to be produced; ii) process
plan including tooling and tool magazine; iii) type
and capacity of material handling systems; iv) fleet
size (number of vehicles needed); v) speed of
material handling devices; vi) inter-arrival time; vii)
type and size of buffers. Buffers provide queuing
spaces for in-process inventory (In this paper, the
buffer size is considered fixed with a capacity of 10
parts).
4.2 Operational Control Related
Problems
The ability of a manufacturing system to operate in
accordance with the promised potentials depends
heavily on the operational control in force. The
dispatching mechanism controls the flow of material
in the manufacturing system and determines the
release and transfer of jobs (parts) between
workstations. Dispatching rules are either machine-
or material handling-related. Tshibangu (2012)
shows that there is a two-way interaction between
machines and AGVs, and indicates that due to this
two-way interaction, a realistic analysis of AGV-
served manufacturing systems needs to coordinate
both machine and AGV operations.
Therefore, during shop operation, a good
dispatching policy should be integrated to the design
state to maximize the overall system performance. It
is important to note that these scheduling decisions
may be jeopardized by the failure of machines. In
this research the number of vehicles is varied in
order to determine whether or not the increase of
fleet size may be a remedial solution to prolonged
breakdowns.
5 UNCERTAINTY:
ASSUMPTIONS AND
CHARACTERIZATION
This research considers and analyzes the type of
uncertainty related to machine breakdown rates. A
flexible manufacturing system (FMS) is analyzed in
order to evaluate the nature, form and extent of
different machine breakdown rates. Uncertainty in
ICINCO 2016 - 13th International Conference on Informatics in Control, Automation and Robotics
568

this research is characterized by machine mean time
to failure (MTBF). The breakdowns and the
maintenance operations are highly machine
dependent. Therefore, individual machines would
normally have their own reliability and maintenance
requirements.
Although a production environment in reality
contains a variety of general-purpose and dedicated
machines capable of performing various operations,
this study assumes the same reliability for all
equipment, that is, all machines have the same
MTBF. Machine downtime, characterized by the
mean time to repair (MTTR) is a measure of the
severity of the breakdown. This characteristic is
integrated in this research though not fully
investigated. For reasons of simplicity, machine
downtimes are assumed to be constant for all the
machining centers, that is, the MTTR for all
processing centers is identical and has the same
value for all breakdown occurrences.
The FMS studied operates for 3 consecutive
shifts of 8 hours. Machine mean time between
failures (MTTBF) are assumed to be exponentially
distributed with means varying from 150 minutes to
30 minutes, and the MTTR is also considered to be
exponentially distributed with a constant mean of 10
minutes for all failure occurrences. It is assumed that
the reliability function
)(tR , defined as the
probability of no failure for the machine during the
time interval
),0( t , is given by:
[]
ttR
λ
−= exp)(
(1)
where
λ
is a constant hazard rate, and
t
the time.
The results of a system prone to failure are
compared with the same FMS configuration with no
machine failures for operation time of 30 minutes.
The time range of 30 minutes has been considered
this research to include the highest probable
processing time.
6 LITERATURE REVIEW
Sridharan and Babu (1998) use a detailed simulation
study on a typical FMS under two situations: (1) the
FMS is failure free; (2) the FMS is prone to failures.
They develop metamodels for the two types of
FMSs. The metamodels have been found to be
useful for simulating the studied FMSs and for
evaluating various multi-level scheduling decisions
in the FMS. Sridharan et al. (2000) extend their
work and investigate the effects of a multi-level
decisions in a failure prone FMS. Six failure-repair
situations are considered, characterized by the
severity of failure frequency and the length of repair
time for machines and AGVs in an FMS Renna, P.
and Ambrico, M. (2011) examine cycle time and
WIP in a cellular manufacturing subject to dynamic
changes. Wassi Sorro et al. (2012) examine a system
in any of three states: nominal operating state,
degraded state or failure state. The system state is
known only after inspection. A maintenance action
is undertaken when at a predetermined instant an
inspection reveals that the system is in degraded or
failure state. The maintenance action restores the
system to its nominal operating mode with a certain
probability. A periodic type inspection strategy is
used and proposed. In all the studies mentioned
above design and operational categories were
pursued separately. As an innovation this research
study integrates issues from both groups and
investigates the effects of machine failure rate (or
machine reliability) and AGV dispatching rules as
operational variables while considering AGV fleet
size as the design variable in studying FMS
performances.
7 RESEARCH APPROACH
Two heuristics for vehicle-initiated dispatching have
been selected in this study: i) the first come first
serve (FCFS) dispatching rule assigns vehicle to
demands sequentially as requests for AGVs are
received from different machines; ii) the shortest
traveling distance (STD) rule minimizes the time
vehicle travels empty. This rule dispatches the
released vehicle to the machine which is closest to
the idle vehicle. The machine dispatching rules
(queue discipline) considered in this study include:
(1) the short processing time (SPT) rule that
dispatches the job with the smallest processing time
and the first in first out (FIFO) rule that dispatches
jobs sequentially on the machine as the previous part
in the queue has been completed. This leads to 2
2
sets of dispatching rules combinations to be
analyzed, i.e., FIFO/SDT, FIFO/FCFS, SPT/SDT,
SPT/FCFS. The first acronym stands for the queue
discipline (machine scheduling) rule in use, while
the second design the AGV dispatching rule.
For each of these machine and AGV dispatching
rule combination, 5 failure-repair configurations are
examined to evaluate the FMS performance under 5
situations, each one involving a different number of
vehicles. This combination results into a total of 100
Impact of Machine Reliability on Key Lean Performance Measures: The Case of a Flexible Manufacturing System (FMS)
569

simulation experiments to be performed under
various machine breakdowns.
In addition, for each number of vehicles studied
in this research, simulation runs are also carried out
on the same FMS configuration under no failures.
This implies 20 additional simulation runs for the
failure-free situation leading to a total of 120 of
simulation experiments. The results from the failure
free situation are subsequently compared with those
from the FMS prone to failure in the analysis.
8 THE SHOP MODEL
The hypothetical FMS layout used in this paper is
similar to the one used by Tshibangu (2003, 2012).
The job shop model is composed of nine
workstations, including a loading or receiving
station (workstation 1) and an unloading or shipping
station (workstation 9).
8.1 Job Descriptions
All jobs enter the system through the receiving
department and leave the shop through the shipping
department. It is assumed that raw materials are
always available at the loading station and parts that
arrive at the unloading station depart the system
immediately after being unloaded. Each job consists
of only one unit load and is processed and moved
between work stations as a single unit load. AGV
carts move parts between the workstations along a
predetermined mixture of uni- and bi-directional
paths.
8.2 Simulation Model
Jobs are simulated to arrive at random times for the
entire operational period following a Poisson model
because this distribution provides a good
approximation for the job arrival when generating
sources are assumed to be independent. For each
experimental condition the simulation is run with
three independently-seeded replications of 600
minutes each. The first 120 minutes of each run are
truncated to eliminate the initial bias. The remaining
480 minutes representing an operational shift of 8
hours are replicated three times to represent each
daily shift, and the outputs from the three
replications are collected and averaged out across
replications. To simulate a fairy busy system, the
arrival rate of jobs is assumed to be equal to the ratio
of the capacity of the job shop to the average amount
of work required. The arrival rate, denoted by
δ
, is
then given as:
pn
M
*
*
η
δ
=
(2)
where
M = number of machines
η= machine load capacity
n = average number of operations
p
= average operation times
Following this model, various arrival patterns can be
obtained by adjusting the machine load capacity
factor
η
. Changing the arrival rate gives the
experimenter the flexibility to control the degree of
congestion in the shop. In this research, a machine
load capacity of 90%
)90.0( =
η
was assumed in
generating the job arrival process. The jobs were
simulated to have one to 7 different types of
operations, the number being assigned randomly
using a uniform distribution
)7,1(U
. The average
number of operations is
4=n
. The average
operation time of 15 minutes is also extracted from a
uniform distribution model
)25,5(U
. Using Eqn.
(2), a value of the arrival rate
135.0=
δ
has been
used.
8.3 FMS Configuration
The FMS configuration studied is summarized in
Table 1. There are 15 parts types in total, and all the
processing times are assumed to be known
deterministically, since all the machining operations
are computer numerically controlled. Besides, all the
raw materials are assumed to arrive at time zero.
Two different simulation models have been
developed, one for failures free machines failures,
and another for machines prone to failures. The
simulation experiments have been carried out for 4
different combinations of machine and AGV
dispatching rules as operational control input
parameters, with various numbers of vehicles as a
design input parameter. Three performance
measures are evaluated for each configuration and
later compared for further insights and conclusions.
ICINCO 2016 - 13th International Conference on Informatics in Control, Automation and Robotics
570
Table 1: Shop Configuration.
Part Types considered
for production
15
Machines 9 (including one
loading and one
unloading stations)
Material Handling
Systems (AGVs)
Variable from 3 to
15
Buffer Capacity 10 for workstations 2
to 8
Infinite for
workstation 1
Loading/Receiving
stations
1 (workstation 1)
Unloading/Shipping
stations
1 (workstation 9)
8.4 Shop Conditions and Assumptions
A number of simplifying assumptions have been
used for the simulation model, e.g., an AGV
transfers only one unit load at a time; pickup and
drop-off times of a part are set at a constant of 0.25
minutes each; machine failures are time-based
failures; the failure of resource (i.e., machine) will
occur at different rates taken from an exponential
distribution with a certain mean, e.g., EXPO (150);
breakdowns of vehicles (AGVs) are not considered,
etc. The reader is referred to Tshibangu 2006 for a
complete list of all the assumptions used in this
study.
8.5 Performance Evaluation
Three performance measures are used in this study
including i) system throughput per shift (TR); ii)
flow time (cycle time) MFT and iii) number of parts
in the system or work in process (WIP). These key
indicators are consistent with Little’s Law known
the governing equation of Lean Six Sigma
methodology as it evaluates the MFT as the ratio of
WIP to TR. The definitions and formulas of these
measures are provided in the equations below. All
quantities are mean values averaged across the three
replications.
(1) Mean Throughput Rate (MTR), here defined as
the total number of parts (all types confounded)
during a shift. If
pp
i
,...2,1=
is the number of
type
i parts produced during a shift, then:
MTR =
∑
=
=
15
1
p
i
i
p
parts/min (3)
(2) Mean Flow time (MFT), also known as cycle
time for a part
i
p
is defined as the time
i
F
elapsed between its arrival and its departure.
Thus, it is the sum of part’s delay in queues and
its service time. When there are more than one
entity (part) in the model, the total flow time
will include the sum of all flow times (
∑
=
p
i
i
F
1
).
The mean Flow Time in this study is computed
as follows:
∑
=
=
15
1i
i
i
p
F
MFT
(4)
(3) Average number of parts in shop, also called
work-in-process (WIP) is a time-persistent
measure and represents the total number of all
part types present in the system in average
during the simulation time. In this research
study, WIP is computed as follows:
)
480
(
15
1
i
p
i
i
F
p
WIP ∗=
∑
=
=
(5)
9 RESULTS AND ANALYSIS
For each set of machine and AGV dispatching rules,
3 operational shifts of 480 minutes were simulated
with different material handling fleet size and under
different machine reliabilities (or different failure
rates). The simulation results are presented in
separate groups according to the machine/AGV rule
combination used or each performance measure.
Results of the simulation experiments for all
combinations of machine and AGV rules and
number of vehicles are not displayed in this paper
but they may be available upon request.
To answer the research question on whether or
not the combination of sets of machine/AGV
dispatching policies with number of AGVs in a
manufacturing or production environment with
machines prone to various failure rates has an
impact on the performance measures such
throughput rate, mean flow time, and work-in-
process, graphs are plotted and ANOVA models
developed. The data analysis section of this paper is
broken into three sections, one for each dependent
Impact of Machine Reliability on Key Lean Performance Measures: The Case of a Flexible Manufacturing System (FMS)
571
variable (performance measure), and for each
performance measure the effect of fleet size and
machine reliability will be analyzed.
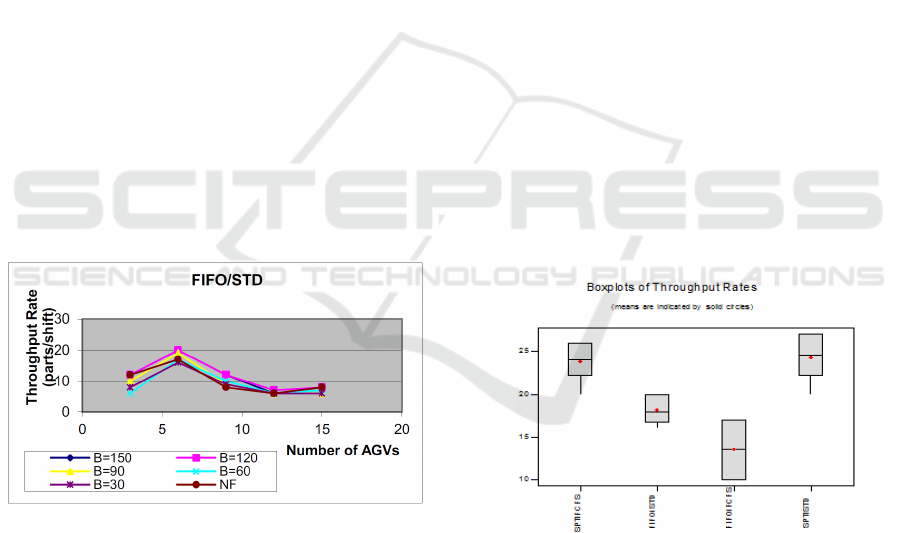
9.1 Throughput Rate
The results of data analysis confirm the author’s
prior knowledge about the impact of number of
vehicles present in a system. Tshibangu (2006)
reported that the throughput behaves in a concave
manner with respect to the AGV fleet size. The
objective in determining the optimal fleet size is to
have the smallest number of vehicles in the system,
but still capable to achieve the performance
requirements. For illustration purpose Figure 1
depicts just the throughput rate TR for SPT/SDT
machine /AGV combination rules.
As the number of vehicles increases in the
system the throughput rate increases due to material
flow capacity. However, beyond a certain number of
vehicles, an addition of more vehicles results in
increasing traffic congestion and blocking of
vehicles leading to a decrease in the throughput rate
as a result of the delay caused to AGVs in
completing their tasks. As noted in Tshibangu
(2006) this is both economical and operational
waste. The highest throughput rate for all rule
combinations is observed with the configuration free
of failures, i.e., machine reliability =100%.
Figure 1: Average (WIP) under Machine SPT and AGV
FCFS.
For a value of MTBF = EXPO (150) minutes or a
machine failure rate λ = 0.0067 per minute
equivalent to a half hour reliability of 82 %, the
system behaves exactly like the zero-failure
configuration.
The reliability is calculated on a 30 minutes time
frame in order to be as close as possible to the
longest possible processing time used in this
research as they are generated from a uniform
distribution
)25,5(U . It can be noticed that the
system TR performance starts to degrade when
failure rates reach values higher than 0.0067 min
-1
,
i.e., for MTBF values less than 150.
In other words, the company production
management board can ensure a good performance
of the system by implementing maintenance policies
that can keep the reliability of the resources
(machines) at a level that will allow the FMS to
behave as a failure-free system. A failure rate of
0.0067 min
-1
or less (i.e., half-hour machine
reliability of 82% or more) may be considered as
good enough to keep the throughput rate at almost
the same level as in a system free of failures.
A widely adopted philosophy in determining the
optimum AGV fleet size recommends the optimum
number of vehicles to be the one that maximizes the
throughput TR of the system. Analysis of the
various output graphs along with pilot simulation
runs revealed that the maximum number of vehicles
needed in the system under study in this research is
equal to six (6) for all set of machine and AGV
scheduling rule combinations.
To test the relative performance of different set of
combinations of machine and AGV rules with respect
to the throughput rates TR, a one-way ANOVA has
been developed but the results are not presented in
this paper for space compliance. However, the
associated boxplots represented in Figure 2 reveal a
significant difference between the performances of
the 4 sets of combined machine/AGV rules tested.
Figure 2: Relative Performance of Sets of Rules on TR.
The highest throughput is achieved by both
SPT/STD and SPT/FCFS, with a slight difference in
favor of SPT/STD. This means that the best queue
discipline is SPT, regardless the AGV dispatching
rule associated with. Results also suggest that FIFO
is the worst queue discipline rule, independently of
the AGV rule used along with. Poor performance of
FIFO/FCFS is not a surprise because these two rules
give respectively priority to the first part in the
queue, or the first AGV available, without any
ICINCO 2016 - 13th International Conference on Informatics in Control, Automation and Robotics
572
considerations about the part attributes (e.g.
processing time) or distance to be traveled to satisfy
a transportation request.
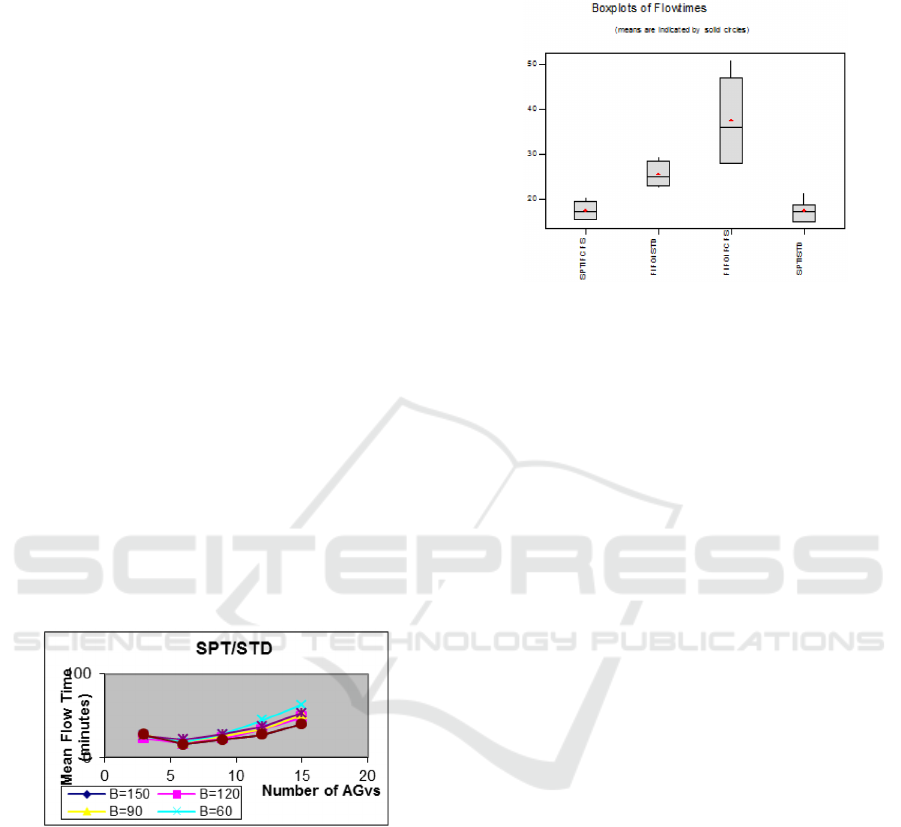
9.2 Mean Flow Time
The mean flow time performances of various
configurations of the system under study for
different levels of machine reliabilities have been
analyzed. Figure 3 depicts the MFT for STP/FCFS
for illustration purposes while the rest of the graphs
at other machine/AGV combination rules can be
obtained upon request. Observation of the various
graphs and plots produced with the study leads to the
conclusion that the mean flow times of a system
prone to machine failure follows the same almost
convex ascendant shape with regard to the fleet size.
When considering the variances on flow times, it
can be observed from the results that mean and
variances of the flow times are correlated, that is a
scheduling combination rules with larger mean flow
time value, also depict a lager variance, with the
only exception for the SPT/SDT.
The mean flow time is moderate when the
number of vehicles in the system is low, and
decreases to a minimum as this number is increased
because of the additional material flow capacity.
However, the addition of more vehicles results in an
increased congestion a higher mean flow time.
Figure 3: Average MFT under Machine SPT and AGV
FCFS.
Therefore, too many vehicles in the system
results in an increase of the mean flow time. The
number of AGVs that minimizes the system’s mean
flow time is also found to be equal to six.
To answer the research question with regard to the
relative performance of machine and AGV scheduling
rule combinations with respect to the mean flow time
ANOVA model and associated boxplots were
developed. The ANOVA results are not displayed in
this paper but can be obtained upon request. However,
analysis of boxplots displayed in Figure 4 reveals a
significant difference between the performances of
various combinations of operational rules.
Figure 4: Relative Performance of Sets of Rules (WIP).
SPT/STD and SPT/FCFS are the best achievers
with a slight difference in favor of the SPT/STD. But
SPT/FCFS has the least variance. A glance on
different mean flow time charts (not displayed in this
paper) reveals that in all situations, the zero-failure
configuration performs better than a system subject to
breakdowns. The effect of breakdowns is proportional
to the failure rate, i.e., the higher the machine failure
rate (or the lower the machine reliability), the higher
the system the mean flow time, and the lower the
machine failure rate (high reliability), the lower the
system mean flow time. Also, when the mean flow
time of the system is used as performance measure,
information from the part is more important than the
distance of the requesting part from the available
transportation device. FIFO/FCFS and FIFO/STD did
not perform well, with FIFO/FCFS being the worst
case. This again suggests that FIFO is not the best
machine scheduling rule when a system is assessed
with regard to the mean flow time.
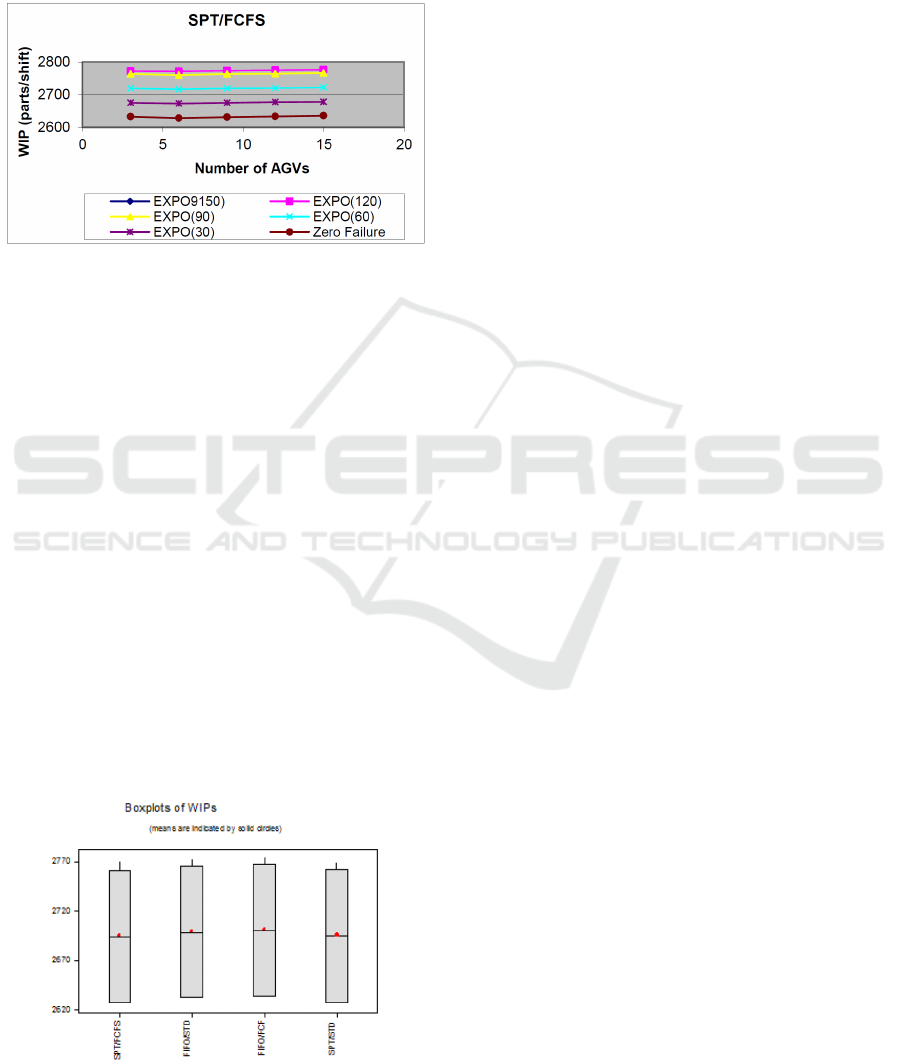
9.3 Average Number of Parts in the
System (WIP)
The average number of parts in the system also
known as the work-in-process (WIP) behaves as
illustrated in Figure 5. The simulation results (not
displayed in this paper) along with the associated
graphs reveal that the fleet size has no effect on the
work-in-process. This almost agrees with Little Law’s
also known as the first law of manufacturing systems.
This law, which is perhaps the most recognized
working principle of production and manufacturing
systems and also used extensively today in Lean Six
Sigma states that: Work-in-process equals to the
production rate times the throughput time.
Impact of Machine Reliability on Key Lean Performance Measures: The Case of a Flexible Manufacturing System (FMS)
573
As pointed out earlier in this paper, the production
rate (also known as throughput rate) first increases
with the number of vehicles in the system until an
optimum fleet size is reached, and then starts to
decrease as more vehicles are added in the system.
WIP = Production Rate x Throughput Time (6)
Figure 5: Average (WIP) under SPT and FCFS Rules.
The throughput time (represented by the flow
time) behaves in the opposite way, i.e., first, an early
decrease is observed when the number of vehicles is
augmented, second, a minimum value is reached,
and third an increase is observed as more vehicles
are added. The two terms in Equation (6) acting in
opposition, their product might tend to be constant.
This would explain why WIP is not sensitive to the
fleet size.
However, the effect of failure rates (or machine
reliability) affects the system as expected. The
lowest WIP values are observed for the zero-failure
configuration for all machine and AGV scheduling
rule combinations. Then, as the failure rate of the
machines increases (reliability decreases), the WIP
increases. To determine the relative performance and
the significance of different machine and AGV
dispatching rule combinations on the work-in-
process (WIP) performance, a one-way ANOVA
model is developed and the different data plotted in
boxplots as shown in Figure 6.
Figure 6: Relative Performance of Sets of Rules on WIP.
The difference between the highest and lowest
WIPs observed for all machine and AGV scheduling
combinations are not really significant, and represent
less than 5% of the average number of parts in the
system. The comparison is conducted under a
configuration system with 6 AGVs, previously
identified as the optimum fleet size.
Detailed analysis of ANOVA results associated
plots of means reveals that statistically there is no
significant difference between the work-in-process
performances of all machine/AGV scheduling rule
combinations tested. The variances for different set
of rules were also found to be identical, suggesting
that the machine and AGV scheduling policy
combination does not seem to have significant
effects on system performance in terms of work-in-
process under the conditions of the present study.
However, this performance measure seems to be
more sensitive to part arrival rates and buffer size as
revealed by earlier pilot simulation runs.
10 CONCLUSIONS AND
FURTHER RESEARCH
This paper has extended the machine reliability
problem into machine and AGV scheduling issues in
flexible manufacturing settings.. System parameters
including the number of vehicles in the system,
machine and AGV scheduling rule combinations
were varied in simulation runs to allow a logical and
fair assessment of system performance measures.
Three performance criteria including throughput rate
(TR), mean flow time (MFT) and average work-in-
process (WIP) are tested in this research to
determine the effect of machine reliability (through
failure rate), fleet size (through the number of
vehicles in the system), and scheduling rules
(through machine and AGV scheduling rule
combinations). The results are then compared to the
same system configuration when operating failure-
free mode. The relative performance of a particular
set of operational rules is determined through
ANOVA procedures, pairwise tests on means,
boxplots, and scattered charts. A system free of
failures has been identified as the configuration that
gives the best results as compared to a system prone
to machine failures. Machine breakdowns have been
found to have a significant impact on the FMS
performances for failure rates larger than 18%, i.e., a
good preventive maintenance policy that can keep
the machine half-hour reliability of machines
ICINCO 2016 - 13th International Conference on Informatics in Control, Automation and Robotics
574

beyond 82% is a guaranty for good performance of
the system.
Results reveal that throughput rate and mean
flow time can be described as a concave, and a
convex function respectively, i.e., each reaches its
optimum (max for throughput, and min for mean
flow time) subject to both trends, the additional flow
capacity and the reduction in flow due to congestion.
This suggests that for both economical and
operational interests best results will be obtained by
operating the FMS with only the maximum number
of vehicles needed in the system. The average work-
in-process seems to be only slightly affected by the
fleet size. With the throughput and the flow time
behaving in opposite directions over the variation of
the fleet size, this result seems to comply with
Little’s law. Selection of particular operational plan,
i.e., machine and AGV scheduling rule combination
has been found to have a significant impact on all
the FMS performances studied in this research with
the exception of the work-in-process that seems to
be insensitive to operational rules in use. However,
pilot simulation runs have revealed that although the
combination of machine and AGV scheduling
policies did not seem to have significant effects of
the average number of parts in the system (WIP),
this performance value is highly affected part arrival
rate and buffer size, i.e., WIP is more sensitive to
part-related attributes than to the operational and
control issues in force. Simulation results have
shown that machine and AGV operational rules
combinations that outperformed with respect to
system throughput rate and mean flow time are
SPT/FCFS and SPT/STD, suggesting that a
combination of operational rules that includes part
information as queue discipline might be the better
achievers. The conclusions drawn in this research
may be completed by further investigation that may
include scheduling rules that consider other
attributes, such as part waiting time, length of queue
in front of a machine, severity of breakdowns
(various MTTR), and the number of part types.
REFERENCES
Ball, P.and Love, D., 2009. Instructions in Certainty,
Institute of Industrial Technology, 29-33.
Renna, P. and Ambrico, M. 2011. Evaluation of Cellular
Manufacturing Configurations in Dynamic Conditions
using simulation: International Journal Advanced
Manufacturing. Technology (2011) 56:1235–1251.
Sridharan, R. and Babu, A.S., 1998, Multi-level
scheduling decisions in a class of FMS using
simulation based metamodels, Journal of the
Operational Research Society, 49, 591-602.
Sridharan, R., Vishnu, A.S., and Babu, A. S., 2000,
Effects of multi-level scheduling policies in a failure
prone FMS: A simulation study. Journal of the
Operational Research Society.
Tshibangu, WM Anselm, 2013. A Two-Step Empirical-
Analytical Optimization Scheme, A DOE-Simulation
Meta-Modeling Approach, 10
th
International
Conference on Informatics in Controls, Automation
and Robotics.
Tshibangu, WM. Anselm, 2006 Robust Design of a
Flexible Manufacturing Systems: A Simulation
Metamodeling Approach, Proceedings of the 2006
Global Congress on Manufacturing and Management
(GCMM’2006), COPEC – Council of Researches in
Education and Sciences, Nov 19-22, Santos, Brazil.
Tshibangu, WM Ans elm. 2012: Lean, Six sigma,
Simulation, and DOE: An Framework to Optimal
Design and Implementation of a Cellular
Manufacturing, A Case Study, Proceedings of the 9
th
International Conference on Informatics in Control,
Automation and Robotics (ICINCO 2012), July 27-31,
2012 Rome, Italy.
Wassy Soro et. al 2010. Production Rate Maximization of
a Multi-State System Under Inspection and Repair
Policy, International Journal of Performability
Engineering Vol.8, No. 4, July 2012, pp. 409-416.
Impact of Machine Reliability on Key Lean Performance Measures: The Case of a Flexible Manufacturing System (FMS)
575
