
AToMRS: A Tool to Monitor Recommender Systems
Andr
´
e Costa, Tiago Cunha and Carlos Soares
Faculdade de Engenharia da Universidade do Porto, Porto, Portugal
Keywords:
Recommender Systems, Collaborative Filtering, Evaluation.
Abstract:
Recommender systems arose in response to the excess of available online information. These systems assign,
to a given individual, suggestions of items that may be relevant. These system’s monitoring and evaluation
are fundamental to the proper functioning of many business related services. It is the goal of this paper to
create a tool capable of collecting, aggregating and supervising the results obtained from the recommendation
systems’ evaluation. To achieve this goal, a multi-granularity approach is developed and implemented in order
to organize the different levels of the problem. This tool also aims to tackle the lack of mechanisms to enable
visually assessment of the performance of a recommender systems’ algorithm. A functional prototype of the
application is presented, with the purpose of validating the solution’s concept.
1 INTRODUCTION
Currently there is a high demand for internet ser-
vices for both personal and professional reasons. This
growth in demand has also fueled the amount of infor-
mation available to meet the user needs. However, the
scale of available data has prevented the easy access
to the relevant information. To tackle this problem,
Recommender Systems (RSs) have been developed to
personalize the user experience in the demand for rel-
evant information. This allowed the reduction of the
user’s query effort, while enabling the enterprises eas-
ier promotion of their products (Wei et al., 2007).
The success of RS depends on the user experience.
This experience is, among other factors, dependent on
the RS performance (Herlocker et al., 2004). There-
fore, researchers have developed several evaluation
metrics to estimate the RS performance in order to
approximate the user experience. Unfortunately, RSs
are not infallible and it is of importance to continu-
ously evaluate their performance in order to enforce
the quality required (Tintarev and Masthoff, 2011).
The evaluation process of RS is not a simple task,
since there are several problems that must be dealt
with. On one hand, it is essential to choose appro-
priate data sampling strategies, algorithms, metrics
and evaluation procedures to ensure a valid evalua-
tion procedure. On the other, it is also important to
allow a continuous evaluation of the RS performance
to assess if the performance deteriorates across time.
In order to do so, a multi-granularity approach is
proposed to extend the current global evaluation pro-
cedure towards a more fine grained analysis. This
means that instead of solely providing the average
performance results that a recommendation algorithm
obtains on the entire dataset, we split the data into
different layers and report the performance values of
all metrics on said layers. The layers used are: (1)
the dataset, (2) the data batch and (3) the user-item
relationship. The data batch is derived from the data
sampling strategy used to evaluate the RS. Although
in this work the focus lies on the analysis of batches
as each fold of the cross-validation procedure, the ap-
proach is designed to also handle online evaluation
procedures. The idea is to use the incremental data to
train and evaluate the models through a new batch.
Despite the existence of several evaluation plat-
forms for RS, none is found that allows such an
”atomic” analysis of the recommendation problem.
And very few provide an intuitive graphical visualiza-
tion tool to further help the RS practitioner to monitor
its performance. Therefore, this paper also presents
the prototype developed to establish proof of concept.
This paper is organized as follows: Section 2
presents the related work on RS and platforms to
evaluate and monitor their performance. Section 3
presents the multi-granularity approach and the pro-
totype. On Section 4 the entire proposal is discussed
and Section 5 presents the conclusions of the study
and highlights tasks for future work.
Costa, A., Cunha, T. and Soares, C.
AToMRS: A Tool to Monitor Recommender Systems.
DOI: 10.5220/0005992801330140
In Proceedings of the 8th International Joint Conference on Knowledge Discovery, Knowledge Engineering and Knowledge Management (IC3K 2016) - Volume 1: KDIR, pages 133-140
ISBN: 978-989-758-203-5
Copyright
c
2016 by SCITEPRESS – Science and Technology Publications, Lda. All rights reserved
133

2 RELATED WORK
2.1 Recommender Systems
RS emerged with the goal to help users navigate
through high volumes of information, by prepar-
ing personalized recommendations, content and ser-
vices (Adomavicius and Tuzhilin, 2005). RS gather
data regarding the user preferences towards the
items (Bobadilla et al., 2013) and use Machine Learn-
ing methods in order to provide the recommenda-
tions (Bagchi, 2015). In this context, the item can be
anything that the system recommends (for instance,
movies, music, ...) (Tintarev and Masthoff, 2011).
In the recommendation process, it is imperative to
take into account (1) the type of data available, (2)
the suitable recommendation techniques for the col-
lected data, (3) the recommendation algorithms, (4)
the recommendation target and (5) the scope of eval-
uation desired (Bobadilla et al., 2013). In this work
the focus lies on the Collaborative Filtering (CF) rec-
ommendation technique. Thorough surveys are avail-
able for the remaining techniques (Adomavicius and
Tuzhilin, 2005; Bobadilla et al., 2013).
2.1.1 Data
The data used in RS are mostly related to the user, the
item and the relationships between them (Tintarev and
Masthoff, 2011). Although there is a large variety of
data useful for RS, in CF the data is simply a value of
preference that the user assigned the item. This pref-
erence can be explicit (a numerical rating) or implicit
(unary or binary variable that ascertains the interest of
the user on the item) (Tintarev and Masthoff, 2011).
The data structure used in CF is known as the rat-
ing matrix R. It is described as R =U ×I, representing
a set of users U, where u ∈ {1...N} and a set of items
I, where i ∈ {1...M}. Each element of this matrix is
the numerical feedback provided by a user u relative
to an item i, represented by r
ui
.
2.1.2 Strategy
CF methods are organized into memory-based and
model-based. While memory-based methods act only
on the rating matrix using heuristics to obtain the rec-
ommendations, model-based methods induce a model
with the data available to provide the recommenda-
tions (Su and Khoshgoftaar, 2009). Usually, memory-
based methods are based on nearest neighbors and
model-based methods on matrix factorization.
Nearest neighbor strategies have three main steps:
(1) calculate similarity among users/items, (2) finds
the k most similar neighbors and (3) predict the items
to be recommended accordingly to the preference val-
ues of neighbors (Su and Khoshgoftaar, 2009). Sev-
eral similarity metrics can be used in the process.
Some common metrics are Pearson correlation and
Cosine similarity (Sarwar et al., 2001).
Matrix factorization methods approximate the rat-
ing matrix values by the multiplication of at least two
matrices with latent features that capture the under-
lying data patterns (Koren, 2010). The computation
is iterative and optimizes an error metric. There are
several matrix factorization methods (Singular Value
Decomposition, Alternating Least Squares, Stochas-
tic Gradient Descent) (Hu et al., 2008).
2.1.3 Algorithms
There are several recommendation frameworks avail-
able. Due to its extensive amount and diversity of CF
methods, we chose the MyMediaLite (MML) frame-
work (Gantner et al., 2011). The algorithms are or-
ganized into two major CF tasks: Rating Prediction
(RP) and Item Recommendation (IR). Although the
data used is the same, the recommendation process is
different. The discussion of the algorithms falls out-
side the scope of this paper.
Nearest neighbor methods are available to both
RP and IR and are called ItemKNN and UserKNN.
The similarity metrics available are Pearson’s corre-
lation, Cosine similarity, Jaccard coefficient, Condi-
tional probability, Bi-conditional probability and Co-
occurence.
Matrix Factorization methods are divided into RP
and IR. MML presents a total of 7 algorithms for RP
and other 7 for IR. Despite sharing the same nature,
the processes used are different. The discussion of
these methods is not approached in this document, but
they are presented in Table 1.
The baseline algorithms included in MML for RP
are the GlobalAverage, UserAverage, the Item Aver-
age and the UserItemBaseline. For IR, the only base-
line is MostPopular.
2.1.4 Evaluation
As was stated previously, the evaluation process in RS
is crucial and it must happen in several stages of the
system’s life cycle. During its development, the RS
must be validated to ensure that the best recommenda-
tion algorithm was chosen. This is achieved through
offline evaluation procedures, where several algo-
rithms are compared on the same dataset (Tintarev
and Masthoff, 2011). Afterwards, it is also critical to
evaluate the RS performance when it is online. Here,
KDIR 2016 - 8th International Conference on Knowledge Discovery and Information Retrieval
134
Table 1: Matrix Factorization methods in MyMediaLite.
Algorithm Type
Matrix Factorization RP
BiasedMatrixFactorization RP
LatentFeatureLogLinearModel RP
SVDPlusPlus RP
SigmoidItemAsymmetricFactor RP
SigmoidUserAsymmetricFactor RP
SigmoidCombinedAsymmetricFactor RP
BPRMF IR
BPRSLIM IR
LeastSquareSLIM IR
MultiCoreBPRMF IR
SoftMarginRankingMF IR
WeightedBPRMF IR
WRMF IR
real users feedback is used to compute online evalua-
tion metrics. Both evaluation strategies should ideally
be performed, since it does not necessarily mean that
a good offline performance will yield a good online
performance (Tintarev and Masthoff, 2011). How-
ever, this is sometimes unattainable due to the effort
required to collect online user feedback. In this work
the focus lies on offline evaluation, but prepares the
work for online evaluation.
In offline evaluation, the dataset must be parti-
tioned into training and test datasets. This is achieved
by splitting the rating matrix into different sets of
users and use their observations to either train or test
the RS model (Hahsler, 2011). There are several data
partitioning methods available: split, hold-out, leave-
one-out and k-fold cross-validation.
Afterwards, the algorithm is trained on the train-
ing data and its predictions are compared to the hid-
den values from the testing dataset. This comparison
is performed by using several evaluation metrics. The
evaluation metrics available are: (1) predictive preci-
sion, (2) classification precision and (3) ranking pre-
cision (Herlocker et al., 2004).
Predictive precision measures how close is the
prediction to the actual user rating. It is based on
error metrics, such as Mean Average Error (MAE)
and Root Mean Squared Error (RMSE). Classification
precision measures the frequency of correct decisions
made by the RS regarding the item utility. The metrics
are based on standard classification precision metrics
such as precision, recall and accuracy. Ranking preci-
sion metrics are used to measure an algorithm’s abil-
ity to produce an ordered list of items that match the
order the user would have chosen (Herlocker et al.,
2004). The standard metrics for this task are Means
Average Precision (MAP), Normalized Discount Cu-
mulative Gain (NDCG) and Mean Reciprocal Rank
(MRR). Classification precision metrics can also be
adapted to ranking problems by selecting the top N
elements of both the training and testing datasets, in-
stead of the entire set of items available (Herlocker
et al., 2004).
2.2 Recommendation Platforms
From the large amount of recommendation platform,
this work highlights the most popular: Apache Ma-
hout (Owen et al., 2011), LensKit (Ekstrand et al.,
2011) and MyMediaLite (MML) (Gantner et al.,
2011). Despite containing approximately the same
recommendation algorithms, there are differences re-
garding the data partitioning and evaluation proce-
dures.
Apache Mahout contains a large amount of recom-
mendation algorithms and provides distributed pro-
cessing for a few of them. However, the evaluation
procedure is poor: there is no cross-validation proce-
dure and the evaluation metrics are limited to the clas-
sification precision category. Lenskit provides only
basic algorithms and the metrics are based on predic-
tive precision. However, it allows a more suitable
evaluation procedure by providing cross-validation.
Lastly, MML arises as the more complete platform:
it contains the largest amount and variety of recom-
mendation algorithms, several data partitioning tech-
niques (including cross-validation) and provides suit-
able metrics for each CF task: predictive precision
metrics for RP and ranking precision metrics for IR.
A comparison of these platforms regarding these
three platforms is available (Said and Bellog
´
ın, 2014).
The study concludes that despite providing the most
computational resource consuming algorithms, MML
provides a superior performance. Further information
regarding the comparison of these platforms is pre-
sented in Table 2.
Table 2: Comparison of recommendation frameworks.
Mahout MML LensKit
Release date 04/2007 10/2010 03/2011
Last update 05/2015 12/2015 11/2015
Last version 0.10.1 3.11 2.2.1
Language Java C# Java
Platform JVM .NET JVM
Algorithms Classical SotA Classical
Distributed Partial No No
2.3 Monitoring Platforms
Despite the existence of several evaluation platforms
with integrated evaluation procedures, there are few
monitoring platforms for RS.
AToMRS: A Tool to Monitor Recommender Systems
135
A widely used tool to store, distribute and ana-
lyze Data Mining experimental data is OpenML (Van-
schoren et al., 2014). The repository is important
mainly for offline evaluation procedures, since sev-
eral researchers can provide their experimental data
for the same problem and compare the results with
others. There are also several visualization mecha-
nisms to perform an analysis of the gathered exper-
imental data and it allows an open and collaborative
discussion of the results obtained. However, this work
is not specifically focused on RS and it is not prepared
for a proper online monitoring of the recommendation
process.
One tool available in the literature regarding RS
monitoring for music recommendation (F
´
elix et al.,
2014). The RS provides recommendations for the
users, who are responsible to either blacklist them or
to add the musics to the library. Based on this feed-
back, the system performs online evaluation proce-
dures. The system monitors the positive and nega-
tive feedback provided and analyses it through several
facets: date, time of day, user gender and geographi-
cal distribution. These results are provided via visual-
ization mechanisms to better understand the previous
facets. The mechanisms allow the RS practitioner to
adjust the RS in order to maximize the effectiveness
of the recommendation process. The main difference
to the work proposed in this paper is the level of anal-
ysis that the system allows. The multi-granularity ap-
proach proposed will allow a deeper analysis of the
recommendation problem.
A platform for Website automation and monitor-
ing is also available (Domingues et al., 2008). The
platform aims to generically maintain Web pages via
Web adapters. The case study presented uses one of
these adapters as a RS and its performance is mon-
itored continuously. The developed monitoring tool,
EdMate, takes advantage of online evaluation metrics
and displays the information via numerical and graph-
ical mechanisms. The tool reports statistics regard-
ing the website usage, the recommendation adhesion
from the users, the recommendation efficacy and the
time spent by the users on specific pages. Despite pro-
viding an extensive overview of the recommendation
process, this tool focus on analyzing several indica-
tors. The proposed approach in this paper, focuses
instead on providing a deeper analysis to the standard
evaluation procedure.
3 AToMRS
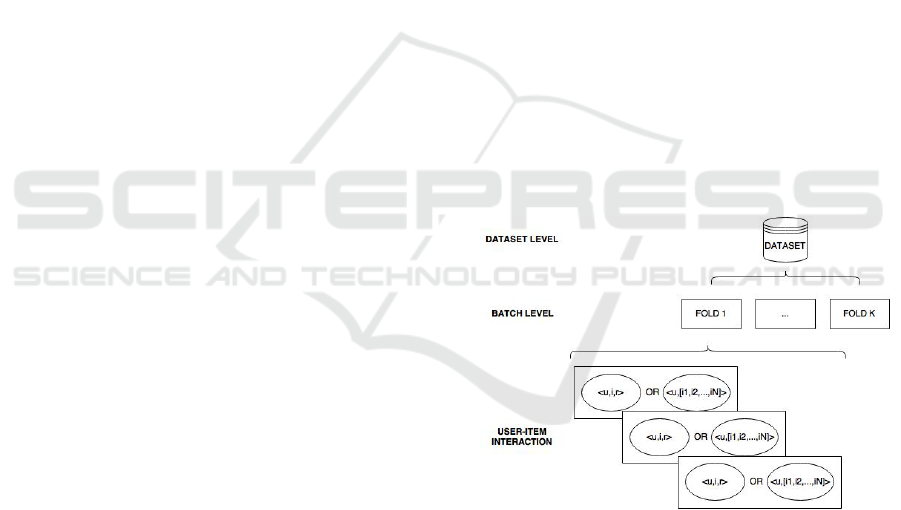
3.1 Multi-granularity Approach
The approach used in this work to enable a deeper
analysis of the RS evaluation procedure has its foun-
dation in Machine Learning data splitting strategies
used to train and test models. Figure 1 presents the
several levels that can be analyzed.
The process starts in the dataset level, with all the
available instances. Then, data is split to create the
training and testing datasets. The data splitting strat-
egy creates data batches, which can be used to an-
alyze different sub-problems of the original recom-
mendation problem. In the approach designed here,
the batches are folds in the cross-validation. Lastly,
the user-item < u, i > interaction level presents a sin-
gle instance of the original dataset. These are fun-
damentally different for the specific CF strategy: in
RP, the association is defined by a triplet user, item
and rating value (i.e., < u, i, r >), while in IR a list
l = [i
1
, i
2
, ..., i
N
] of ordered items is assigned to each
user (i.e., < u, l >).
All these different facets of the original dataset
provide the different levels of analysis of the evalu-
ation procedure: the entire dataset, the data batch and
the user-item interaction.
Figure 1: Different levels of the multi-granularity approach.
Despite modeling the data batch as a fold of the of-
fline cross-validation procedure, it is straightforward
to adapt the concept to online evaluation: the data
batches can be defined by incremental data. Each new
incremental dataset is considered a new batch to the
problem. Here, the focus is to understand how new
data changes the RS performance in several levels of
analysis, instead of analyzing the different sub-dataset
used to train and validate the model. However, both
tasks are of the utmost importance and the approach
developed enables both seamlessly.
KDIR 2016 - 8th International Conference on Knowledge Discovery and Information Retrieval
136
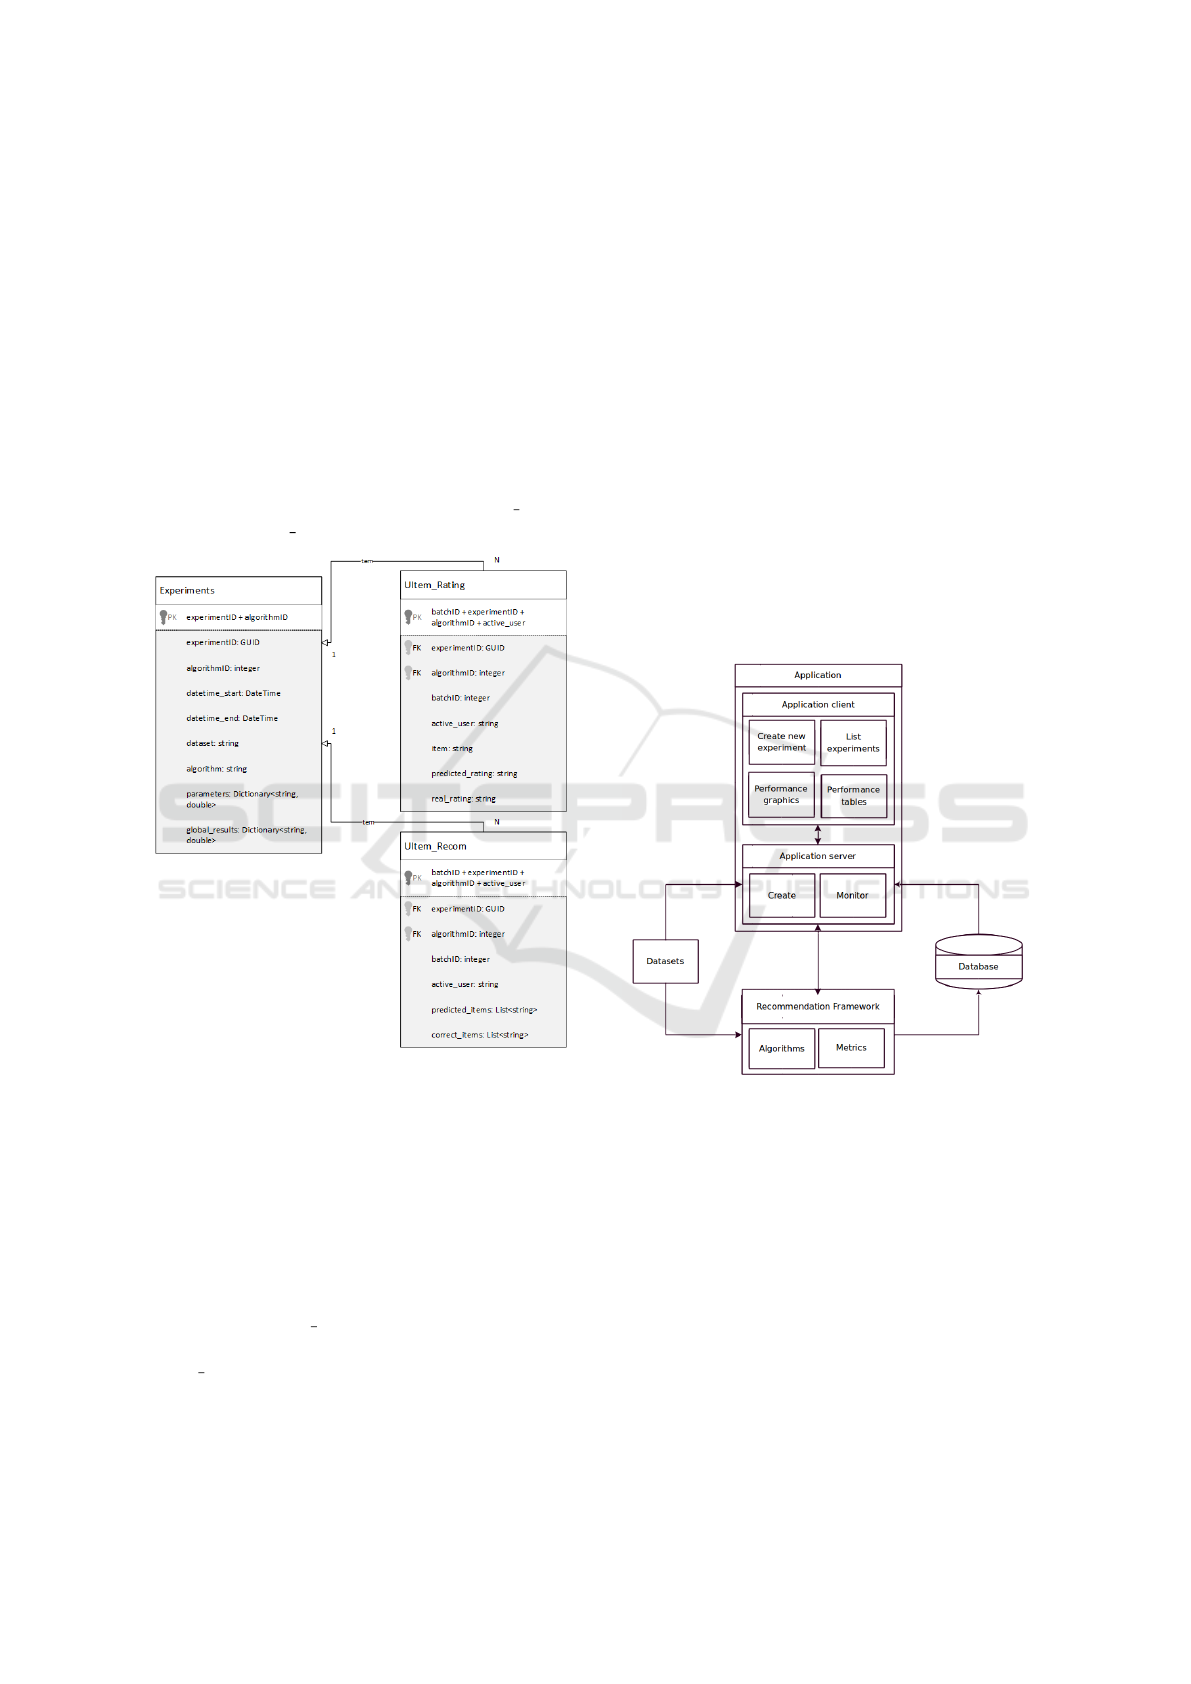
3.2 Data Model
Since the multi-granularity approach developed is
based simply on data splitting techniques, the imple-
mentation of said approach is simply focused on the
design of a suitable database structure. The developed
database structure is presented in Figure 2. Please
note that the schema follows the NoSQL methodol-
ogy provided by Apache Cassandra.
For the CF problem, 3 tables were required due
to the differences in RP and IR tasks. One main ta-
ble Experiments describes the general information re-
garding the CF experiments and two tables refer to the
detailed data for the RP and IR tasks (UItem Rating
for RP and UItem Recom for IR).
Figure 2: Data model for multi-granularity approach.
The Experiments table stores the global perfor-
mance results, the start and end dates, the dataset, the
algorithm and its parameters. In this table, the experi-
ment and algorithm identifier code are used as the pri-
mary key. The remaining tables, which are related to
the Experiments table, define the batch and the active
user identifier codes.
However, due to the data structures used in
each CF task, there are differences in the remaining
fields. While UItem Rating contains the item identi-
fier code and both the real and predicted ratings, in
UItem Recom the data stored are simply two lists: the
original and predicted item preference lists.
Data is stored in such way to enable to access
each level of the multi-granularity approach. This
means that if the target are the user-item interactions,
then these can be directly loaded from the database.
If, for instance, the goal is to analyze a batch, then
data is queried by a specific batch and joined to pro-
duce the final results. Lastly, to analyze all instances
of a dataset, the query retrieves all instances of that
dataset.
This allows to apply the evaluation metrics dy-
namically to each set of instances upon request on the
prototype. The evaluation metrics implementation are
common for both the experimental work and for the
prototype visualization mechanisms.
3.3 Prototype
The prototype was developed as proof of concept for
the multi-granularity approach proposed. It has two
main modules: the recommendation framework and
the application. The architecture diagram is presented
in Figure 3.
Figure 3: System architecture.
The recommendation framework provides an in-
terface to MML and allows to create the CF exper-
iments. This interface was created by manipulation
of the original MML source code. To create an ex-
periment there are a few items to be addressed: the
dataset, the algorithms and the respective parameters.
At this point, only the cross-validation is enabled, but
future work will include other validation strategies.
The evaluation procedure is performed using in-
ternal MML data structures and methods. The results
from the experimental work are continuously being
stored in the database. These can be queried in the
future by the application to enable the analysis of re-
sults.
AToMRS: A Tool to Monitor Recommender Systems
137

The application provides a dashboard and several
visualization mechanisms that provide access to the
several levels of the multi-granularity approach. The
dashboard presents management options for experi-
ments (list, create and show). When a specific exper-
iment is selected, then all the dataset level metrics are
provided. By selecting a different metric, the results
are updated accordingly. Figure 4 presents this inter-
face.
Figure 4: Prototype dashboard.
The dataset level performance is displayed via a
bar graphic. The values are shown for a specific
metric and it allows to compare the average perfor-
mance of all algorithms used in the experiment. Fig-
ure 5 presents the respective visualization mecha-
nism. Here, the horizontal axis present the several al-
gorithms evaluated on a specific dataset and the verti-
cal axis the corresponding performance metric value.
It is also possible to analyze the results on a batch
level. One must select which algorithm is the target
for evaluation, and a list of all the batches perfor-
mance for the specific algorithm are provided. Here,
each bar in the graph represents a batch and the ver-
tical axis presents the respective performance metric
value. This allows to understand how the performance
varies depending on the batch. This representation is
also useful for the online evaluation paradigm. Fig-
ure 6 presents this visualization mechanism.
On the atomic level, i.e. the user-item interaction,
the visualization mechanism is different: instead of
using a bar graphic, the performance values are pre-
sented via a point dispersion graph with 3 axis (x,y,z)
representing user, item and performance value. In
this representation, if the values are superior to a pre-
specified threshold, a different color is assigned to
better distinguish the good from the bad results. Fig-
ure 7 displays this visualization mechanism.
4 DISCUSSION
The presented approach provides a deeper analysis of
the CF evaluation procedure, when compared to other
monitoring platforms. Furthermore, the work focuses
on a new perspective of data analysis, forgotten so far
by related works in RS. This section discusses several
aspects of both the multi-granularity approach and the
prototype.
In terms of the proposed approach to analyze the
recommendation problem on several levels, there are
two main points to discuss: the data batch structure
and the database usage.
While the data batch structure served its purpose
and enabled all the work developed, it has low sci-
entific value. Its merits lie on a more practical per-
spective. However, it is important to notice that this
structure can be re-used (and even improved) for other
Data Mining tasks that require low level analysis.
Secondly, the proposed method requires high
computational storage resources, especially if the
dataset scales dramatically. Also, in terms of com-
putational time, the approach introduces a significant
overhead. This overhead is well worth if the dataset
used is small, because of the deeper analysis power
enabled. But it may become overwhelming and im-
practicable if the data scale increases beyond reason-
able values.
Regarding the prototype, the discussion points
highlighted are the visualization mechanisms and the
adaptation towards online evaluation.
The visualization mechanisms use mostly the bar
graphics to represent the performance values. The au-
thors believe that visualization mechanisms are suit-
able for the task at hand. On one hand, they present
an intuitive way to evaluate the performance results
and, on the other, it fits directly to any level described
by the data model. Therefore, by reusing the same vi-
sualization mechanism, it promotes stability and does
not introduce a learning curve for the user. However,
this is a debatable position: it is possible that many
other visualizations with added value can also be in-
cluded. But the trade-off between usability and ease
of analysis needs to be taken into account.
The online evaluation adaptation, although taken
into consideration when designing the solution, is not
implemented yet. This requires a functional RS that
can receive feedback from real users. However, it is
the authors belief that on a practical perspective, the
problem can be modeled in a similar fashion. If so,
then the same solution developed can be directly ap-
plied.
5 CONCLUSIONS
This work proposed a multi-granularity approach to
allow a deeper analysis of a RS performance. This
approach allows to analyze the recommendation prob-
lem in 3 levels: the dataset, the batch and the user-
item interaction. This was achieved via a database
KDIR 2016 - 8th International Conference on Knowledge Discovery and Information Retrieval
138
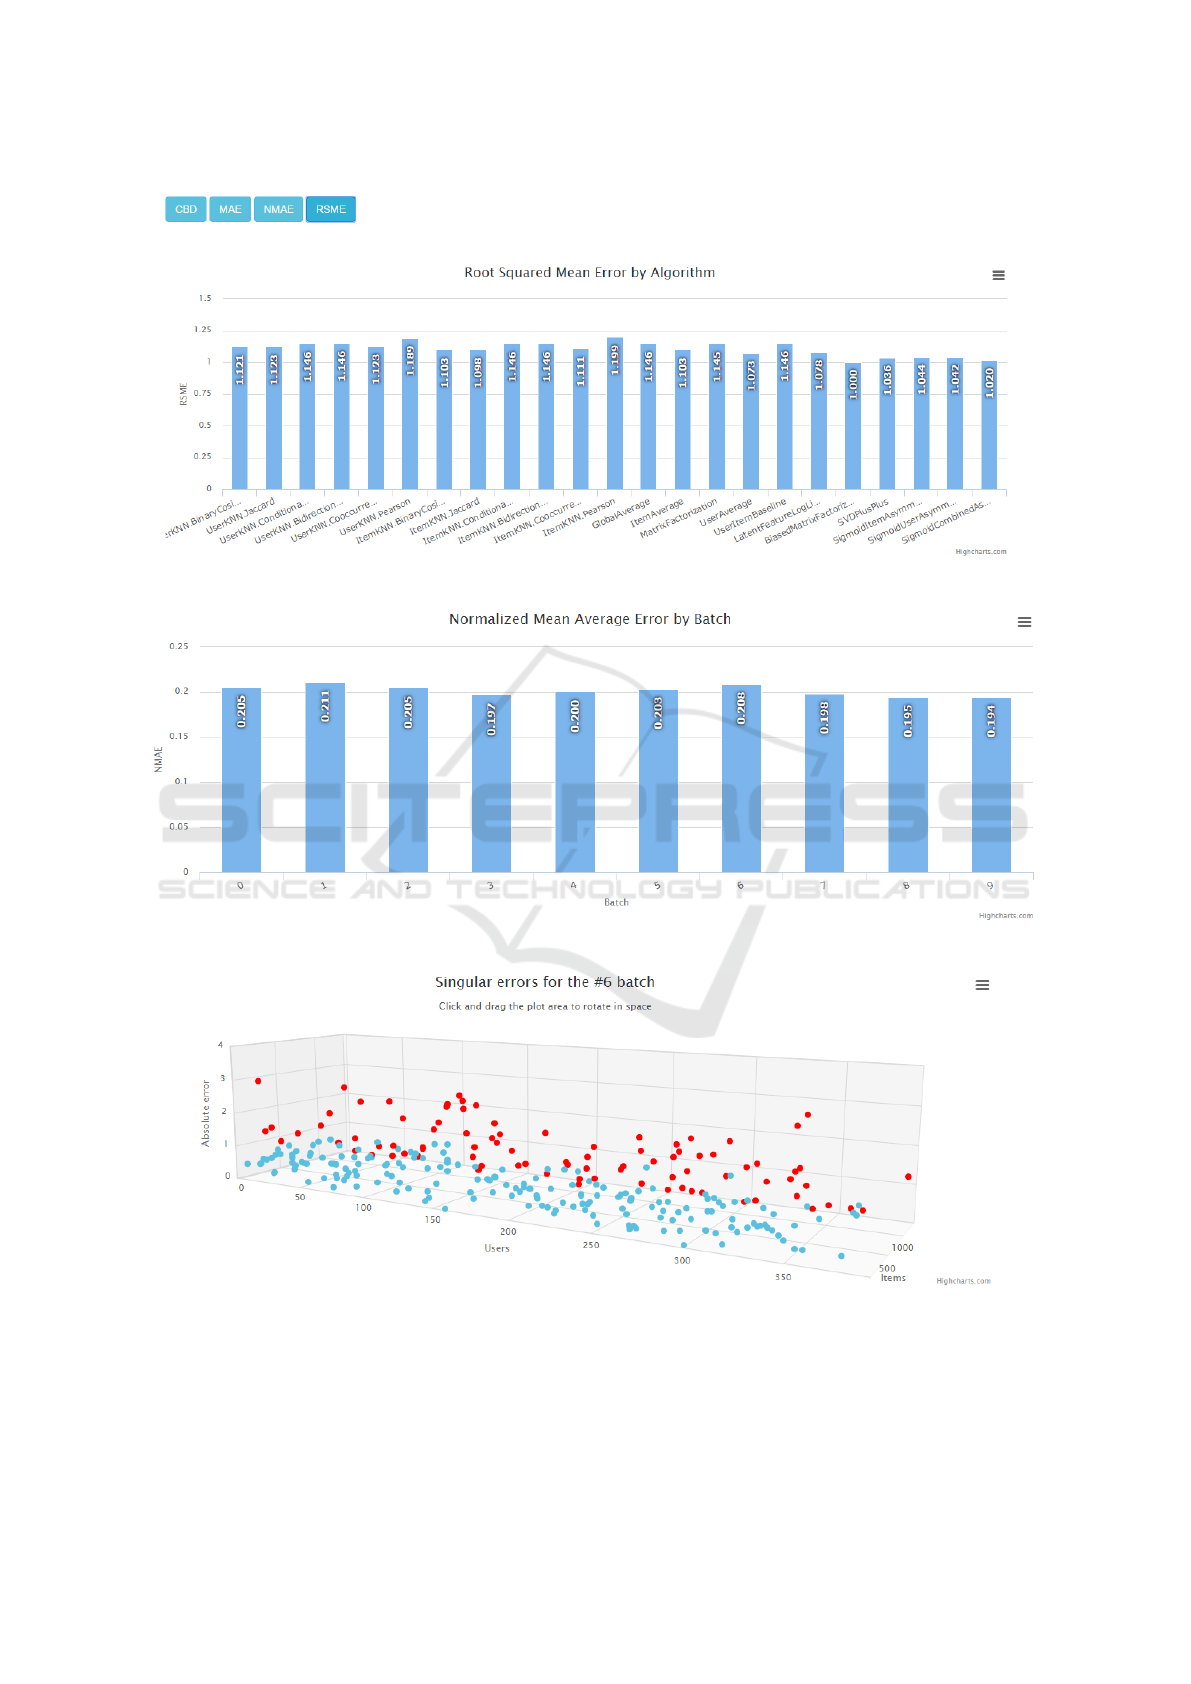
Figure 5: Global performance values on dataset level.
Figure 6: Batch level performance values across batches.
Figure 7: User-item level performance values for a specific batch.
model that enables the storage and access of this hier-
archical data. In this work’s case study, the approach
was applied to offline evaluation, although it was de-
signed to also handle the online evaluation procedure.
A prototype was also developed to demonstrate
the applicability of the approach designed. The pro-
totype is responsible for experiment management op-
erations of the recommendation framework MyMedi-
AToMRS: A Tool to Monitor Recommender Systems
139

aLite. It also displays the performance results of
the multi-granularity approach using several mecha-
nisms.
Tasks for future work include an optimization of
the experiment management options (include setting
algorithm’s parameters, perform grid search, schedule
experiments), extend the work on visualization mech-
anisms (study other appropriate visualization rep-
resentations for the developed multi-granularity ap-
proach) and create a case study for online evaluation
to validate the assumptions stated in this work.
ACKNOWLEDGEMENTS
This work is financed by the ERDF Fund through
the Operational Programme for Competitiveness and
Internationalization - COMPETE 2020 of Portugal
2020 through the National Innovation Agency (ANI)
as part of the project 3506 and also through project
POCI-01-0145-FEDER-006961 via National Funds
through the FCT – Fundac¸
˜
ao para a Ci
ˆ
encia e a Tec-
nologia as part of project UID/EEA/50014/2013. The
research was also funded from the ECSEL Joint Un-
dertaking, the framework programme for research
and innovation horizon 2020 (2014-2020) under grant
agreement 662189-MANTIS-2014-1.
REFERENCES
Adomavicius, G. and Tuzhilin, A. (2005). Toward the
next generation of recommender systems: A survey
of the state-of-the-art and possible extensions. IEEE
Transactions on Knowledge and Data Engineering,
17(6):734–749.
Bagchi, S. (2015). Performance and Quality Assessment of
Similarity Measures in Collaborative Filtering Using
Mahout. Procedia Computer Science, 50:229–234.
Bobadilla, J., Ortega, F., Hernando, a., and Guti
´
errez, a.
(2013). Recommender systems survey. Knowledge-
Based Systems, 46:109–132.
Domingues, M. A., Leal, J. P., Jorge, A. M., Soares, C., and
Machado, P. (2008). A platform to support web site
adaptation & monitoring of its effects: a case study.
Proceedings of the 6th Workshop on intelligent tech-
niques for web personalization & recommender sys-
tems (ITWP 08), (Mdc):29–36.
Ekstrand, M., Ludwig, M., Konstan, J., and Riedl, J. (2011).
Rethinking the Recommender Research Ecosystem:
Reproducibility, Openness, and LensKit. In ACM
Conference on Recommender Systems, pages 133–
140.
F
´
elix, C., Soares, C., Jorge, A., and Vinagre, J. (2014).
Monitoring Recommender Systems: A Business In-
telligence Approach. Computational Science and Its
Applications–ICCSA 2014, pages 277–288.
Gantner, Z., Rendle, S., Freudenthaler, C., and Schmidt-
Thieme, L. (2011). MyMediaLite: A Free Recom-
mender System Library. In ACM Conference on Rec-
ommender Systems, pages 305–308.
Hahsler, M. (2011). recommenderlab: A Framework
for Developing and Testing Recommendation Algo-
rithms. Nov, pages 1–37.
Herlocker, J. L., Konstan, J. a., Terveen, L. G., and Riedl,
J. T. (2004). Evaluating collaborative filtering recom-
mender systems. ACM Transactions on Information
Systems, 22(1):5–53.
Hu, Y., Koren, Y., and Volinsky, C. (2008). Collaborative
Filtering for Implicit Feedback Datasets. In IEEE In-
ternational Conference on Data Mining, pages 263 –
272.
Koren, Y. (2010). Factor in the Neighbors: Scalable and
Accurate Collaborative Filtering. ACM Transactions
on Knowledge Discovery from Data, 4(1):1–24.
Owen, S., Anil, R., Dunning, T., and Friedman, E. (2011).
Mahout in Action. Manning Publications Co., Green-
wich, CT, USA.
Said, A. and Bellog
´
ın, A. (2014). RiVal – A Toolkit to Fos-
ter Reproducibility in Recommender System Evalua-
tion. ACM Conference on Recommender Systems.
Sarwar, B., Karypis, G., Konstan, J., and Riedl, J. (2001).
Item-Based Collaborative Filtering Recommendation
Algorithms. In International Conference on World
Wide Web, pages 285–295.
Su, X. and Khoshgoftaar, T. M. (2009). A Survey of Col-
laborative Filtering Techniques. Advances in Artificial
Intelligence, 2009:1–19.
Tintarev, N. and Masthoff, J. (2011). Recommender Systems
Handbook, volume 54.
Vanschoren, J., van Rijn, J. N., Bischl, B., and Torgo,
L. (2014). OpenML: networked science in machine
learning. ACM SIGKDD Explorations Newsletter,
15(2):49–60.
Wei, K., Huang, J., and Fu, S. (2007). A survey of e-
commerce recommender systems. In International
Conference on Service Systems and Service Manage-
ment, pages 734–738.
KDIR 2016 - 8th International Conference on Knowledge Discovery and Information Retrieval
140
