
Dynamic and Acoustic Properties of a Joisted Floor
Edoardo Alessio Piana, Candida Petrogalli and Luigi Solazzi
Department of Mechanical and Industrial Engineering, University of Brescia, via Branze 38, Brescia, Italy
Keywords: Point Mobility, Bending Stiffness, Sound Reduction Index.
Abstract: Lightweight structures find more and more applications in both vehicle and ship industries. To meet a growing
demand, a variety of different types of joisted panels have been developed during the last few decades. One
of the problems to deal with is the assessment of the acoustic performances of such panels once they are
already mounted in their final place. In this case, it can be of importance to find a way to characterise their
dynamic and acoustic properties, such as bending stiffness, internal losses and sound reduction index through
non-destructive testing. A method for a quick determination of the bending stiffness of a lightweight joisted
floor is presented. On the basis of the apparent bending stiffness and of the losses, it is possible to predict the
sound reduction index of the panel in a fairly simple way. The results obtained from the mobility tests have
been compared to the measurements carried out according to the ISO standard procedure.
1 INTRODUCTION
The expression “joisted floor” refers to a structure
with a multi-layer plate bonded to joists placed at one
side of the floor. This type of floor combines low
weight with high strength. However the acoustic
properties can be very poor, thus severely restricting
the use of such lightweight elements. It is therefore
essential to optimize the acoustic performances
through predictions. In case of sandwich-like
structures, some of the basic dynamic and acoustic
parameters can be determined by means of simple
tests using a beam element cut from the assembly
(Nilsson and Nilsson, 2002) and (Nilsson and Liu,
2016). Some frequency response measurements can
determine a number of natural frequencies of the
beam. Based on these results the apparent bending
stiffness can easily be determined through least
square method applied to the experimental points.
The apparent bending stiffness of a composite
structure at one natural frequency is equal to the
bending stiffness of a simple Euler beam having the
same length, boundary conditions and weight as the
considered sandwich structure at the same frequency.
Obviously, it is not always possible to cut beams from
an already mounted structure. (Roelens et al., 1997)
and (Nightingale et al., 2004) have tested different
measurement techniques on building components for
the determination of their stiffness properties in situ.
Although these methods seem to be quite complicated
and a number of them cannot be adopted for some
types of building components.
In the following sections, a method is presented
through which the material parameters can be
determined from simple point mobility measurements
on a plate element. In particular, this method has been
applied to a kind of panel which cannot be strictly
defined as sandwich, since it is made up of several
layers and some thick joists attached to one side of the
assembly. It will be shown that the point mobility
technique allows to estimate the apparent bending
stiffness also in this case, thus taking into account the
real boundary conditions of the mounted structure.
The sound reduction index results obtained from
point mobility measurements will be compared to
those found after the tests carried out according to the
existing ISO standards.
2 BENDING STIFFNESS
DERIVED FROM POINT
MOBILITY MEASUREMENTS
If an harmonic force F = F
0
exp(iωt) is injected at a
specific point of a system, it will move with a certain
velocity v. In the point where the excitation is given,
a point mobility function Y can be defined as the ratio
between the Fourier transform of the velocity signal
and the Fourier transform of the force signal
measured at the same position:
Piana, E., Petrogalli, C. and Solazzi, L.
Dynamic and Acoustic Properties of a Joisted Floor.
DOI: 10.5220/0005994202770282
In Proceedings of the 6th International Conference on Simulation and Modeling Methodologies, Technologies and Applications (SIMULTECH 2016), pages 277-282
ISBN: 978-989-758-199-1
Copyright
c
2016 by SCITEPRESS – Science and Technology Publications, Lda. All rights reserved
277

FvY
ˆ
/
ˆ
(1)
The behaviour of a finite vibrating structure can be
predicted from that of infinite ones. The bending
waves induced by a point force in an infinite plate can
spread indefinitely in any direction. If a finite plate is
considered, the bending waves reach the borders of
the plate, and then are reflected back. If a force is
acting at a specific point of the plate, the resulting
velocity will be mainly determined by the plate
dimensions, mass per unit area, bending stiffness and
boundary conditions, thus the point mobility will
depend on position and frequency. However, an
averaging of the real part of the point mobility carried
out over space and frequency for a finite structure is
in the mid- and high-frequency region identical to the
real part of the point mobility of an infinite structure
made of the same material and having the same
thickness:
YY ReRe
(2)
Consequently, the power input, introduced into a
panel having finite dimensions by a force acting
randomly in time and space, can be determined as if
the panel had infinite dimensions and were excited by
a point force having a power spectral density
equivalent to the sum of the power spectral densities
of all the point sources operating on the finite
structure. This statement is valid because in the mid-
high frequency range the modal density is significant,
thus making the mobility independent of the structure
extension. This means that the theory cannot be
applied without taking into account corrections for
the first few modes in the low frequency range. It has
been be shown (Fahy and Mohammed, 1992) that, in
order to extend this consideration to the low
frequency range, at least 5 modes have to be included
within each frequency band of interest to have a fair
accuracy. As concerns the space average, the mobility
has to be measured over a large number of points, and
the points have to be randomly distributed over the
panel surface, in order to obtain a good representation
of the dynamic properties of the panel. If these
conditions are fulfilled, the mobility of a finite panel
can be determined using the formulation of the
mobility for an equivalent infinite structure (Nilsson
and Liu, 2016). In this case, the frequency average of
the mobility can be written as:
''8
1
Re
p
D
Y
(3)
where D
p
and μ'' are the bending stiffness per unit
width and the mass per unit area of the panel,
respectively. The bending stiffness per unit width of
the panel at the central frequency of each frequency
band is obtained as:
2
Re''64
1
Y
D
p
(4)
For modes (m,n) having m = 0 or n = 0, it can be
shown that (Nilsson and Liu, 2016):
''4
1
Re
p
D
Y
(5)
Therefore, for the first natural frequencies
corresponding to such mode types, the measured
bending stiffness should be multiplied by a factor 4.
The influence of the mass of the accelerometer
used during the mobility measurements has to be
taken into account, especially for lightweight
structures. As discussed in (Nilsson and Liu, 2016),
the dynamic response of the structure and its modal
behaviour, can be influenced by the added mass of the
transducer Δμ. The measured point mobility should
then be modified according to the correlation:
iYYY
measured
1/
(6)
In the low frequency region the effect of the mass Δμ
is negligible. For higher frequencies, the denominator
increases and the magnitude of the measured point
mobility can decrease significantly.
This aspect must be taken into account in case of
lightweight structures when the mobility is measured
by using an impact hammer and an accelerometer,
while an impedance head is less sensitive.
2.1 Sound Reduction Index
The response of a structure excited by an external
sound field can be predicted fairly accurately once the
apparent bending stiffness of the structure is known
(Backström and Nilsson, 2007).
The derivation of the sound reduction index for
homogeneous panels as a function of the bending
stiffness of the plate and other parameters is discussed
in (Cremer, 1942). The expressions can be used for
sandwich structures once some adjustments are made.
For this reason it is useful to introduce the critical
frequency f
c
. This particular parameter is the
frequency for which the wavenumber in air is equal
to the wavenumber of the flexural waves on the plate.
The frequency f
c
is given by
μ"/Dπ/c =/kkπc/f
pairplatec
22
22
(7)
SIMULTECH 2016 - 6th International Conference on Simulation and Modeling Methodologies, Technologies and Applications
278
where c is the speed of sound in air. For a thin
homogeneous panel, the bending stiffness D
p
is not
frequency dependent and f
c
is a constant.
The transmission coefficient τ(φ) at the angle of
incidence φ is given by
1
2
4
2
2
4
2
1sincos
2
sincos
2
1
c
c
f
f
c
f
f
c
(8)
where ρc is the impedance of air, equal to
415 kg/(m
2
s) and f
c
is the critical frequency satisfying
equation 7. As previously stated, for a single leaf
panel D
p
is constant. However, for a multylayered
structure the bending stiffness is frequency
dependent. The sound reduction index of a sandwich
structure can be derived by replacing f
c
in equation 8
with a the parameter f'
c
:
fD
c
f
p
c
2
(9)
The sound reduction index R is defined as
10∙log(1/τ
d
), where τ
d
is the sound transmission
coefficient for diffuse incidence:
d
d
sincos2
2/
0
(10)
The sound reduction index for the plates described
hereafter was predicted according to equations 8-10
and compared to measurements carried out according
to the procedures described in the international
standards.
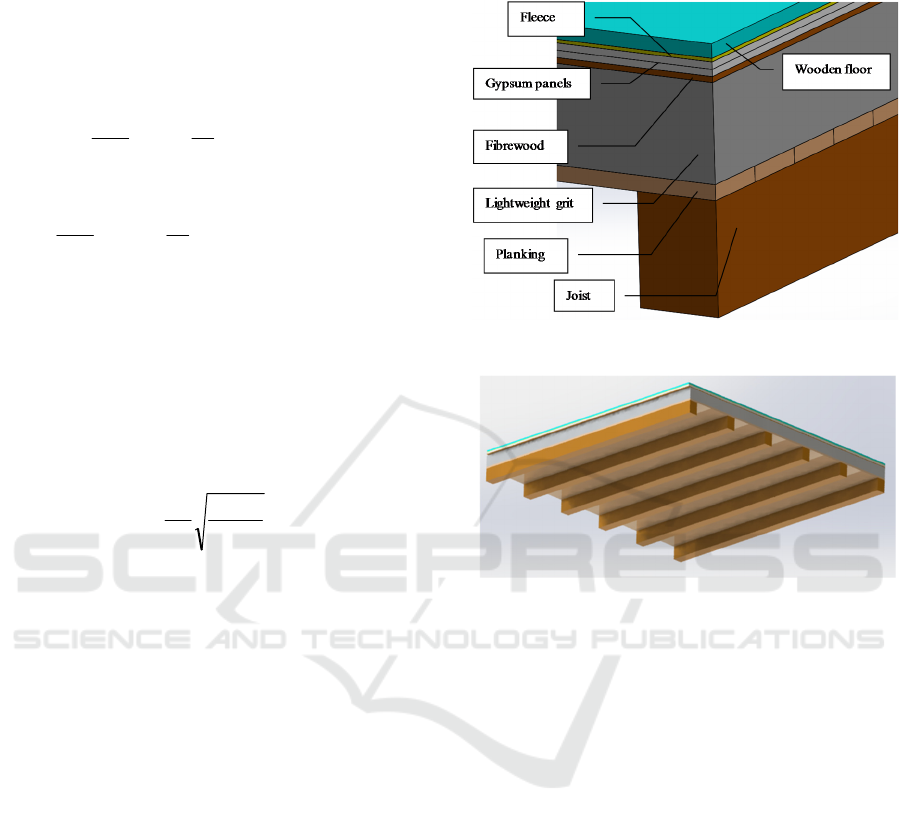
2.2 Specimen under Test
The investigated specimen is made of two main parts:
a floor, made of different layers, and the joists (Figure
1).
Starting from the upper layer, the thicknesses are:
20 mm, 5 mm, 2 x 10mm, 8 mm, 140 mm, 22 mm.
The joists are 120 mm x 160 mm wooden studs. The
overall thickness of the floor is 215 mm.
The dimensions of the surface are
3.31 m x 3.38 m. Figure 2 shows a layout of the floor,
together with the spacing between the ribs. The lower
wooden layer and the studs are kept together by a thin
layer of glue.
The overall mass per unit area of the floor is
85.08 kg/m
2
.
Figure 1: Layers of the joisted floor.
Figure 2: Layout of the ribs and main dimensions of the
panel.
3 TEST METHODS AND
MATERIALS
The floor is mounted between the ground floor and
the second floor of a small building (Figure 3).
The lateral sides of the floor are sealed by placing
a resilient mat plus high density foam to fill all the
gaps between the wooden frame and the wall.
On the joisted side, 20 point mobility
measurement positions were spread on the surface: 10
positions on the joists and 10 positions in between
them.
A PCB Piezotronics accelerometer type 352C33 was
attached to the floor and then the floor was his as
close as possible to it by means of an impedance
hammer PCB Piezotronics type 086C03, equipped
with a nylon tip. The velocity and force signals
coming from the transducers were acquired by an
OROS 36 multi-channel system able to compute
directly the real and imaginary parts of the mobility
Dynamic and Acoustic Properties of a Joisted Floor
279

function. The frequency span of the acquisition was
selected from 0 to 6.4 kHz, 1 Hz resolution.
Figure 3: Pictures of the floor used for the tests and of the
building where it is mounted.
3.1 Point Mobility Measurements
The point mobility measurements were performed
directly in situ.
Figure 4: Measurement positions for point mobility.
Figure 4 shows how the measurement positions
are distributed across the panel surface.
The post processing of the data was carried out by
exporting the text data from the OROS NVGate
software. Importing the real part of the mobility in an
ad-hoc software, it was possible to compute the
average mobility for the 20 measurement positions.
Finally, the mobility value was computed
synthesising the values into 1/3 octave bands,
extended to have at least 5 modes inside the frequency
span defined by each band. Once the average mobility
is known, it is possible to compute the related bending
stiffness and to use this value to determine the
apparent bending stiffness through the least square
method applied to a set of points f
n
, D
n
and to the
following equation
0
2/12/3
CDD
f
B
D
f
A
xxx
(11)
which describes the general behaviour of the apparent
bending stiffness D
x
for a sandwich panel (Nilsson
and Nilsson, 2002). As shown in (Piana, 2016), the
general form of equation 11 can be used to describe
the bending stiffness of different types of orthotropic
panels, including ribbed structures.
Since the modal density in the low frequency
range is low, there is some lack of points for
computing the bending stiffness. For this reason a
fictitious bending stiffness point D
0
has been
introduced in order to “guide” the curve in the very
low frequency region. The static bending stiffness D
0
can be computed once some geometrical and material
parameters are known using the following equation:
2
2
0
lcl
hhE
D
(12)
where E
l
is the Young’s modulus for one laminate, h
c
is the core thickness and h
l
is the thickness of one
laminate.
4 RESULTS
4.1 Determination of the Loss Factor
Before starting with the computation of the sound
reduction index of the panels, it is necessary to
determine the losses. The determination of the losses
was made through the evaluation of the structural
reverberation time.
Each of the impulse responses recorded in the
positions used for the measurement of the mobility
was post processed to determine the decay in each
octave band of interest. Then it was possible to
compute the losses through the formula:
r
Tf
0
2.2
(13)
where f
0
is the central frequency of the octave band of
interest in hertz, and T
r
is the measured structural
SIMULTECH 2016 - 6th International Conference on Simulation and Modeling Methodologies, Technologies and Applications
280

reverberation time in seconds for each frequency
band. The decay for the different frequency bands
was obtained by post processing the impulse response
signals using Adobe Audition and the Aurora plugin.
The resulting decays, computed for the frequency
bands of interest, were further post processed in order
to obtain the losses as a function of frequency (Figure
5).
Figure 5: Measured losses of the joisted floor.
4.2 Sound Reduction Index from
Mobility Measurements
Once the losses have been determined and the
apparent bending stiffness has been derived from the
mobility measurements, it is possible to compute the
sound reduction index of the panel. The computation
is carried out according to the theory described in the
previous sections, and in particular by using equation
4.
Starting from the dimensions of the panel, its mass
for unit area and the mobility measurements, the
bending stiffness is computed in the frequency range
1 Hz – 6400 Hz. Figure 6 shows the bending stiffness
points, derived from the point mobility
measurements, and the apparent bending stiffness
function, obtained by fitting equation 11 to the
experimental data.
Figure 6: Measured bending stiffness (points) and apparent
bending stiffness (solid line).
Once the bending stiffness is computed, the
critical frequency f
c
can be easily determined and the
sound reduction index can be computed.
4.3 Measurement of the Sound
Reduction Index to ISO 10140-2
After performing the mobility measurements, the
joisted floor was tested according to the procedure
described in ISO 10140-2 standard in order to
determine its sound reduction index of the structure.
Two source positions were used so to have a good
average of the sound field and ten sound pressure
level measurements were performed for both the
source and the receiving rooms. The difference
between the average sound pressure level of the
source room (L
SR
) and the average sound pressure
level of the receiving room (L
RR
) was weighted for the
size of the partition S and the sound absorption area
of the receiving room A
RR
to compute the sound
reduction index according to the following formula:
RR
RRSR
A
S
LLR log10
(15)
Figure 7 shows the comparison between the sound
reduction index measured using the procedure given
by the standard and the reduction index resulting from
the mobility measurements, which displays a fairly
good agreement. The dotted line represents the sound
reduction index computed according to the mass law
for a floor having the same mass per unit area of the
one used for the experimental tests. It can be noted
that the mass law brings to a sound reduction index
which is at least 10 dB higher than the real one for
each frequency band of interest.
Figure 7: Measured (solid) vs predicted (dashed) sound
reduction index.
0
2
4
6
8
10
12
14
16
18
20
63 125 250 500 1000 2000 4000 6000
Losses [%]
Frequency [Hz]
0
50000
100000
150000
200000
250000
300000
1 10 100 1000 10000
Bending stiffness [N m]
Frequency [Hz]
20
25
30
35
40
45
50
55
60
65
70
Sound Reduction Index [dB]
Frequency [Hz]
Dynamic and Acoustic Properties of a Joisted Floor
281

5 CONCLUSIONS
A simple technique for the prediction of the sound
reduction index of lightweight joisted floors has been
proposed and tested. The technique has already been
adopted for predicting the dynamic and acoustic
properties of sandwich and honeycomb panels, but
seldom on lightweight, strongly orthotropic
structures. The method is based on in-situ point
mobility measurements performed on a sufficiently
high number of experimental points randomly
distributed over the specimen surface, which, once
space- and frequency-averaged, allow to compute the
apparent frequency-dependent bending stiffness of
the structure. This technique is easier to implement if
compared to other methods found in the literature,
and it allows to better take into account the
anisotropic behaviour of the specimens. The
predicted sound reduction index has been compared
to measurements performed according to the relevant
international standard, showing encouraging results.
Further experimental tests will allow to validate the
applicability of the method to other types of
structures, such as double-wall panels.
REFERENCES
Backström, D. & Nilsson, A.C., 2007. Modelling the
vibration of sandwich beams using frequency-
dependent parameters. Journal of Sound and Vibration,
300(3-5), pp.589-611.
Cremer, L., 1942. Theorie der Schalldämmung dünner
Wände bei schrägem Einfall. Akustische Zeitschrift,
7(3), pp.81-104.
Fahy, F. & Mohammed, A., 1992. A study of uncertainty in
applications of sea to coupled beam and plate systems
– Part I: Computational experiments. Journal of Sound
and Vibration, 158(1), pp.45-67.
Nightingale, T.R.T., Halliwell, R.E. & Pernica, G., 2004.
Estimating in-situ material properties of a wood joist
floor: Part 1 - Measurements of the real part of bending
wavenumber. Building Acoustics, 11(3), pp.175-96.
Nilsson, A. & Liu, B., 2016. Vibro-Acoustics, Vol. 1 and 2.
Second edition ed. Berlin Heidelberg: Springer-Verlag.
Nilsson, E. & Nilsson, A.C., 2002. Prediction and
measurement of some dynamic properties of sandwich
structures with honeycomb and foam cores. Journal of
Sound and Vibration, 251(3), pp.409-30.
Piana, E.A., 2016. A method for determining the sound
reduction index of precast panels based on point
mobility measurements. Applied Acoustics, 110, pp.72-
80.
Roelens, I., Nuytten, F., Bosmans, I. & Vermeir, G., 1997.
In situ measurement of the stiffness properties of
building components. Applied Acoustics, 52(3-4),
pp.289-309.
SIMULTECH 2016 - 6th International Conference on Simulation and Modeling Methodologies, Technologies and Applications
282
